Hillsborough: Fire Incidents, North Carolina (NC)
Where are fire incidents reported in Hillsborough, NC
Something went wrong! Please refresh the page.
|
| |||||||||||||||||||||||||||||||||||||||||||||||||||||||||||||||||||||||||||||||||||||||||||||||||||||||||||||
| Other | 174 | |||||||||||||||||||||||||||||||||||||||||||||||||||||||||||||||||||||||||||||||||||||||||||||||||||||||||||||
2004 - 2018 National Fire Incident Reporting System (NFIRS) incidents
- Incident types reported to NFIRS in Hillsborough, NC
- 2,78635.6%Rescue & EMS
- 1,42218.2%Fire
- 1,25216.0%Good Intent Call
- 1,15314.7%Hazardous Condition
- 6077.8%Service Call
- 5426.9%False Alarm
- 410.5%Overpressure Rupture
- 170.2%Severe Weather
- 120.2%Special Incident
- Fire incident types reported to NFIRS in Hillsborough, NC
- 62243.7%Structure Fires
- 56639.8%Outside Fires
- 20314.3%Mobile Property/Vehicle Fires
- 312.2%Other
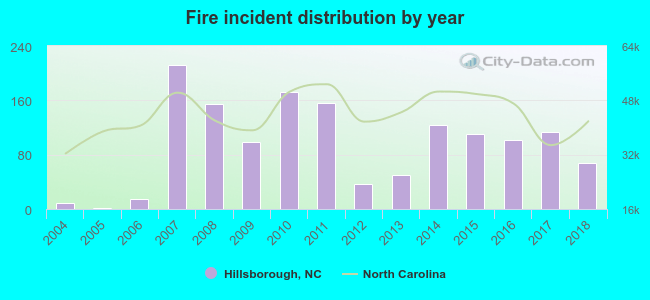 According to the data from the years 2004 - 2018 the average number of fire incidents per year is 95. The highest number of reported fire incidents - 212 took place in 2007, and the least - 2 in 2005. The data has an increasing trend.
The average number of yearly fire incidents per 10k residents in Hillsborough, NC compared to nearest cities:
(Note: Based on data for the last 3 years, including only cities with population 5,000 and above)
| Hillsborough: | 146.6 |
| Mebane: | 102.7 |
| Carrboro: | 29.5 |
| Chapel Hill: | 39.1 |
| Durham: | 32.5 |
| Graham: | 45.8 |
| Burlington: | 55.4 |
| Butner: | 13.0 |
| Elon: | 49.2 |
 The median response time based on all reported fire incidents is 8 minutes. This is higher than the North Carolina median value.
The median response time in Hillsborough, NC compared to nearest cities:
(Note: Based on data for all years, including only cities with at least 500 fire incidents)
| Hillsborough: | 8 minutes |
| Mebane: | 7 minutes |
| Carrboro: | 4 minutes |
| Chapel Hill: | 5 minutes |
| Durham: | 5 minutes |
| Graham: | 6 minutes |
| Burlington: | 5 minutes |
| Elon: | 6 minutes |
| Roxboro: | 8 minutes |
 30.5% incidents where reported in the morning and 69.5% in the evening. The most fires (16.2%) took place on Saturday, and the least (13.0%) on Thursday.
 According to the 1,422 reports from years 2004 - 2018 most fires (13.6%) took place during February, and the least (5.3%) in May.
 Out of all 7,832 cases reported during the years 2004 - 2018, the most belonged to the categories: Rescue & EMS (35.6%), Fire (18.2%), and Good Intent Call (16.0%).
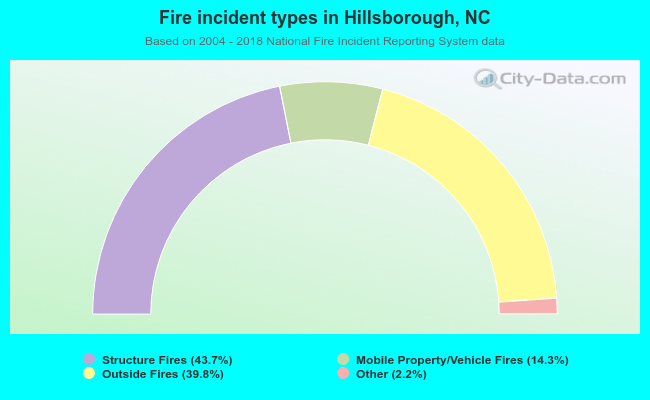 When looking into fire subcategories, the most incidents belonged to: Structure Fires (43.7%), and Outside Fires (39.8%).