Butner: Fire Incidents, North Carolina (NC)
Where are fire incidents reported in Butner, NC
Something went wrong! Please refresh the page.
|
| |||||||||||||||||||||||||||||||||||||||||||||||||||||||||||||||||||||||||||||||||||||||||||||||||||||||||||||
2002 - 2018 National Fire Incident Reporting System (NFIRS) incidents
- Incident types reported to NFIRS in Butner, NC
- 71039.4%False Alarm
- 47926.6%Fire
- 29616.4%Hazardous Condition
- 1699.4%Rescue & EMS
- 1055.8%Good Intent Call
- 281.6%Service Call
- 60.3%Overpressure Rupture
- 60.3%Special Incident
- Fire incident types reported to NFIRS in Butner, NC
- 17035.5%Structure Fires
- 16434.2%Outside Fires
- 10822.5%Mobile Property/Vehicle Fires
- 377.7%Other
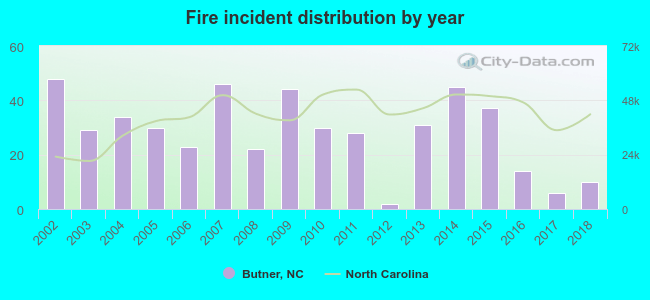 According to the data from the years 2002 - 2018 the average number of fires per year is 28. The highest number of fire incidents - 48 took place in 2002, and the least - 2 in 2012. The data has a decreasing trend.
The average number of yearly fire incidents per 10k residents in Butner, NC compared to nearest cities:
(Note: Based on data for the last 3 years, including only cities with population 5,000 and above)
| Butner: | 13.0 |
| Durham: | 32.5 |
| Oxford: | 123.2 |
| Wake Forest: | 42.9 |
| Hillsborough: | 146.6 |
| Roxboro: | 203.9 |
| Chapel Hill: | 39.1 |
| Morrisville: | 25.0 |
| Rolesville: | 25.9 |

 According to the data from the years 2002 - 2018 the average number of fire-related casualties per year is 1. The highest number of reported injuries - 3 took place in 2014, and the lowest - 0 in 2002. The data has a constant trend.
 30.7% incidents where reported in the morning and 69.3% in the evening. The most fires (16.3%) took place on Friday, and the least (11.3%) on Saturday.
 According to the 479 fires from years 2002 - 2018 most fires (10.2%) took place during February, and the least (6.3%) in October.
 Out of all 1,800 cases reported during the years 2002 - 2018, the most belonged to the categories: False Alarm (39.4%), Fire (26.6%), and Hazardous Condition (16.4%).
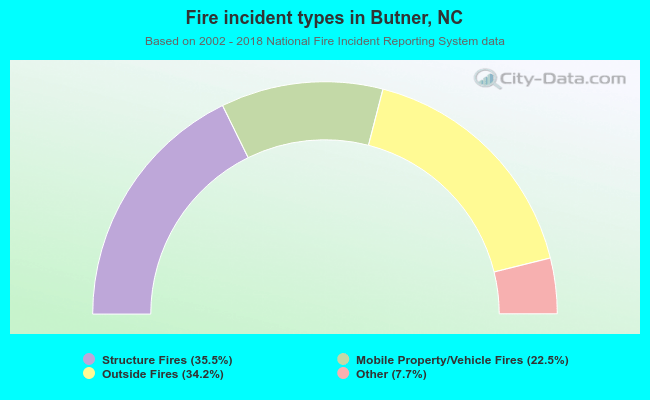 When looking into fire subcategories, the most reports belonged to: Structure Fires (35.5%), and Outside Fires (34.2%).