Chapel Hill: Fire Incidents, North Carolina (NC)
Where are fire incidents reported in Chapel Hill, NC
Something went wrong! Please refresh the page.
| Fire incidents reported | |
|---|---|
| Sreet name | Count |
| FRANKLIN ST | 232 |
| ESTES DR | 132 |
| MANNING DR | 114 |
| FORDHAM BLVD | 108 |
| WEAVER DAIRY RD | 96 |
| CAMERON AVE | 86 |
| COLUMBIA ST | 82 |
| NC 54 | 78 |
| ROSEMARY ST | 78 |
| JONES FERRY RD | 66 |
| SMITH LEVEL RD | 66 |
| MARTIN LUTHER KING JR. BLVD | 62 |
| MASON FARM RD | 54 |
| OLD GREENSBORO HWY | 54 |
| WHITE CROSS RD | 52 |
| SOUTH RD | 50 |
| EPHESUS CHURCH RD | 46 |
| NC 54 HWY | 46 |
| PINEGATE CIR | 46 |
| PRITCHARD AVE | 46 |
| UMSTEAD DR | 46 |
| 54 BYP | 44 |
| HOMESTEAD RD | 44 |
| ELLIOTT RD | 42 |
| MARTIN LUTHER KING JR BLVD | 42 |
| DOBBINS DR | 40 |
| CHURCH ST | 38 |
| FARRINGTON RD | 36 |
| MERRITT MILL RD | 36 |
| DAMASCUS CHURCH RD | 34 |
| Other | 1,711 |
2002 - 2018 National Fire Incident Reporting System (NFIRS) incidents
- Incident types reported to NFIRS in Chapel Hill, NC
- 14,29540.6%Rescue & EMS
- 5,90316.8%False Alarm
- 5,52115.7%Hazardous Condition
- 4,15211.8%Good Intent Call
- 3,70710.5%Fire
- 1,4114.0%Service Call
- 730.2%Special Incident
- 620.2%Overpressure Rupture
- 570.2%Severe Weather
- Fire incident types reported to NFIRS in Chapel Hill, NC
- 1,69945.8%Structure Fires
- 1,30835.3%Outside Fires
- 48413.1%Mobile Property/Vehicle Fires
- 2165.8%Other
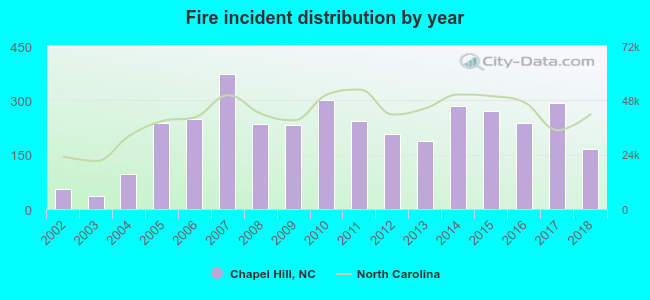 Based on the data from the years 2002 - 2018 the average number of fires per year is 218. The highest number of reported fires - 373 took place in 2007, and the least - 36 in 2003. The data has a growing trend.
The average number of yearly fire incidents per 10k residents in Chapel Hill, NC compared to nearest cities:
(Note: Based on data for the last 3 years, including only cities with population 5,000 and above)
| Chapel Hill: | 39.1 |
| Carrboro: | 29.5 |
| Durham: | 32.5 |
| Hillsborough: | 146.6 |
| Morrisville: | 25.0 |
| Cary: | 16.8 |
| Apex: | 26.2 |
| Mebane: | 102.7 |
| Butner: | 13.0 |
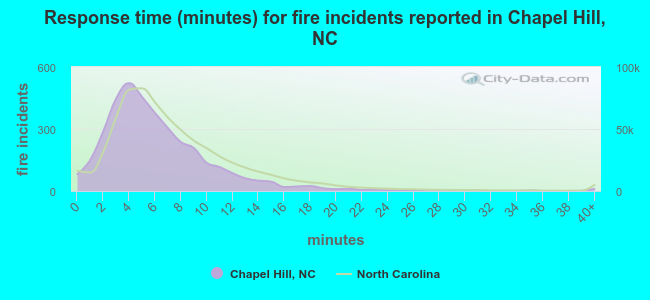 The median response time based on all reported fire incidents is 5 minutes. This is lower than the state median value.
The median response time in Chapel Hill, NC compared to nearest cities:
(Note: Based on data for all years, including only cities with at least 500 fire incidents)
| Chapel Hill: | 5 minutes |
| Carrboro: | 4 minutes |
| Durham: | 5 minutes |
| Hillsborough: | 8 minutes |
| Morrisville: | 6 minutes |
| Pittsboro: | 8 minutes |
| Cary: | 5 minutes |
| Apex: | 6 minutes |
| Mebane: | 7 minutes |
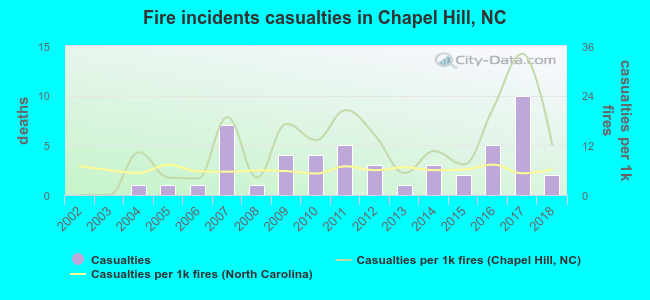 According to the reports from the years 2002 - 2018 the average number of fire-related casualties per year is 3. The highest number of reported injuries - 10 took place in 2017, and the lowest - 0 in 2002. The data has a growing trend.
The average number of injuries per 1,000 fires is 12. This indicator was the highest - 34 in 2017, and the lowest 0 in 2002. The trend for injuries per 1,000 fires is growing. Compared to the North Carolina value the number of injuries per 1,000 fire incidents is much higher.
According to the reports from the years 2002 - 2018 the average number of fire-related casualties per year is 3. The highest number of reported injuries - 10 took place in 2017, and the lowest - 0 in 2002. The data has a growing trend.
The average number of injuries per 1,000 fires is 12. This indicator was the highest - 34 in 2017, and the lowest 0 in 2002. The trend for injuries per 1,000 fires is growing. Compared to the North Carolina value the number of injuries per 1,000 fire incidents is much higher.Casualties per 1,000 incidents in Chapel Hill, NC compared to nearest cities:
(Note: Based on data for all years, including only cities with at least 500 fire incidents)
| Chapel Hill: | 13.5 |
| Carrboro: | 17.5 |
| Durham: | 6.1 |
| Hillsborough: | 1.4 |
| Morrisville: | 6.8 |
| Pittsboro: | 0.7 |
| Cary: | 12.2 |
| Apex: | 6.6 |
| Mebane: | 8.1 |
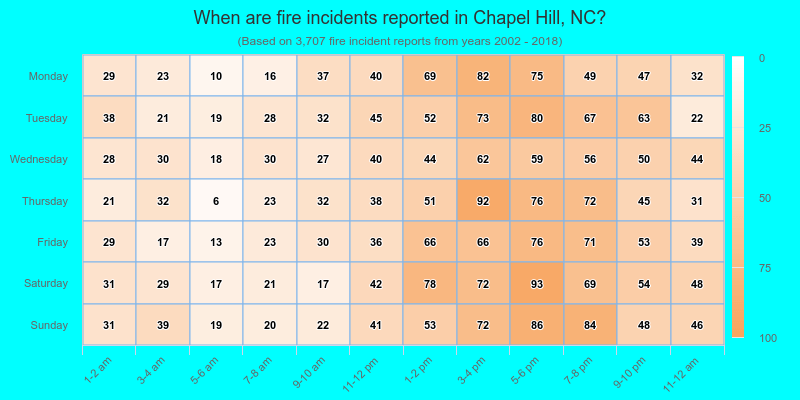
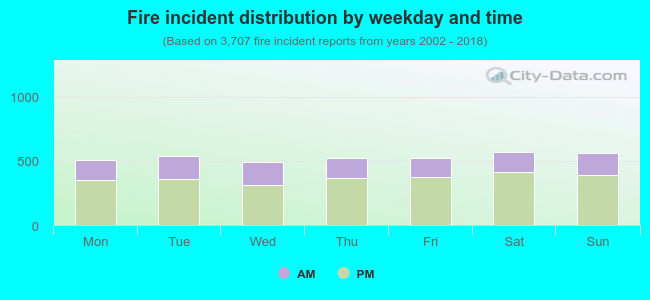 30.8% incidents where reported in the morning and 69.2% in the evening. The most fires (15.4%) took place on Saturday, and the least (13.2%) on Wednesday.
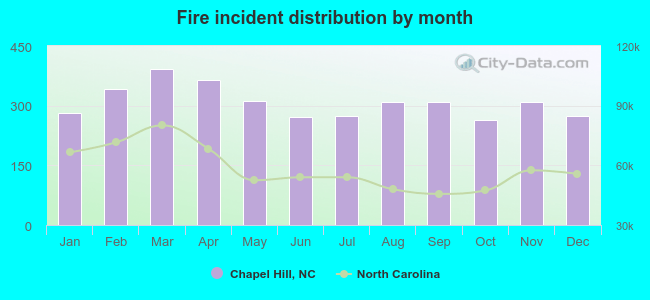 Based on the 3,707 fire incident reports from years 2002 - 2018 most fires (10.6%) took place during March, and the least (7.1%) in October.
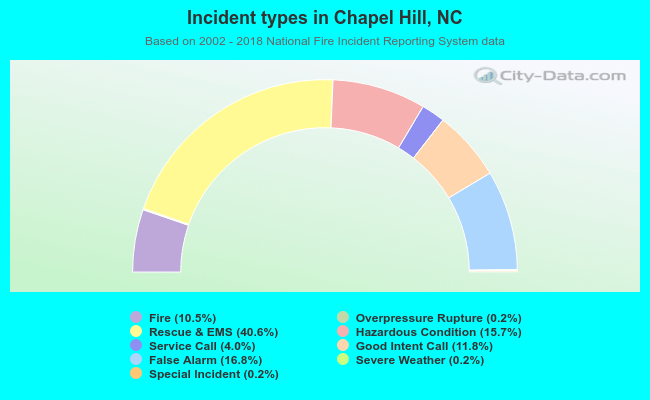 Out of all 35,181 cases reported during the years 2002 - 2018, the most belonged to the categories: Rescue & EMS (40.6%), False Alarm (16.8%), and Hazardous Condition (15.7%).
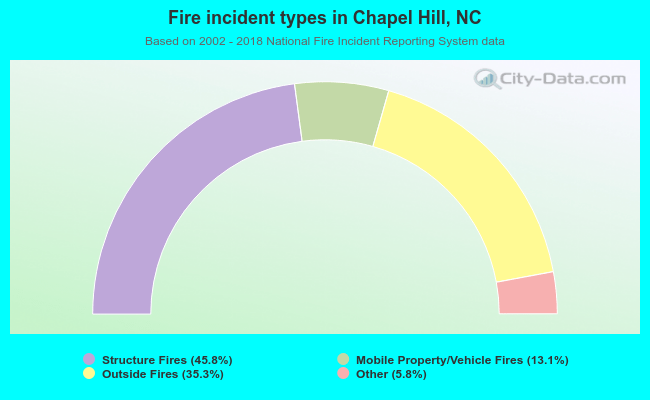 When looking into fire subcategories, the most incidents belonged to: Structure Fires (45.8%), and Outside Fires (35.3%).