Herrin: Fire Incidents, Illinois (IL)
Where are fire incidents reported in Herrin, IL
Something went wrong! Please refresh the page.
| Fire incidents reported | |
|---|---|
| Sreet name | Count |
| PARK AVE | 114 |
| 13TH ST | 78 |
| 14TH ST | 78 |
| 9TH ST | 70 |
| 16TH ST | 64 |
| PARK AVENUE AVE | 60 |
| 12TH ST | 54 |
| 20TH ST | 46 |
| MONROE ST | 42 |
| CHERRY ST | 40 |
| 8TH ST | 38 |
| BANDYVILLE RD | 38 |
| 22ND ST | 32 |
| 18TH ST | 30 |
| 19TH ST | 30 |
| 23RD ST | 30 |
| 11TH ST | 26 |
| OAK ST | 26 |
| WEAVER RD | 26 |
| MADISON ST | 24 |
| STOTLAR ST | 24 |
| 10TH ST | 22 |
| 37TH ST | 22 |
| ALLEN ROAD RD | 22 |
| 17TH ST | 20 |
| 27TH ST | 20 |
| 7TH ST | 20 |
| HERRIN RD | 20 |
| ORCHARD DR | 20 |
| TAYLOR ST | 20 |
2002 - 2018 National Fire Incident Reporting System (NFIRS) incidents
- Incident types reported to NFIRS in Herrin, IL
- 1,04831.0%Fire
- 63818.9%Hazardous Condition
- 48814.4%False Alarm
- 48314.3%Service Call
- 34210.1%Rescue & EMS
- 3219.5%Good Intent Call
- 461.4%Special Incident
- 80.2%Overpressure Rupture
- 40.1%Severe Weather
- Fire incident types reported to NFIRS in Herrin, IL
- 48346.1%Structure Fires
- 37335.6%Outside Fires
- 16715.9%Mobile Property/Vehicle Fires
- 252.4%Other
 Based on the data from the years 2002 - 2018 the average number of fires per year is 62. The highest number of reported fire incidents - 82 took place in 2011, and the least - 40 in 2008. The data has an increasing trend.
The average number of yearly fire incidents per 10k residents in Herrin, IL compared to nearest cities:
(Note: Based on data for the last 3 years, including only cities with population 5,000 and above)
| Herrin: | 51.6 |
| Carterville: | 69.3 |
| Marion: | 107.8 |
| West Frankfort: | 153.5 |
| Carbondale: | 52.3 |
| Benton: | 150.6 |
| Murphysboro: | 108.4 |
| Du Quoin: | 63.8 |
| Harrisburg: | 71.4 |
 The median response time based on all reported fire incidents is 4 minutes. This is lower than the state median value.
The median response time in Herrin, IL compared to nearest cities:
(Note: Based on data for all years, including only cities with at least 500 fire incidents)
| Herrin: | 4 minutes |
| Carterville: | 6 minutes |
| Johnston City: | 6 minutes |
| Marion: | 5 minutes |
| Mitchell: | 5 minutes |
| West Frankfort: | 5 minutes |
| Carbondale: | 4 minutes |
| Benton: | 4 minutes |
| Murphysboro: | 5 minutes |
 According to the reports from the years 2002 - 2018 the average number of fire-related yearly casualties is 0. The highest number of injuries - 2 took place in 2002, and the lowest - 0 in 2003. The data has a declining trend.
The average number of injuries per 1,000 fire incidents is 3. This indicator was the highest - 31 in 2002, and the lowest 0 in 2003. The trend for casualties per 1,000 incidents is decreasing. Compared to the state value the number of injuries per 1,000 fire incidents is much lower.
According to the reports from the years 2002 - 2018 the average number of fire-related yearly casualties is 0. The highest number of injuries - 2 took place in 2002, and the lowest - 0 in 2003. The data has a declining trend.
The average number of injuries per 1,000 fire incidents is 3. This indicator was the highest - 31 in 2002, and the lowest 0 in 2003. The trend for casualties per 1,000 incidents is decreasing. Compared to the state value the number of injuries per 1,000 fire incidents is much lower.Casualties per 1,000 incidents in Herrin, IL compared to nearest cities:
(Note: Based on data for all years, including only cities with at least 500 fire incidents)
| Herrin: | 3.8 |
| Carterville: | 1.8 |
| Johnston City: | 1.3 |
| Marion: | 6.2 |
| Mitchell: | 5.9 |
| West Frankfort: | 6.2 |
| Carbondale: | 24.0 |
| Benton: | 7.0 |
| Murphysboro: | 15.5 |
 31.2% incidents where reported in the morning and 68.8% in the evening. The most fires (16.4%) took place on Sunday, and the least (11.9%) on Friday.
 According to the 1,048 fire incidents from years 2002 - 2018 most fires (12.4%) took place during March, and the least (6.5%) in December.
 Out of all 3,378 cases reported during the years 2002 - 2018, the most belonged to the categories: Fire (31.0%), Hazardous Condition (18.9%), and False Alarm (14.4%).
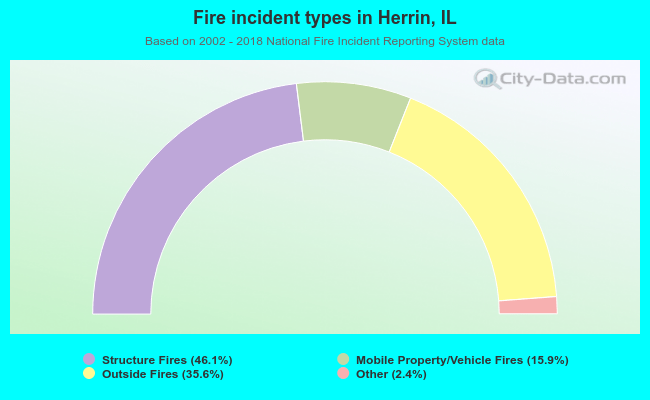 When looking into fire subcategories, the most incidents belonged to: Structure Fires (46.1%), and Outside Fires (35.6%).