Harrisburg: Fire Incidents, Illinois (IL)
Where are fire incidents reported in Harrisburg, IL
Something went wrong! Please refresh the page.
| Fire incidents reported | |
|---|---|
| Sreet name | Count |
| COMMERCIAL ST | 64 |
| GRANGER ST | 60 |
| POPLAR ST | 58 |
| SLOAN ST | 50 |
| WEBSTER ST | 50 |
| CHURCH ST | 48 |
| MAIN ST | 48 |
| MCKINLEY AVE | 42 |
| BARNETT ST | 40 |
| SOUTH ST | 34 |
| LIBERTY RD | 30 |
| FEAZEL ST | 28 |
| RAYMOND ST | 28 |
| LINCOLN AVE | 26 |
| SOMERSET RD | 24 |
| LEDFORD ST | 20 |
| LOCUST ST | 20 |
| RT. 145 HWY | 20 |
| RT. 45 HWY | 20 |
| ST ROUTE 145 | 20 |
| WALNUT ST | 20 |
| HOMER AVE | 18 |
| LAND ST | 18 |
| LEDFORD RD | 18 |
| ROSE ST | 18 |
| RT. 34 HWY | 18 |
| ZOLA RD | 18 |
| DORRIS HEIGHTS RD | 16 |
| ELM ST | 16 |
| MCHANEY AVE | 16 |
| Other | 110 |
2002 - 2018 National Fire Incident Reporting System (NFIRS) incidents
- Incident types reported to NFIRS in Harrisburg, IL
- 1,01656.1%Fire
- 24413.5%False Alarm
- 23312.9%Service Call
- 1498.2%Hazardous Condition
- 945.2%Good Intent Call
- 593.3%Rescue & EMS
- 60.3%Overpressure Rupture
- 50.3%Severe Weather
- 40.2%Special Incident
- Fire incident types reported to NFIRS in Harrisburg, IL
- 46345.6%Structure Fires
- 35534.9%Outside Fires
- 18418.1%Mobile Property/Vehicle Fires
- 141.4%Other
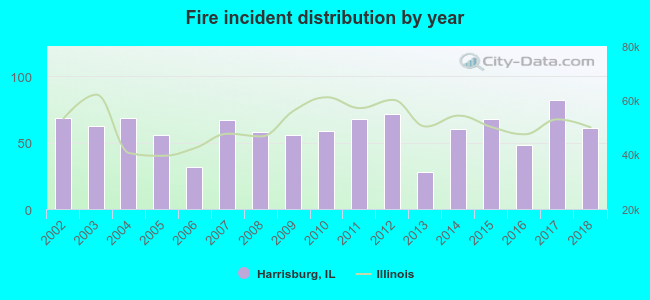 According to the data from the years 2002 - 2018 the average number of fire incidents per year is 60. The highest number of reported fires - 82 took place in 2017, and the least - 28 in 2013. The data has a declining trend.
The average number of yearly fire incidents per 10k residents in Harrisburg, IL compared to nearest cities:
(Note: Based on data for the last 3 years, including only cities with population 5,000 and above)
| Harrisburg: | 71.4 |
| Marion: | 107.8 |
| West Frankfort: | 153.5 |
| Herrin: | 51.6 |
| Benton: | 150.6 |
| Carterville: | 69.3 |
| Carmi: | 87.0 |
| Carbondale: | 52.3 |
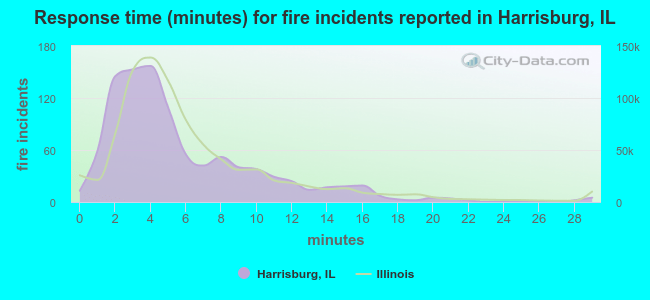 The median response time based on all reported fire incidents is 4 minutes. This is lower than the Illinois median value.
The median response time in Harrisburg, IL compared to nearest cities:
(Note: Based on data for all years, including only cities with at least 500 fire incidents)
| Harrisburg: | 4 minutes |
| Marion: | 5 minutes |
| Johnston City: | 6 minutes |
| West Frankfort: | 5 minutes |
| Herrin: | 4 minutes |
| Benton: | 4 minutes |
| Carterville: | 6 minutes |
| Mitchell: | 5 minutes |
| Carbondale: | 4 minutes |
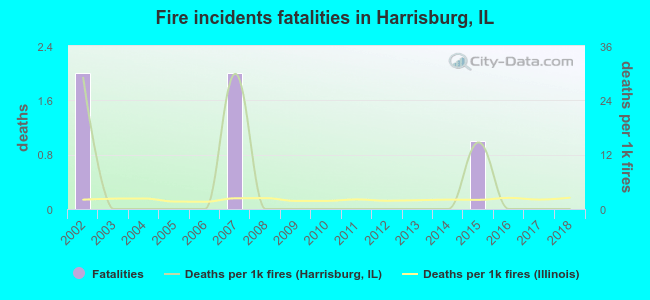 According to the data from the years 2002 - 2018 the average number of fire-related fatalities per year is 0. The highest number of reported deaths - 2 took place in 2002, and the lowest - 0 in 2003. The data has a declining trend.
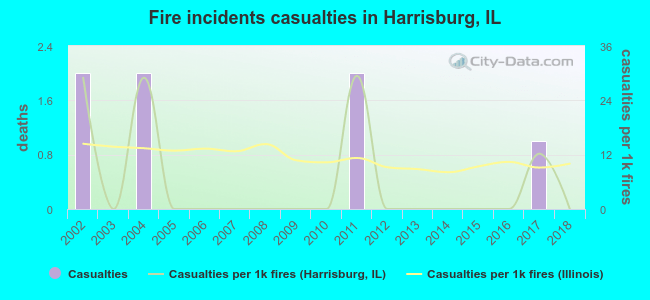 Based on the reports from the years 2002 - 2018 the average number of fire-related yearly casualties is 0. The highest number of reported casualties - 2 took place in 2002, and the lowest - 0 in 2003. The data has a decreasing trend.
The average number of injuries per 1,000 fires is 6. This indicator was the highest - 29 in 2011, and the lowest 0 in 2003. The trend for casualties per 1,000 fire incidents is decreasing. Compared to the Illinois value the number of injuries per 1,000 fire incidents is lower.
Based on the reports from the years 2002 - 2018 the average number of fire-related yearly casualties is 0. The highest number of reported casualties - 2 took place in 2002, and the lowest - 0 in 2003. The data has a decreasing trend.
The average number of injuries per 1,000 fires is 6. This indicator was the highest - 29 in 2011, and the lowest 0 in 2003. The trend for casualties per 1,000 fire incidents is decreasing. Compared to the Illinois value the number of injuries per 1,000 fire incidents is lower.Casualties per 1,000 incidents in Harrisburg, IL compared to nearest cities:
(Note: Based on data for all years, including only cities with at least 500 fire incidents)
| Harrisburg: | 6.9 |
| Marion: | 6.2 |
| Johnston City: | 1.3 |
| West Frankfort: | 6.2 |
| Herrin: | 3.8 |
| Benton: | 7.0 |
| Carterville: | 1.8 |
| Mitchell: | 5.9 |
| Carbondale: | 24.0 |
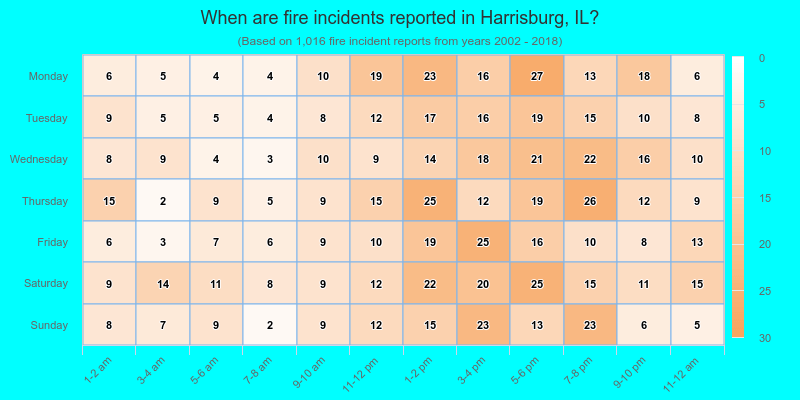
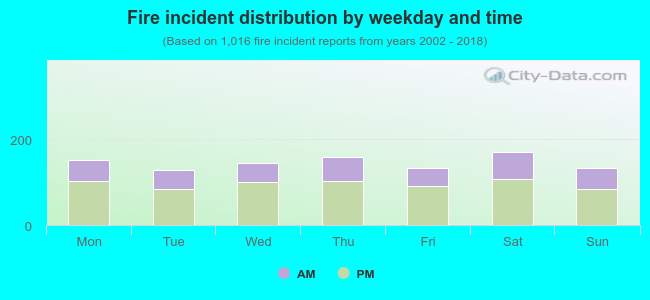 33.5% incidents where reported in the morning and 66.5% in the evening. The most fires (16.8%) took place on Saturday, and the least (12.6%) on Tuesday.
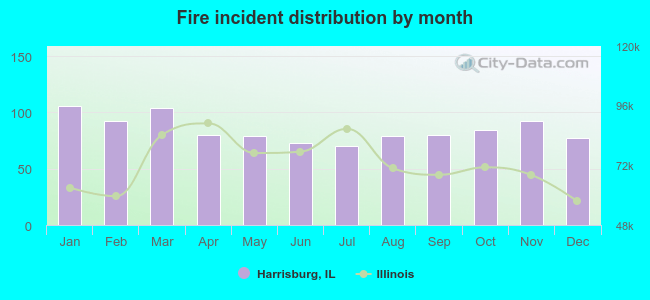 Based on the 1,016 reports from years 2002 - 2018 most fires (10.4%) took place during January, and the least (6.9%) in July.
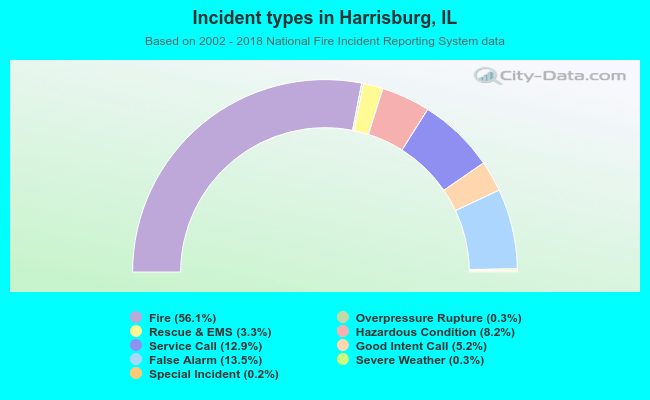 Out of all 1,810 cases reported during the years 2002 - 2018, the most belonged to the categories: Fire (56.1%), False Alarm (13.5%), and Service Call (12.9%).
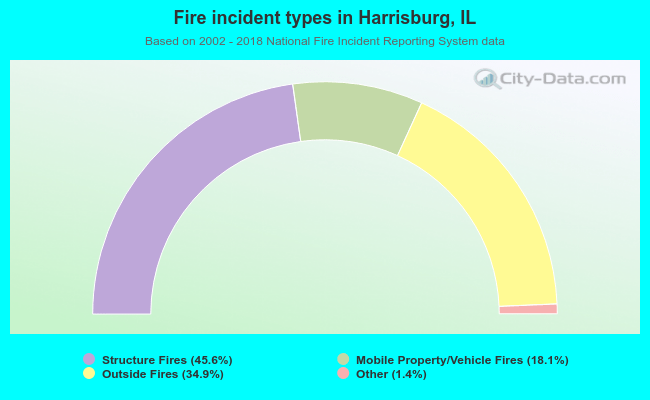 When looking into fire subcategories, the most incidents belonged to: Structure Fires (45.6%), and Outside Fires (34.9%).