Carbondale: Fire Incidents, Illinois (IL)
Where are fire incidents reported in Carbondale, IL
Something went wrong! Please refresh the page.
| Fire incidents reported | |
|---|---|
| Sreet name | Count |
| GRAND AVE | 594 |
| MAIN ST | 434 |
| ILLINOIS AVE | 338 |
| WALL ST | 260 |
| COLLEGE ST | 252 |
| MILL ST | 156 |
| WALNUT ST | 150 |
| UNIVERSITY AVE | 126 |
| PARK ST | 122 |
| LEWIS LN | 104 |
| WASHINGTON ST | 100 |
| ASH ST | 94 |
| CHERRY ST | 88 |
| FREEMAN ST | 86 |
| POPLAR ST | 82 |
| BEVERIDGE ST | 76 |
| EVERGREEN TERRACE DR | 68 |
| RAWLINGS ST | 68 |
| GIANT CITY RD | 66 |
| JACKSON ST | 60 |
| GRAND AVENUE, E. | 58 |
| NEELY DR | 56 |
| NEW ERA RD | 52 |
| CAMPUS DR | 48 |
| PLEASANT HILL RD | 48 |
| MARION ST | 46 |
| OAKLAND AVE | 46 |
| HESTER ST | 42 |
| LINCOLN DR | 42 |
| SALUKI BLVD | 42 |
2002 - 2018 National Fire Incident Reporting System (NFIRS) incidents
- Incident types reported to NFIRS in Carbondale, IL
- 3,40730.5%False Alarm
- 3,12728.0%Fire
- 1,89617.0%Hazardous Condition
- 1,23511.1%Rescue & EMS
- 7586.8%Good Intent Call
- 6916.2%Service Call
- 230.2%Severe Weather
- 200.2%Overpressure Rupture
- Fire incident types reported to NFIRS in Carbondale, IL
- 1,52248.7%Outside Fires
- 1,19838.3%Structure Fires
- 38212.2%Mobile Property/Vehicle Fires
- 250.8%Other
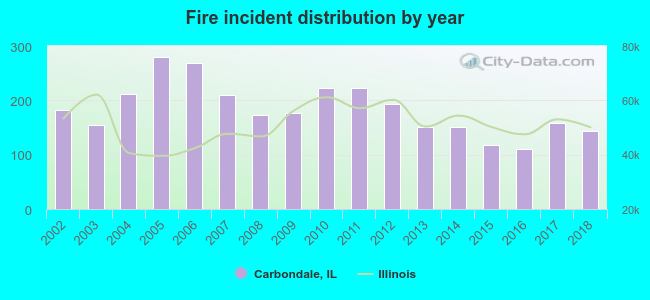 Based on the data from the years 2002 - 2018 the average number of fire incidents per year is 184. The highest number of fire incidents - 280 took place in 2005, and the least - 111 in 2016. The data has a declining trend.
The average number of yearly fire incidents per 10k residents in Carbondale, IL compared to nearest cities:
(Note: Based on data for the last 3 years, including only cities with population 5,000 and above)
| Carbondale: | 52.3 |
| Murphysboro: | 108.4 |
| Carterville: | 69.3 |
| Herrin: | 51.6 |
| Marion: | 107.8 |
| Du Quoin: | 63.8 |
| West Frankfort: | 153.5 |
| Benton: | 150.6 |
| Pinckneyville: | 36.7 |
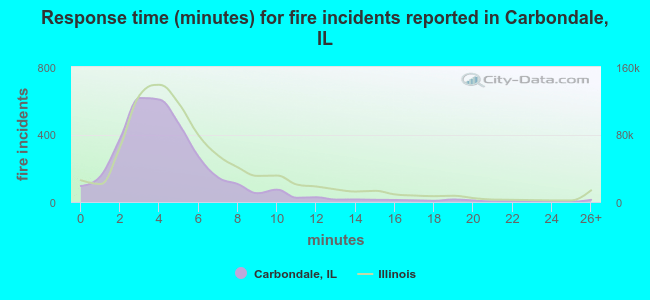 The median response time based on all reported fire incidents is 4 minutes. This is lower than the Illinois median value.
The median response time in Carbondale, IL compared to nearest cities:
(Note: Based on data for all years, including only cities with at least 500 fire incidents)
| Carbondale: | 4 minutes |
| Murphysboro: | 5 minutes |
| Carterville: | 6 minutes |
| Herrin: | 4 minutes |
| Marion: | 5 minutes |
| Mitchell: | 5 minutes |
| Johnston City: | 6 minutes |
| Anna: | 5 minutes |
| West Frankfort: | 5 minutes |
 According to the data from the years 2002 - 2018 the average number of fire-related yearly deaths is 0. The highest number of deaths - 1 took place in 2004, and the lowest - 0 in 2002. The data has a constant trend.
The average number of fatalities per 1,000 fires is 1. This indicator was the highest - 9 in 2016, and the lowest 0 in 2002. The trend for deaths per 1,000 fire incidents is constant. Compared to the Illinois value the number of deaths per 1,000 fires is lower.
According to the data from the years 2002 - 2018 the average number of fire-related yearly deaths is 0. The highest number of deaths - 1 took place in 2004, and the lowest - 0 in 2002. The data has a constant trend.
The average number of fatalities per 1,000 fires is 1. This indicator was the highest - 9 in 2016, and the lowest 0 in 2002. The trend for deaths per 1,000 fire incidents is constant. Compared to the Illinois value the number of deaths per 1,000 fires is lower.Deaths per 1,000 incidents in Carbondale, IL compared to nearest cities:
(Note: Based on data for all years, including only cities with at least 2,500 fire incidents)
| Carbondale: | 1.3 |
| Marion: | 1.5 |
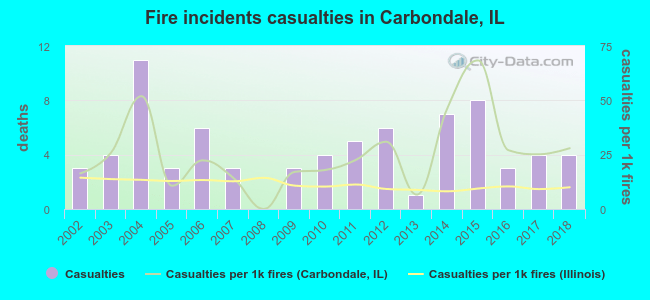 Based on the data from the years 2002 - 2018 the average number of fire-related casualties per year is 4. The highest number of injuries - 11 took place in 2004, and the lowest - 0 in 2008. The data has a rising trend.
The average number of casualties per 1,000 fire incidents is 25. This indicator was the highest - 68 in 2015, and the lowest 0 in 2008. The trend for injuries per 1,000 fire incidents is rising. Compared to the Illinois value the number of injuries per 1,000 fires is much higher.
Based on the data from the years 2002 - 2018 the average number of fire-related casualties per year is 4. The highest number of injuries - 11 took place in 2004, and the lowest - 0 in 2008. The data has a rising trend.
The average number of casualties per 1,000 fire incidents is 25. This indicator was the highest - 68 in 2015, and the lowest 0 in 2008. The trend for injuries per 1,000 fire incidents is rising. Compared to the Illinois value the number of injuries per 1,000 fires is much higher.Casualties per 1,000 incidents in Carbondale, IL compared to nearest cities:
(Note: Based on data for all years, including only cities with at least 500 fire incidents)
| Carbondale: | 24.0 |
| Murphysboro: | 15.5 |
| Carterville: | 1.8 |
| Herrin: | 3.8 |
| Marion: | 6.2 |
| Mitchell: | 5.9 |
| Johnston City: | 1.3 |
| Anna: | 3.6 |
| West Frankfort: | 6.2 |
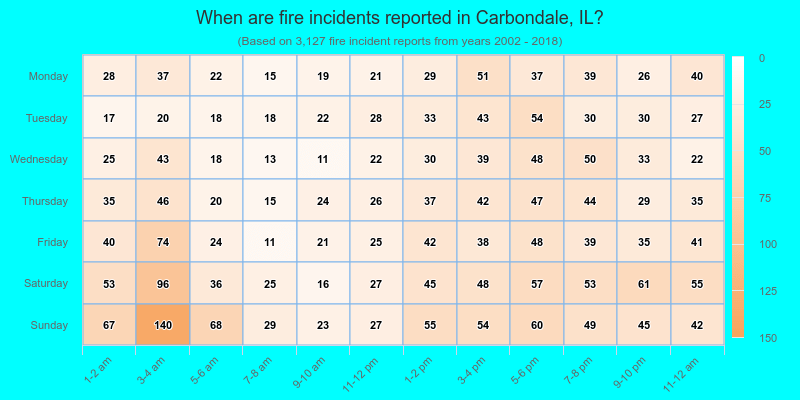
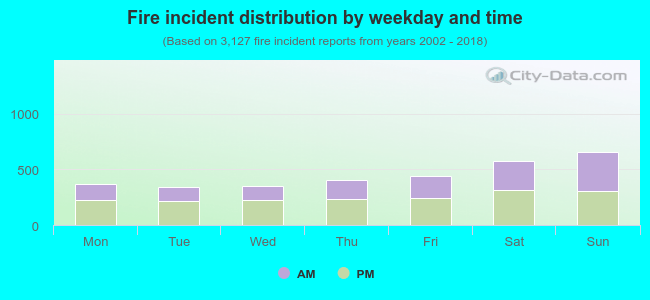 43.7% incidents where reported in the morning and 56.3% in the evening. The most fires (21.1%) took place on Sunday, and the least (10.9%) on Tuesday.
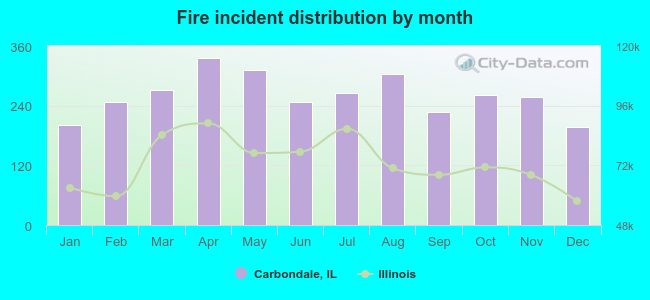 Based on the 3,127 fires from years 2002 - 2018 most fires (10.7%) took place during April, and the least (6.3%) in December.
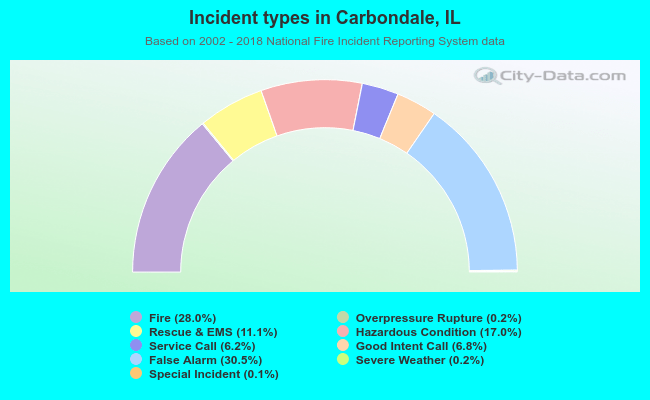 Out of all 11,165 cases reported during the years 2002 - 2018, the most belonged to the categories: False Alarm (30.5%), Fire (28.0%), and Hazardous Condition (17.0%).
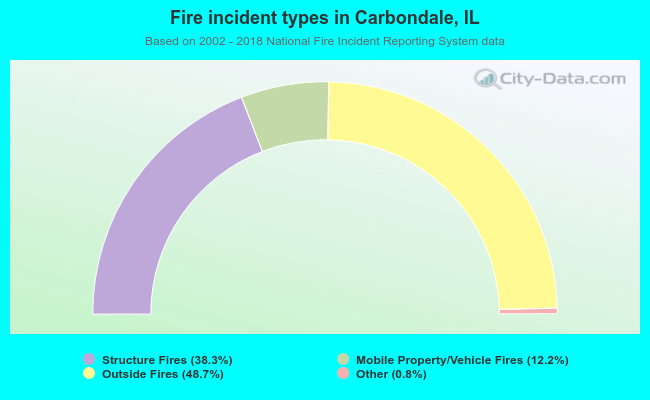 When looking into fire subcategories, the most incidents belonged to: Outside Fires (48.7%), and Structure Fires (38.3%).