Havre de Grace: Fire Incidents, Maryland (MD)
Where are fire incidents reported in Havre de Grace, MD
Something went wrong! Please refresh the page.
| Fire incidents reported | |
|---|---|
| Sreet name | Count |
| PULASKI HWY | 102 |
| PULASKI HWY | 52 |
| OLD LEVEL RD | 42 |
| UNION AVE | 42 |
| REVOLUTION ST | 40 |
| REVOLUTION ST | 36 |
| CHAPEL RD | 30 |
| S UNION AVE | 26 |
| CHAPEL RD | 22 |
| WASHINGTON ST | 22 |
| BEL AIR AVE | 20 |
| GRAVEL HILL RD | 20 |
| LEVEL RD | 20 |
| LEVEL RD | 20 |
| LEWIS LN | 20 |
| STOKES ST | 20 |
| WILKINSON RD | 20 |
| CONGRESS AVE | 18 |
| DARLINGTON RD | 18 |
| GREEN SPRING RD | 18 |
| INTERSTATE 95 SOUTHBOUND | 18 |
| JUNIATA ST | 16 |
| BATTERY DR | 14 |
| EARLTON RD | 14 |
| FRANKLIN ST | 14 |
| GREEN ST | 14 |
| MARKET ST | 14 |
| PARADISE RD | 14 |
| PENNINGTON AVE | 14 |
| ROCK RUN RD | 14 |
| Other | 565 |
2002 - 2018 National Fire Incident Reporting System (NFIRS) incidents
- Incident types reported to NFIRS in Havre de Grace, MD
- 11,90251.0%Rescue & EMS
- 7,63632.7%Good Intent Call
- 1,5956.8%Hazardous Condition
- 1,3195.6%Fire
- 4772.0%False Alarm
- 2531.1%Service Call
- 1490.6%Special Incident
- Fire incident types reported to NFIRS in Havre de Grace, MD
- 73856.0%Structure Fires
- 39529.9%Outside Fires
- 13610.3%Mobile Property/Vehicle Fires
- 503.8%Other
 Based on the data from the years 2002 - 2018 the average number of fire incidents per year is 78. The highest number of reported fire incidents - 166 took place in 2007, and the least - 15 in 2005. The data has a dropping trend.
The average number of yearly fire incidents per 10k residents in Havre de Grace, MD compared to nearest cities:
(Note: Based on data for the last 3 years, including only cities with population 5,000 and above)
| Havre de Grace: | 40.0 |
| Aberdeen: | 77.1 |
| Bel Air: | 159.8 |
| Edgewood: | 55.4 |
| Elkton: | 115.7 |
| Fallston: | 44.7 |
| White Marsh: | 31.9 |
| Perry Hall: | 2.6 |
| Chestertown: | 196.4 |
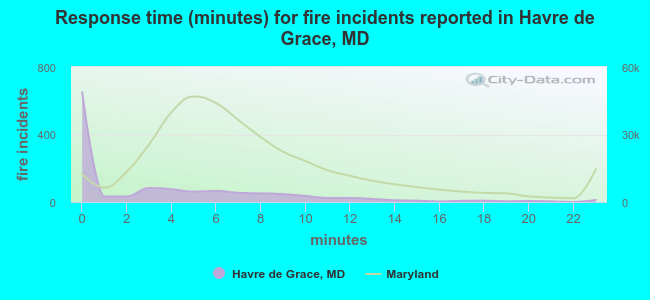 The median response time based on all reported fire incidents is 1 minutes. This is much lower than the Maryland median value.
The median response time in Havre de Grace, MD compared to nearest cities:
(Note: Based on data for all years, including only cities with at least 500 fire incidents)
| Havre de Grace: | 1 minutes |
| Perryville: | 9 minutes |
| Port Deposit: | 11 minutes |
| Aberdeen: | 7 minutes |
| Darlington: | 10 minutes |
| North East: | 10 minutes |
| Rising Sun: | 9 minutes |
| Bel Air: | 7 minutes |
| Edgewood: | 6 minutes |
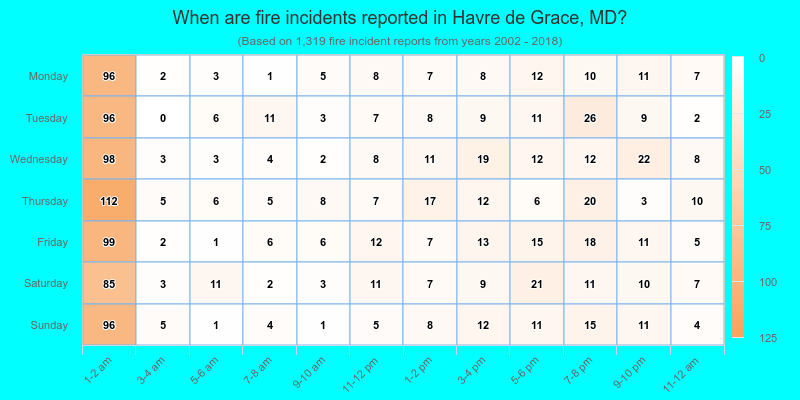
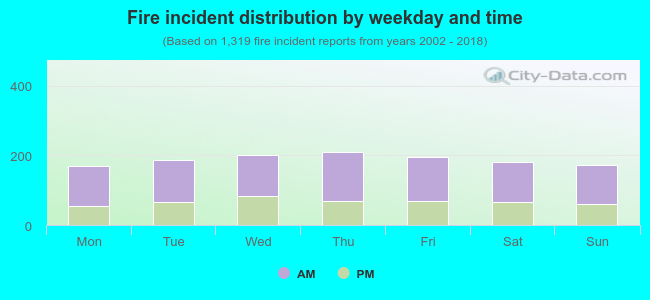 64.6% incidents where reported in the morning and 35.4% in the evening. The most fires (16.0%) took place on Thursday, and the least (12.9%) on Monday.
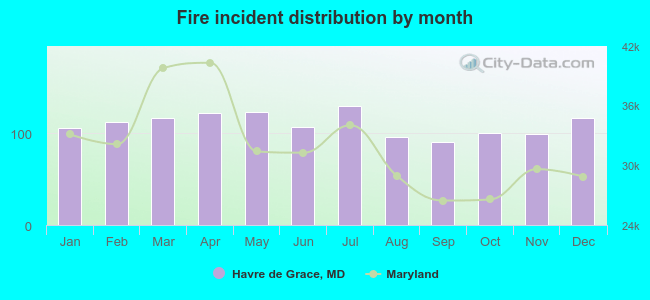 According to the 1,319 fire incident reports from years 2002 - 2018 most fires (9.9%) took place during July, and the least (6.8%) in September.
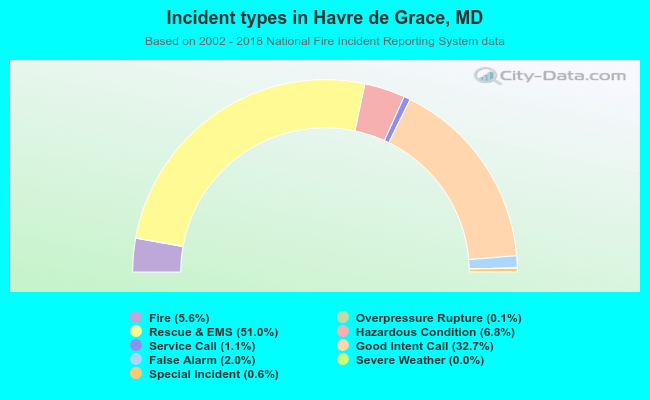 Out of all 23,356 cases reported during the years 2002 - 2018, the most belonged to the categories: Rescue & EMS (51.0%), Good Intent Call (32.7%), and Hazardous Condition (6.8%).
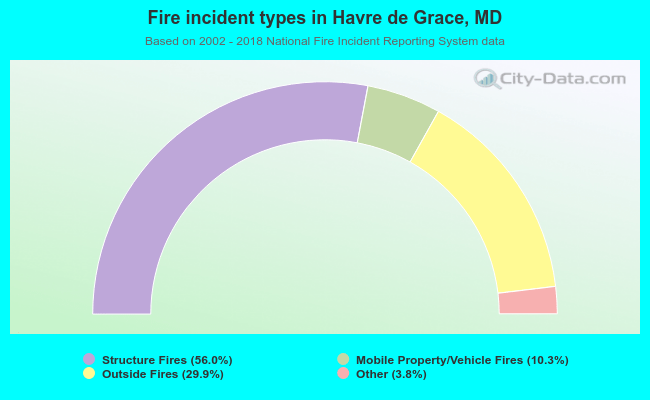 When looking into fire subcategories, the most incidents belonged to: Structure Fires (56.0%), and Outside Fires (29.9%).