Aberdeen: Fire Incidents, Maryland (MD)
Where are fire incidents reported in Aberdeen, MD
Something went wrong! Please refresh the page.
| Fire incidents reported | |
|---|---|
| Sreet name | Count |
| BEARDS HILL RD | 102 |
| S PHILADELPHIA BLVD | 96 |
| JFK NB | 70 |
| BEL AIR AVE | 66 |
| JFK SB | 56 |
| W BEL AIR AVE | 54 |
| BEARDS HILL RD | 48 |
| PARADISE RD | 38 |
| PHILADELPHIA BLVD | 36 |
| CARSINS RUN RD | 34 |
| HICKORY DR | 34 |
| I-95 | 34 |
| EDMUND ST | 30 |
| OLD PHILADELPHIA RD | 30 |
| E BEL AIR AVE | 28 |
| N STEPNEY RD | 26 |
| PLAZA CT | 26 |
| INTERSTATE 95 | 24 |
| STEPNEY RD | 24 |
| PHILADELPHIA BLVD | 22 |
| PHILIADELPHIA BLVD | 22 |
| STEVENS CIR | 22 |
| CENTER DEEN AVE | 20 |
| EDMUND ST | 20 |
| GILBERT RD | 20 |
| MAYBERRY DR | 20 |
| CHURCHVILLE RD | 18 |
| CUSTIS ST | 18 |
| HANOVER ST | 18 |
| PERRYMAN RD | 18 |
| Other | 845 |
2002 - 2018 National Fire Incident Reporting System (NFIRS) incidents
- Incident types reported to NFIRS in Aberdeen, MD
- 16,12766.3%Rescue & EMS
- 2,75811.3%Good Intent Call
- 2,0568.5%Hazardous Condition
- 1,9197.9%Fire
- 1,0574.3%False Alarm
- 3781.6%Service Call
- Fire incident types reported to NFIRS in Aberdeen, MD
- 91847.8%Structure Fires
- 64833.8%Outside Fires
- 28915.1%Mobile Property/Vehicle Fires
- 643.3%Other
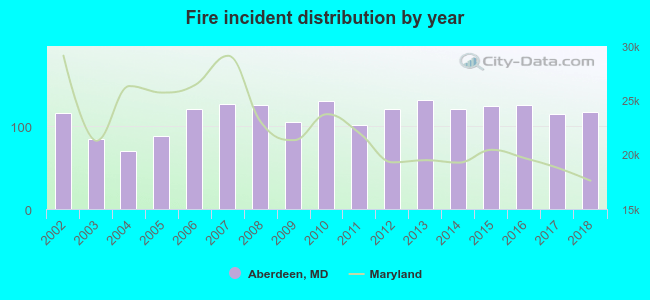 Based on the data from the years 2002 - 2018 the average number of fire incidents per year is 113. The highest number of fires - 131 took place in 2013, and the least - 70 in 2004. The data has an increasing trend.
The average number of yearly fire incidents per 10k residents in Aberdeen, MD compared to nearest cities:
(Note: Based on data for the last 3 years, including only cities with population 5,000 and above)
| Aberdeen: | 77.1 |
| Havre de Grace: | 40.0 |
| Edgewood: | 55.4 |
| Bel Air: | 159.8 |
| Fallston: | 44.7 |
| White Marsh: | 31.9 |
| Perry Hall: | 2.6 |
| Middle River: | 43.3 |
| Elkton: | 115.7 |
 The median response time based on all reported fire incidents is 7 minutes. This is about the same as the state median value.
The median response time in Aberdeen, MD compared to nearest cities:
(Note: Based on data for all years, including only cities with at least 500 fire incidents)
| Aberdeen: | 7 minutes |
| Havre de Grace: | 1 minutes |
| Perryville: | 9 minutes |
| Port Deposit: | 11 minutes |
| Darlington: | 10 minutes |
| Edgewood: | 6 minutes |
| Bel Air: | 7 minutes |
| North East: | 10 minutes |
| Rising Sun: | 9 minutes |
 According to the data from the years 2002 - 2018 the average number of fire-related yearly casualties is 1. The highest number of reported casualties - 3 took place in 2005, and the lowest - 0 in 2002. The data has an increasing trend.
The average number of injuries per 1,000 fire incidents is 9. This indicator was the highest - 34 in 2005, and the lowest 0 in 2002. The trend for injuries per 1,000 fires is growing. Compared to the state value the number of injuries per 1,000 incidents is about the same.
According to the data from the years 2002 - 2018 the average number of fire-related yearly casualties is 1. The highest number of reported casualties - 3 took place in 2005, and the lowest - 0 in 2002. The data has an increasing trend.
The average number of injuries per 1,000 fire incidents is 9. This indicator was the highest - 34 in 2005, and the lowest 0 in 2002. The trend for injuries per 1,000 fires is growing. Compared to the state value the number of injuries per 1,000 incidents is about the same.Casualties per 1,000 incidents in Aberdeen, MD compared to nearest cities:
(Note: Based on data for all years, including only cities with at least 500 fire incidents)
| Aberdeen: | 8.3 |
| Havre de Grace: | 1.5 |
| Perryville: | 14.7 |
| Port Deposit: | 1.5 |
| Darlington: | 0.0 |
| Edgewood: | 5.8 |
| Bel Air: | 8.4 |
| North East: | 2.3 |
| Rising Sun: | 16.6 |
 34.3% incidents where reported in the morning and 65.7% in the evening. The most fires (15.8%) took place on Saturday, and the least (12.7%) on Thursday.
 Based on the 1,919 fires from years 2002 - 2018 most fires (11.5%) took place during March, and the least (6.4%) in September.
 Out of all 24,322 cases reported during the years 2002 - 2018, the most belonged to the categories: Rescue & EMS (66.3%), Good Intent Call (11.3%), and Hazardous Condition (8.5%).
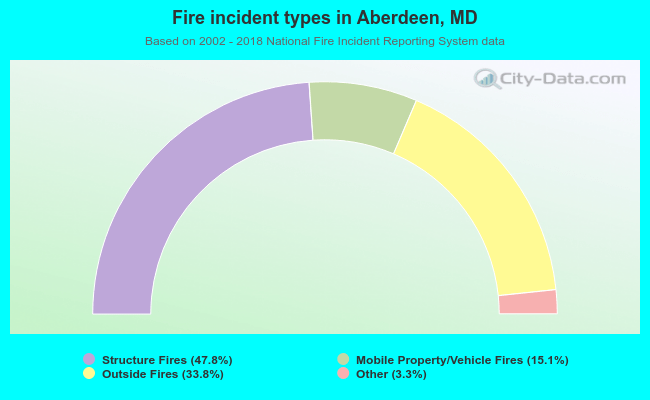 When looking into fire subcategories, the most reports belonged to: Structure Fires (47.8%), and Outside Fires (33.8%).