White Marsh: Fire Incidents, Maryland (MD)
Where are fire incidents reported in White Marsh, MD
Something went wrong! Please refresh the page.
|
| |||||||||||||||||||||||||||||||||||||||||||||||||||||||||||||||||||||||||||||||||||||||||||||||||||||||||||||
2004 - 2018 National Fire Incident Reporting System (NFIRS) incidents
- Incident types reported to NFIRS in White Marsh, MD
- 3,24466.5%Rescue & EMS
- 52710.8%Hazardous Condition
- 4419.0%Fire
- 3477.1%Good Intent Call
- 1773.6%False Alarm
- 1272.6%Service Call
- 70.1%Overpressure Rupture
- Fire incident types reported to NFIRS in White Marsh, MD
- 22851.7%Outside Fires
- 13229.9%Mobile Property/Vehicle Fires
- 5412.2%Structure Fires
- 276.1%Other
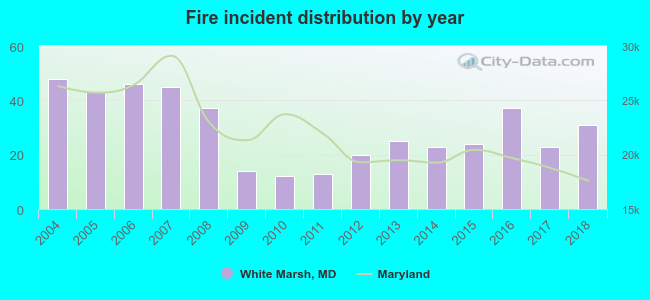 Based on the data from the years 2004 - 2018 the average number of fires per year is 29. The highest number of reported fire incidents - 48 took place in 2004, and the least - 12 in 2010. The data has a dropping trend.
The average number of yearly fire incidents per 10k residents in White Marsh, MD compared to nearest cities:
(Note: Based on data for the last 3 years, including only cities with population 5,000 and above)
| White Marsh: | 31.9 |
| Perry Hall: | 2.6 |
| Middle River: | 43.3 |
| Rosedale: | 19.7 |
| Parkville: | 23.6 |
| Essex: | 24.5 |
| Towson: | 13.6 |
| Dundalk: | 13.6 |
| Edgewood: | 55.4 |

 28.8% incidents where reported in the morning and 71.2% in the evening. The most fires (17.0%) took place on Thursday, and the least (10.4%) on Tuesday.
 According to the 441 fire incident reports from years 2004 - 2018 most fires (13.4%) took place during April, and the least (3.4%) in December.
 Out of all 4,875 cases reported during the years 2004 - 2018, the most belonged to the categories: Rescue & EMS (66.5%), Hazardous Condition (10.8%), and Fire (9.0%).
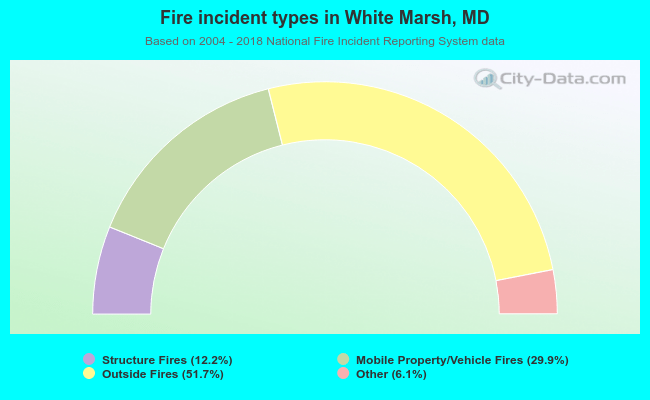 When looking into fire subcategories, the most incidents belonged to: Outside Fires (51.7%), and Mobile Property/Vehicle Fires (29.9%).