Easton: Fire Incidents, Pennsylvania (PA)
Where are fire incidents reported in Easton, PA
Something went wrong! Please refresh the page.
| Fire incidents reported | |
|---|---|
| Sreet name | Count |
| SULLIVAN RD | 284 |
| BR THOMAS BRIGHT AVE | 220 |
| NORTHAMPTON ST | 212 |
| FERRY ST | 144 |
| 3RD ST | 98 |
| HIGH ST | 82 |
| MC CARTNEY ST | 82 |
| WASHINGTON ST | 82 |
| 4TH ST | 76 |
| BR. THOMAS BRIGHT AVE | 70 |
| BUTLER ST | 70 |
| BERWICK ST | 68 |
| SOUTH COLLEGE DR | 66 |
| 7TH ST | 56 |
| WILKES BARRE ST | 56 |
| 5TH ST | 50 |
| LEHIGH ST | 48 |
| 2ND ST | 42 |
| COLLEGE DR | 42 |
| WALNUT AVE | 40 |
| MARCH ST | 38 |
| 10TH ST | 36 |
| EASTONNAZARETH HWY | 36 |
| PINE ST | 36 |
| CATTELL ST | 34 |
| 13TH ST | 32 |
| BUSHKILL ST | 30 |
| LOCUST ST | 30 |
| LINCOLN ST | 28 |
| SPRING GARDEN ST | 28 |
2005 - 2018 National Fire Incident Reporting System (NFIRS) incidents
- Incident types reported to NFIRS in Easton, PA
- 2,50528.3%Rescue & EMS
- 1,82320.6%Hazardous Condition
- 1,79820.3%Fire
- 1,36415.4%False Alarm
- 6767.6%Good Intent Call
- 6347.2%Service Call
- 360.4%Special Incident
- 120.1%Severe Weather
- Fire incident types reported to NFIRS in Easton, PA
- 1,37676.5%Structure Fires
- 26314.6%Outside Fires
- 1156.4%Mobile Property/Vehicle Fires
- 442.4%Other
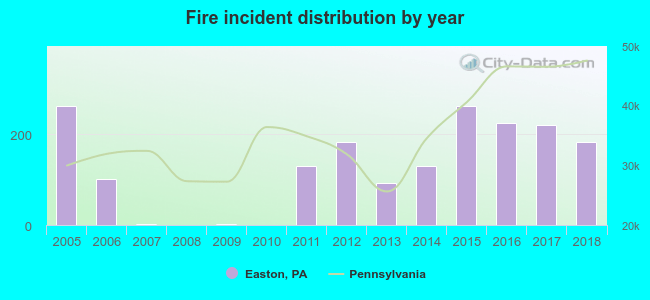 According to the data from the years 2005 - 2018 the average number of fire incidents per year is 128. The highest number of reported fires - 263 took place in 2005, and the least - 0 in 2008. The data has a decreasing trend.
The average number of yearly fire incidents per 10k residents in Easton, PA compared to nearest cities:
(Note: Based on data for the last 3 years, including only cities with population 5,000 and above)
| Easton: | 77.1 |
| Wilson: | 3.2 |
| Nazareth: | 52.5 |
| Bethlehem: | 29.6 |
| Hellertown: | 22.2 |
| Bangor: | 32.5 |
| Catasauqua: | 59.4 |
| Northampton: | 71.3 |
| Allentown: | 11.6 |
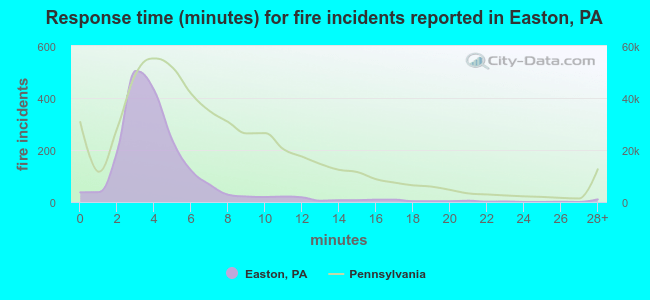 The median response time based on all reported fire incidents is 4 minutes. This is lower compared to the Pennsylvania median value.
The median response time in Easton, PA compared to nearest cities:
(Note: Based on data for all years, including only cities with at least 500 fire incidents)
| Easton: | 4 minutes |
| Phillipsburg: | 5 minutes |
| Bethlehem: | 5 minutes |
| Asbury: | 7 minutes |
| Washington: | 9 minutes |
| Northampton: | 11 minutes |
| Glen Gardner: | 9 minutes |
| Allentown: | 6 minutes |
| Clinton: | 8 minutes |
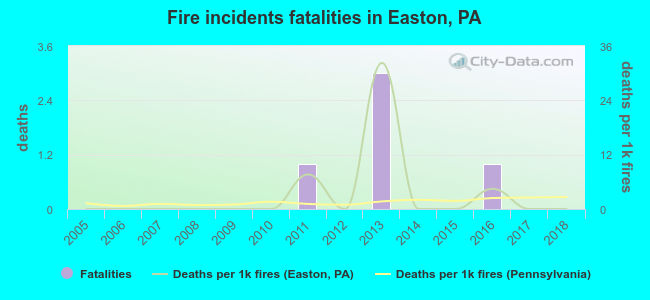 According to the data from the years 2005 - 2018 the average number of fire-related fatalities per year is 0. The highest number of reported deaths - 3 took place in 2013, and the lowest - 0 in 2005. The data has a constant trend.
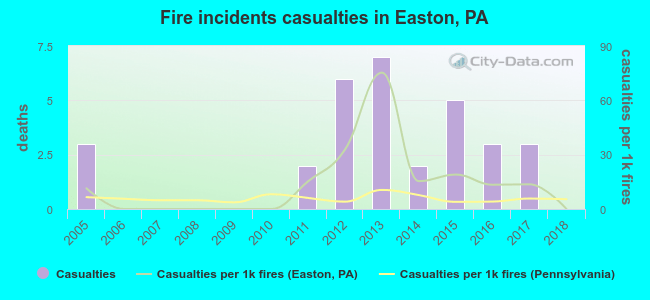 Based on the data from the years 2005 - 2018 the average number of fire-related yearly casualties is 2. The highest number of injuries - 7 took place in 2013, and the lowest - 0 in 2006. The data has a dropping trend.
The average number of injuries per 1,000 fires is 14. This indicator was the highest - 75 in 2013, and the lowest 0 in 2006. The trend for casualties per 1,000 fires is dropping. Compared to the state value the number of casualties per 1,000 fires is much higher.
Based on the data from the years 2005 - 2018 the average number of fire-related yearly casualties is 2. The highest number of injuries - 7 took place in 2013, and the lowest - 0 in 2006. The data has a dropping trend.
The average number of injuries per 1,000 fires is 14. This indicator was the highest - 75 in 2013, and the lowest 0 in 2006. The trend for casualties per 1,000 fires is dropping. Compared to the state value the number of casualties per 1,000 fires is much higher.Casualties per 1,000 incidents in Easton, PA compared to nearest cities:
(Note: Based on data for all years, including only cities with at least 500 fire incidents)
| Easton: | 17.2 |
| Phillipsburg: | 32.3 |
| Bethlehem: | 16.4 |
| Asbury: | 0.0 |
| Washington: | 8.0 |
| Northampton: | 3.3 |
| Glen Gardner: | 1.7 |
| Allentown: | 0.4 |
| Clinton: | 1.4 |
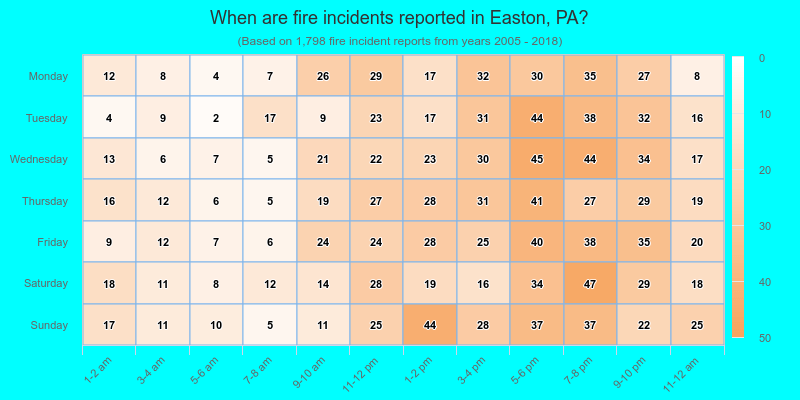
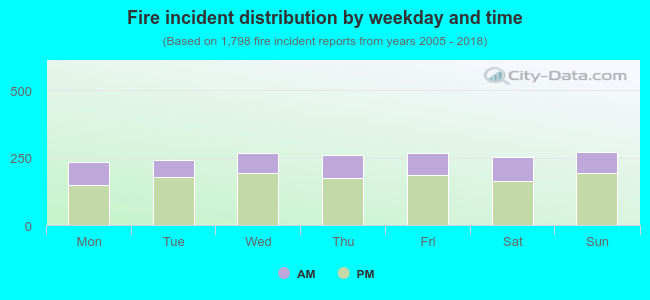 31.2% incidents where reported in the morning and 68.8% in the evening. The most fires (15.1%) took place on Sunday, and the least (13.1%) on Monday.
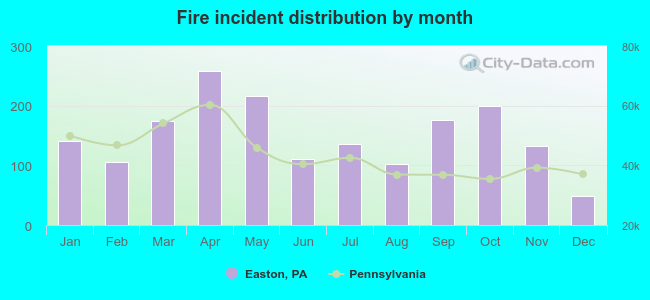 According to the 1,798 incident reports from years 2005 - 2018 most fires (14.3%) took place during April, and the least (2.7%) in December.
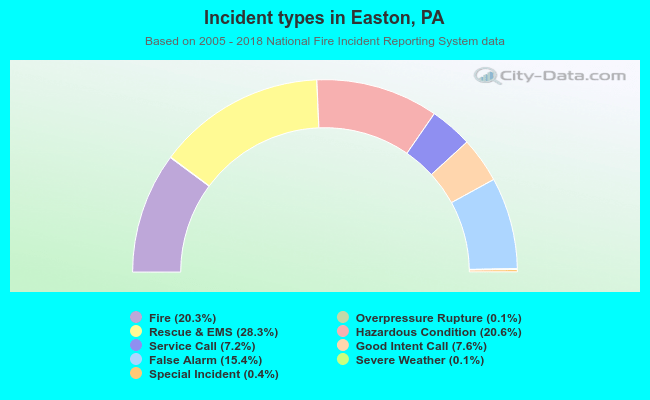 Out of all 8,854 cases reported during the years 2005 - 2018, the most belonged to the categories: Rescue & EMS (28.3%), Hazardous Condition (20.6%), and Fire (20.3%).
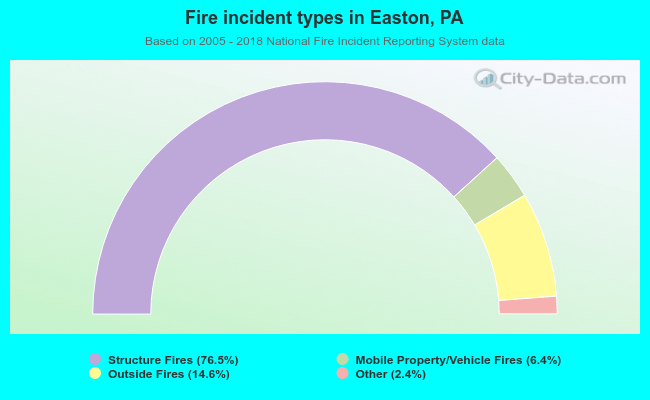 When looking into fire subcategories, the most incidents belonged to: Structure Fires (76.5%), and Outside Fires (14.6%).