Phillipsburg: Fire Incidents, New Jersey (NJ)
Where are fire incidents reported in Phillipsburg, NJ
Something went wrong! Please refresh the page.
| Fire incidents reported | |
|---|---|
| Sreet name | Count |
| MAIN ST | 200 |
| ROUTE 78 | 78 |
| HOWARD ST | 64 |
| MERCER ST | 56 |
| RT 22 EAST | 56 |
| HECKMAN ST | 54 |
| ROSEBERRY ST | 50 |
| CHAMBERS ST | 42 |
| STOCKTON ST | 42 |
| SITGREAVES ST | 40 |
| CENTER ST | 34 |
| LEWIS ST | 34 |
| MEMORIAL PKY | 34 |
| SAYRE AVE | 32 |
| WARREN ST | 32 |
| MARSHALL ST | 30 |
| MORRIS ST | 30 |
| NEW BRUNSWICK AVE | 30 |
| INTERSTATE 78 HWY | 28 |
| RIVER RD | 28 |
| DELAWARE RIVER PARK | 26 |
| HUDSON ST | 26 |
| RT 22 E HWY | 26 |
| HILLCREST BLVD | 24 |
| WASHINGTON ST | 24 |
| ANDERSON ST | 22 |
| BENNETT ST | 22 |
| BRAINARD ST | 22 |
| LINCOLN ST | 22 |
| RT22 | 22 |
| Other | 9 |
2002 - 2018 National Fire Incident Reporting System (NFIRS) incidents
- Incident types reported to NFIRS in Phillipsburg, NJ
- 1,73234.4%Hazardous Condition
- 1,23924.6%Fire
- 64412.8%Rescue & EMS
- 59311.8%False Alarm
- 4759.4%Good Intent Call
- 3176.3%Service Call
- 230.5%Special Incident
- 120.2%Severe Weather
- 60.1%Overpressure Rupture
- Fire incident types reported to NFIRS in Phillipsburg, NJ
- 57546.4%Structure Fires
- 46137.2%Outside Fires
- 19115.4%Mobile Property/Vehicle Fires
- 121.0%Other
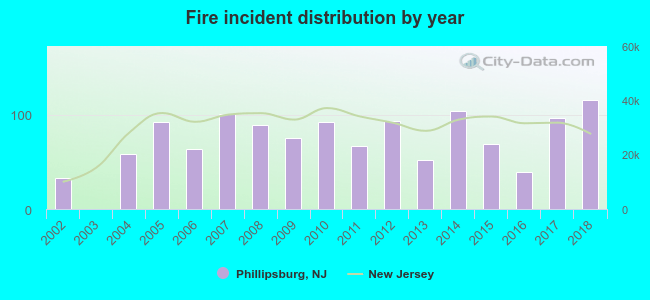 Based on the data from the years 2002 - 2018 the average number of fire incidents per year is 73. The highest number of fire incidents - 115 took place in 2018, and the least - 0 in 2003. The data has a rising trend.
The average number of yearly fire incidents per 10k residents in Phillipsburg, NJ compared to nearest cities:
(Note: Based on data for the last 3 years, including only cities with population 5,000 and above)
| Phillipsburg: | 57.2 |
| Washington: | 100.5 |
 The median response time based on all reported fire incidents is 5 minutes. This is close to the state median value.
The median response time in Phillipsburg, NJ compared to nearest cities:
(Note: Based on data for all years, including only cities with at least 500 fire incidents)
| Phillipsburg: | 5 minutes |
| Asbury: | 7 minutes |
| Washington: | 9 minutes |
| Glen Gardner: | 9 minutes |
| Clinton: | 8 minutes |
 Based on the reports from the years 2002 - 2018 the average number of fire-related yearly casualties is 2. The highest number of reported injuries - 12 took place in 2006, and the lowest - 0 in 2003. The data has a rising trend.
The average number of casualties per 1,000 fire incidents is 31. This indicator was the highest - 188 in 2006, and the lowest 0 in 2003. The trend for injuries per 1,000 incidents is decreasing. Compared to the state value the number of injuries per 1,000 fires is much higher.
Based on the reports from the years 2002 - 2018 the average number of fire-related yearly casualties is 2. The highest number of reported injuries - 12 took place in 2006, and the lowest - 0 in 2003. The data has a rising trend.
The average number of casualties per 1,000 fire incidents is 31. This indicator was the highest - 188 in 2006, and the lowest 0 in 2003. The trend for injuries per 1,000 incidents is decreasing. Compared to the state value the number of injuries per 1,000 fires is much higher.Casualties per 1,000 incidents in Phillipsburg, NJ compared to nearest cities:
(Note: Based on data for all years, including only cities with at least 500 fire incidents)
| Phillipsburg: | 32.3 |
| Asbury: | 0.0 |
| Washington: | 8.0 |
| Glen Gardner: | 1.7 |
| Clinton: | 1.4 |
 29.3% incidents where reported in the morning and 70.7% in the evening. The most fires (16.3%) took place on Saturday, and the least (13.2%) on Sunday.
 Based on the 1,239 incident reports from years 2002 - 2018 most fires (13.2%) took place during April, and the least (6.0%) in September.
 Out of all 5,041 cases reported during the years 2002 - 2018, the most belonged to the categories: Hazardous Condition (34.4%), Fire (24.6%), and Rescue & EMS (12.8%).
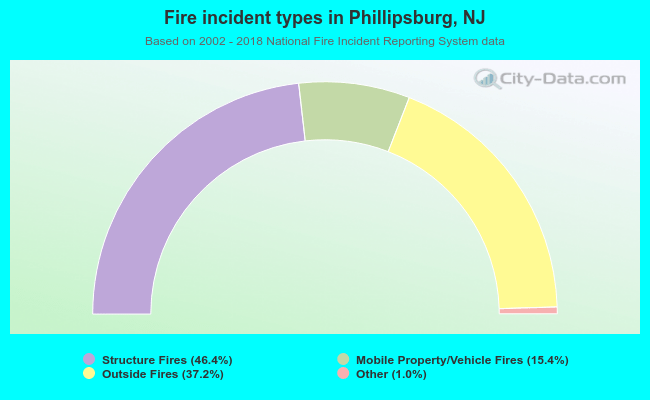 When looking into fire subcategories, the most reports belonged to: Structure Fires (46.4%), and Outside Fires (37.2%).