Allentown: Fire Incidents, Pennsylvania (PA)
Where are fire incidents reported in Allentown, PA
Something went wrong! Please refresh the page.
| Fire incidents reported | |
|---|---|
| Sreet name | Count |
| TILGHMAN ST | 154 |
| HAMILTON ST | 126 |
| UNION ST | 98 |
| 6TH ST | 94 |
| ALLEN ST | 92 |
| WALNUT ST | 92 |
| CEDAR CREST BLVD | 80 |
| 4TH ST | 78 |
| SCHANTZ RD | 70 |
| SNOWDRIFT RD | 66 |
| 5TH ST | 58 |
| 7TH ST | 54 |
| CHEW ST | 54 |
| BROADWAY | 50 |
| 10TH ST | 48 |
| LIBERTY ST | 48 |
| HAMILTON BLVD | 46 |
| RUPPSVILLE RD | 46 |
| SUSQUEHANNA ST | 46 |
| 8TH ST | 44 |
| LINDEN ST | 44 |
| TURNER ST | 44 |
| CETRONIA RD | 38 |
| 11TH ST | 36 |
| AIRPORT RD | 34 |
| GORDON ST | 34 |
| LEHIGH ST | 34 |
| 13TH ST | 32 |
| HANOVER AVE | 32 |
| 78 INT | 30 |
| Other | 643 |
2006 - 2018 National Fire Incident Reporting System (NFIRS) incidents
- Incident types reported to NFIRS in Allentown, PA
- 2,97726.6%Hazardous Condition
- 2,44521.9%Fire
- 1,93917.4%Good Intent Call
- 1,72915.5%False Alarm
- 1,26411.3%Rescue & EMS
- 7226.5%Service Call
- 520.5%Special Incident
- 330.3%Overpressure Rupture
- Fire incident types reported to NFIRS in Allentown, PA
- 1,25551.3%Structure Fires
- 50720.7%Outside Fires
- 39716.2%Mobile Property/Vehicle Fires
- 28611.7%Other
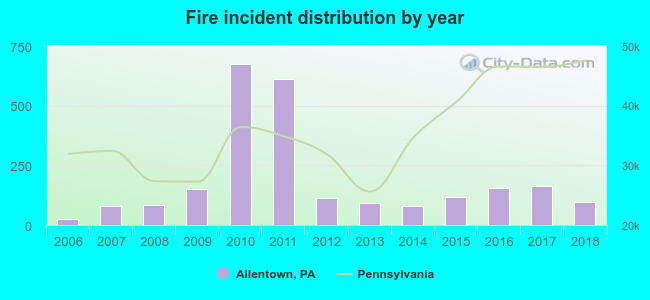 According to the data from the years 2006 - 2018 the average number of fires per year is 188. The highest number of reported fire incidents - 676 took place in 2010, and the least - 27 in 2006. The data has a growing trend.
The average number of yearly fire incidents per 10k residents in Allentown, PA compared to nearest cities:
(Note: Based on data for the last 3 years, including only cities with population 5,000 and above)
| Allentown: | 11.6 |
| Catasauqua: | 59.4 |
| Emmaus: | 31.8 |
| Wescosville: | 18.2 |
| Bethlehem: | 29.6 |
| Northampton: | 71.3 |
| Hellertown: | 22.2 |
| Nazareth: | 52.5 |
| Quakertown: | 61.6 |
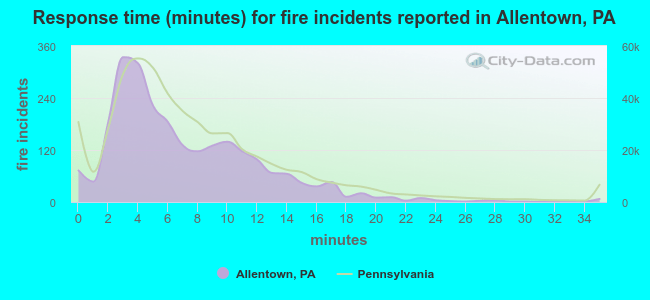 The median response time based on all reported fire incidents is 6 minutes. This is about the same as the Pennsylvania median value.
The median response time in Allentown, PA compared to nearest cities:
(Note: Based on data for all years, including only cities with at least 500 fire incidents)
| Allentown: | 6 minutes |
| Bethlehem: | 5 minutes |
| Northampton: | 11 minutes |
| Quakertown: | 7 minutes |
| Easton: | 4 minutes |
| Phillipsburg: | 5 minutes |
| Kutztown: | 10 minutes |
| Perkasie: | 6 minutes |
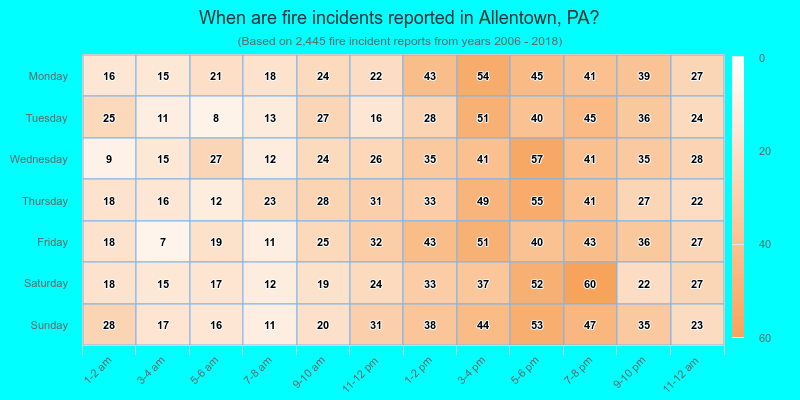
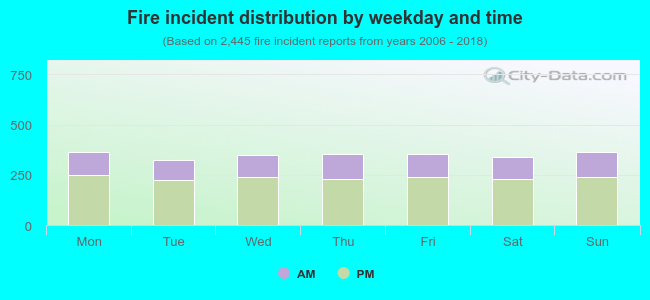 32.6% incidents where reported in the morning and 67.4% in the evening. The most fires (14.9%) took place on Monday, and the least (13.3%) on Tuesday.
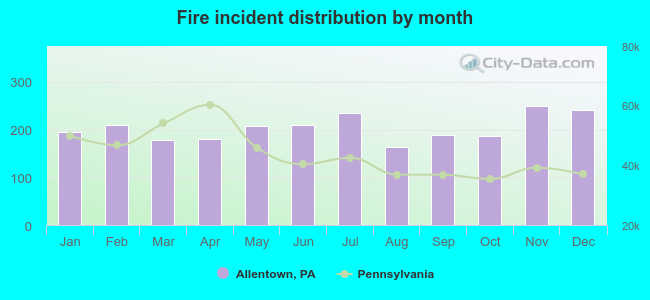 Based on the 2,445 fires from years 2006 - 2018 most fires (10.2%) took place during November, and the least (6.7%) in August.
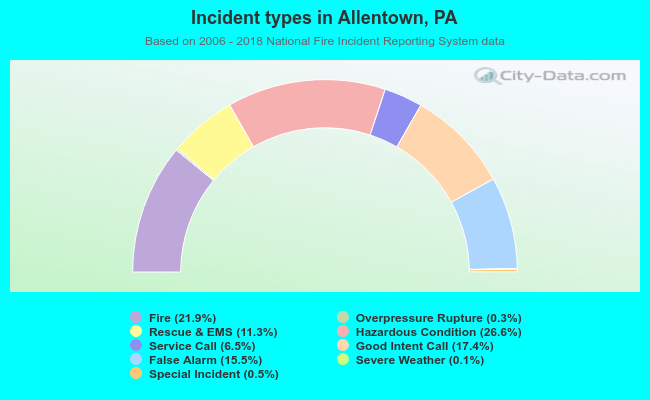 Out of all 11,171 cases reported during the years 2006 - 2018, the most belonged to the categories: Hazardous Condition (26.6%), Fire (21.9%), and Good Intent Call (17.4%).
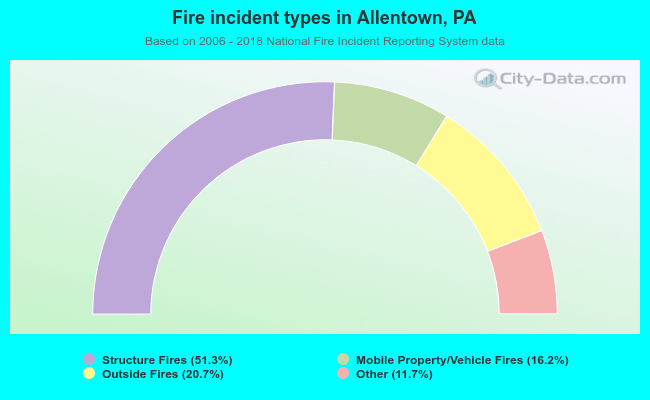 When looking into fire subcategories, the most reports belonged to: Structure Fires (51.3%), and Outside Fires (20.7%).