Diamond Springs: Fire Incidents, California (CA)
Where are fire incidents reported in Diamond Springs, CA
Something went wrong! Please refresh the page.
|
| |||||||||||||||||||||||||||||||||||||||||||||||||||||||||||||||||||||||||||||||||||||||||||||||||||||||||||||
2005 - 2018 National Fire Incident Reporting System (NFIRS) incidents
- Incident types reported to NFIRS in Diamond Springs, CA
- 1,30764.3%Rescue & EMS
- 32215.8%Good Intent Call
- 1889.2%Service Call
- 1366.7%Fire
- 602.9%False Alarm
- 201.0%Hazardous Condition
- Fire incident types reported to NFIRS in Diamond Springs, CA
- 6447.1%Outside Fires
- 5339.0%Structure Fires
- 1410.3%Mobile Property/Vehicle Fires
- 53.7%Other
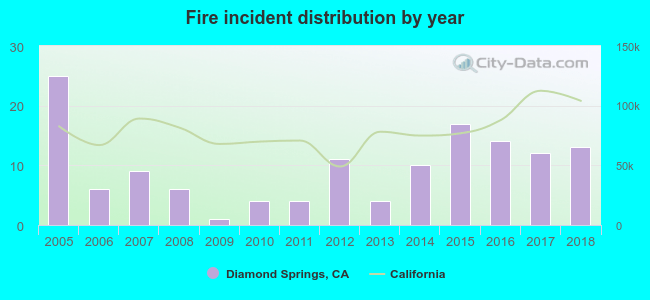 According to the data from the years 2005 - 2018 the average number of fire incidents per year is 10. The highest number of fire incidents - 25 took place in 2005, and the least - 1 in 2009. The data has a decreasing trend.
The average number of yearly fire incidents per 10k residents in Diamond Springs, CA compared to nearest cities:
(Note: Based on data for the last 3 years, including only cities with population 5,000 and above)
| Diamond Springs: | 11.8 |
| Placerville: | 119.4 |
| Cameron Park: | 17.6 |
| El Dorado Hills: | 24.3 |
| Pollock Pines: | 48.0 |
| Folsom: | 7.3 |
| Rancho Murieta: | 34.6 |
| Granite Bay: | 28.4 |
| Auburn: | 84.0 |

 20.6% incidents where reported in the morning and 79.4% in the evening. The most fires (22.8%) took place on Thursday, and the least (9.6%) on Sunday.
 Based on the 136 incident reports from years 2005 - 2018 most fires (19.1%) took place during August, and the least (1.5%) in October.
 Out of all 2,034 cases reported during the years 2005 - 2018, the most belonged to the categories: Overpressure Rupture (64.3%), Service Call (15.8%), and Hazardous Condition (9.2%).
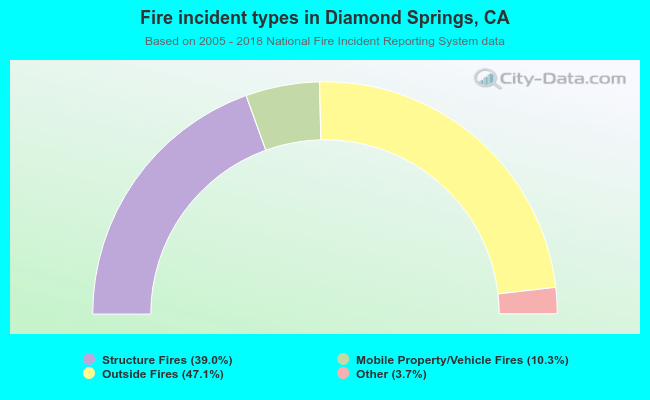 When looking into fire subcategories, the most reports belonged to: Outside Fires (47.1%), and Structure Fires (39.0%).