Columbia: Fire Incidents, Illinois (IL)
Where are fire incidents reported in Columbia, IL
Something went wrong! Please refresh the page.
|
| |||||||||||||||||||||||||||||||||||||||||||||||||||||||||||||||||||||||||||||||||||||||||||||||||||||||||||||
2002 - 2018 National Fire Incident Reporting System (NFIRS) incidents
- Incident types reported to NFIRS in Columbia, IL
- 97233.9%Fire
- 66623.2%Hazardous Condition
- 43515.2%Rescue & EMS
- 38713.5%False Alarm
- 2468.6%Good Intent Call
- 1053.7%Service Call
- 351.2%Special Incident
- 220.8%Severe Weather
- Fire incident types reported to NFIRS in Columbia, IL
- 40942.1%Structure Fires
- 38339.4%Outside Fires
- 13013.4%Mobile Property/Vehicle Fires
- 505.1%Other
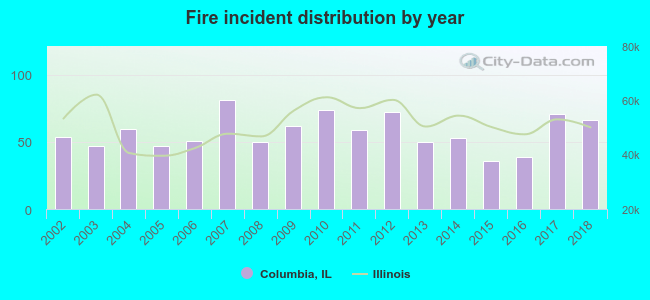 According to the data from the years 2002 - 2018 the average number of fire incidents per year is 57. The highest number of fires - 81 took place in 2007, and the least - 36 in 2015. The data has an increasing trend.
The average number of yearly fire incidents per 10k residents in Columbia, IL compared to nearest cities:
(Note: Based on data for the last 3 years, including only cities with population 5,000 and above)
| Columbia: | 58.0 |
| Cahokia: | 146.7 |
| Waterloo: | 47.2 |
| Centreville: | 233.1 |
| Belleville: | 74.5 |
| Swansea: | 29.8 |
| Fairview Heights: | 48.7 |
| Shiloh: | 5.4 |
 The median response time based on all reported fire incidents is 8 minutes. This is higher than the state median value.
The median response time in Columbia, IL compared to nearest cities:
(Note: Based on data for all years, including only cities with at least 500 fire incidents)
| Columbia: | 8 minutes |
| Dupo: | 5 minutes |
| Cahokia: | 7 minutes |
| Waterloo: | 8 minutes |
| Alorton: | 5 minutes |
| Centreville: | 7 minutes |
| East St. Louis: | 6 minutes |
| Belleville: | 4 minutes |
| Swansea: | 5 minutes |
 31.7% incidents where reported in the morning and 68.3% in the evening. The most fires (16.4%) took place on Saturday, and the least (12.8%) on Friday.
 Based on the 972 fires from years 2002 - 2018 most fires (11.0%) took place during March, and the least (6.0%) in May.
 Out of all 2,870 cases reported during the years 2002 - 2018, the most belonged to the categories: Fire (33.9%), Hazardous Condition (23.2%), and Rescue & EMS (15.2%).
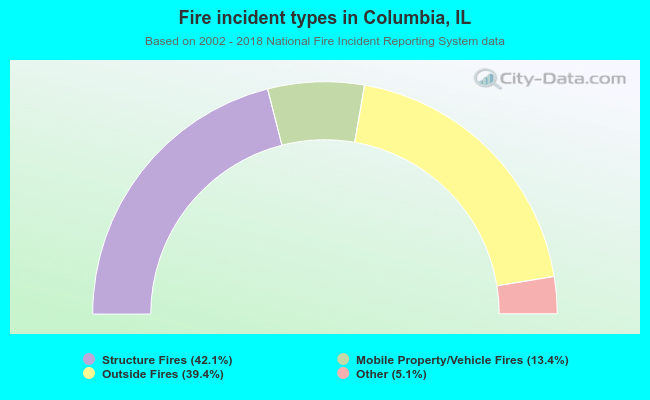 When looking into fire subcategories, the most reports belonged to: Structure Fires (42.1%), and Outside Fires (39.4%).