Cahokia: Fire Incidents, Illinois (IL)
Where are fire incidents reported in Cahokia, IL
Something went wrong! Please refresh the page.
| Fire incidents reported | |
|---|---|
| Sreet name | Count |
| CAMP JACKSON RD | 340 |
| DORIS AVE | 160 |
| MISSISSIPPI AVE | 116 |
| WATER ST | 112 |
| MILDRED AVE | 110 |
| JEROME LA | 92 |
| ADAMS DR | 82 |
| FALLING SPRINGS RD | 82 |
| AMELIA DR | 78 |
| COOPER DR | 70 |
| SANDY RIDGE RD | 68 |
| 5TH ST | 66 |
| RICHARD DR | 62 |
| CALVIN BLVD | 60 |
| RENOIS LN | 60 |
| ARTHUR ST | 50 |
| LAURALEE DR | 50 |
| LORRAINE DR | 50 |
| LEVIN DR | 48 |
| WILLIAMS ST | 48 |
| PARKLANE DR | 46 |
| WEST ADAMS DR | 46 |
| INTERSTATE 255 | 44 |
| LAURA LEE DR | 42 |
| RANGE LA | 42 |
| LOUISE LN | 40 |
| BOND AVE | 38 |
| HELEN CT | 38 |
| WESTWOOD DR | 38 |
| ST. DOROTHY DR | 36 |
| Other | 987 |
2002 - 2018 National Fire Incident Reporting System (NFIRS) incidents
- Incident types reported to NFIRS in Cahokia, IL
- 3,20153.3%Fire
- 1,34022.3%Hazardous Condition
- 5148.6%False Alarm
- 3425.7%Rescue & EMS
- 2974.9%Service Call
- 2684.5%Good Intent Call
- 280.5%Overpressure Rupture
- 190.3%Severe Weather
- Fire incident types reported to NFIRS in Cahokia, IL
- 1,98061.9%Structure Fires
- 80025.0%Outside Fires
- 36111.3%Mobile Property/Vehicle Fires
- 601.9%Other
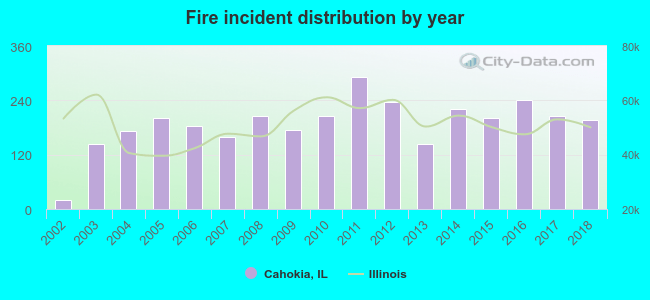 Based on the data from the years 2002 - 2018 the average number of fire incidents per year is 188. The highest number of fire incidents - 291 took place in 2011, and the least - 20 in 2002. The data has an increasing trend.
The average number of yearly fire incidents per 10k residents in Cahokia, IL compared to nearest cities:
(Note: Based on data for the last 3 years, including only cities with population 5,000 and above)
| Cahokia: | 146.7 |
| Centreville: | 233.1 |
| Columbia: | 58.0 |
| Fairview Heights: | 48.7 |
| Belleville: | 74.5 |
| Swansea: | 29.8 |
| Granite City: | 49.8 |
| Collinsville: | 53.9 |
| Pontoon Beach: | 67.6 |
 The median response time based on all reported fire incidents is 7 minutes. This is higher than the state median value.
The median response time in Cahokia, IL compared to nearest cities:
(Note: Based on data for all years, including only cities with at least 500 fire incidents)
| Cahokia: | 7 minutes |
| Alorton: | 5 minutes |
| Dupo: | 5 minutes |
| Centreville: | 7 minutes |
| East St. Louis: | 6 minutes |
| Washington Park: | 5 minutes |
| Columbia: | 8 minutes |
| Madison: | 6 minutes |
| Caseyville: | 6 minutes |
 Based on the reports from the years 2002 - 2018 the average number of fire-related yearly deaths is 1. The highest number of reported deaths - 4 took place in 2007, and the lowest - 0 in 2002. The data has an increasing trend.
The average number of fatalities per 1,000 fire incidents is 3. This indicator was the highest - 25 in 2007, and the lowest 0 in 2002. The trend for deaths per 1,000 fires is rising. Compared to the state value the number of fatalities per 1,000 fire incidents is higher.
Based on the reports from the years 2002 - 2018 the average number of fire-related yearly deaths is 1. The highest number of reported deaths - 4 took place in 2007, and the lowest - 0 in 2002. The data has an increasing trend.
The average number of fatalities per 1,000 fire incidents is 3. This indicator was the highest - 25 in 2007, and the lowest 0 in 2002. The trend for deaths per 1,000 fires is rising. Compared to the state value the number of fatalities per 1,000 fire incidents is higher.Deaths per 1,000 incidents in Cahokia, IL compared to nearest cities:
(Note: Based on data for all years, including only cities with at least 2,500 fire incidents)
| Cahokia: | 3.1 |
| Belleville: | 2.0 |
| Granite City: | 2.0 |
 Based on the reports from the years 2002 - 2018 the average number of fire-related casualties per year is 2. The highest number of casualties - 5 took place in 2011, and the lowest - 0 in 2002. The data has a rising trend.
The average number of injuries per 1,000 fire incidents is 9. This indicator was the highest - 17 in 2011, and the lowest 0 in 2002. The trend for injuries per 1,000 incidents is growing. Compared to the Illinois value the number of injuries per 1,000 fire incidents is about the same.
Based on the reports from the years 2002 - 2018 the average number of fire-related casualties per year is 2. The highest number of casualties - 5 took place in 2011, and the lowest - 0 in 2002. The data has a rising trend.
The average number of injuries per 1,000 fire incidents is 9. This indicator was the highest - 17 in 2011, and the lowest 0 in 2002. The trend for injuries per 1,000 incidents is growing. Compared to the Illinois value the number of injuries per 1,000 fire incidents is about the same.Casualties per 1,000 incidents in Cahokia, IL compared to nearest cities:
(Note: Based on data for all years, including only cities with at least 500 fire incidents)
| Cahokia: | 9.4 |
| Alorton: | 0.0 |
| Dupo: | 6.0 |
| Centreville: | 0.0 |
| East St. Louis: | 2.3 |
| Washington Park: | 3.0 |
| Columbia: | 0.0 |
| Madison: | 2.0 |
| Caseyville: | 1.5 |
 40.1% incidents where reported in the morning and 59.9% in the evening. The most fires (16.9%) took place on Sunday, and the least (11.8%) on Thursday.
 According to the 3,201 fire incident reports from years 2002 - 2018 most fires (10.9%) took place during July, and the least (6.6%) in June.
 Out of all 6,010 cases reported during the years 2002 - 2018, the most belonged to the categories: Fire (53.3%), Hazardous Condition (22.3%), and False Alarm (8.6%).
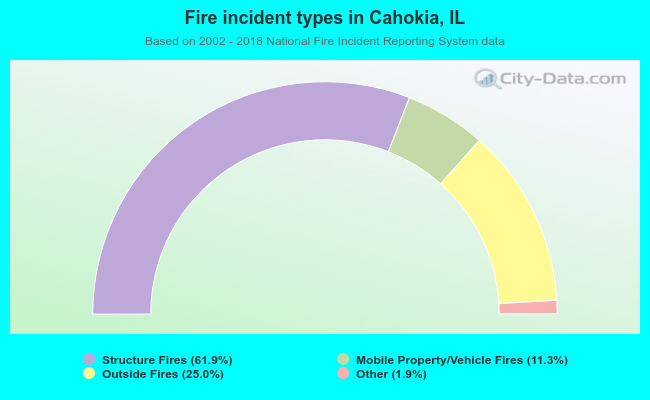 When looking into fire subcategories, the most incidents belonged to: Structure Fires (61.9%), and Outside Fires (25.0%).