Castle Rock: Fire Incidents, Colorado (CO)
Where are fire incidents reported in Castle Rock, CO
Something went wrong! Please refresh the page.
| Fire incidents reported | |
|---|---|
| Sreet name | Count |
| INTERSTATE HIGHWAY 25 | 178 |
| CASTLEGATE DR | 96 |
| WILCOX ST | 70 |
| I-25 | 50 |
| I25 SB | 48 |
| WOLFENSBERGER RD | 44 |
| FOUNDERS PKY | 42 |
| INTERSTATE 25 | 42 |
| GILBERT ST | 40 |
| LAKE GULCH RD | 40 |
| PRAIRIE HAWK DR | 40 |
| SOUTH ST | 40 |
| FRONT ST | 36 |
| MEADOWS BLVD | 36 |
| PERRY ST | 36 |
| ALLEN ST | 34 |
| SCOTT BLVD | 32 |
| RIDGE RD | 28 |
| FIFTH ST | 24 |
| PLUM CREEK PKY | 24 |
| CASTLE PINES PKY | 22 |
| STATE HIGHWAY 86 | 22 |
| TOPEKA WAY | 22 |
| EATON CIR | 20 |
| FACTORY SHOPS BLVD | 20 |
| TRAIL BOSS DR | 20 |
| BUTTERFIELD CROSSING DR | 18 |
| DANIELS PARK RD | 18 |
| ENDERUD BLVD | 18 |
| MEADOWS DR | 18 |
| Other | 430 |
2003 - 2018 National Fire Incident Reporting System (NFIRS) incidents
- Incident types reported to NFIRS in Castle Rock, CO
- 16,61447.2%Rescue & EMS
- 6,20317.6%Hazardous Condition
- 4,51812.8%Service Call
- 3,2679.3%Good Intent Call
- 2,9228.3%False Alarm
- 1,6084.6%Fire
- 480.1%Severe Weather
- Fire incident types reported to NFIRS in Castle Rock, CO
- 64940.4%Outside Fires
- 62238.7%Structure Fires
- 31219.4%Mobile Property/Vehicle Fires
- 251.6%Other
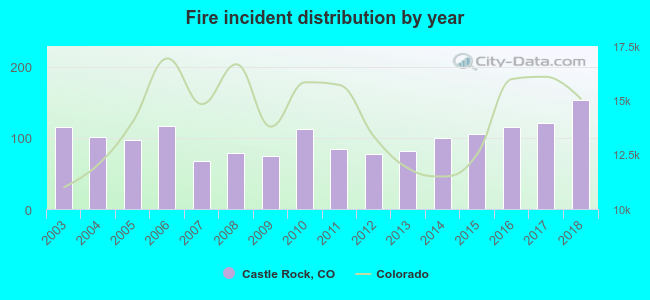 Based on the data from the years 2003 - 2018 the average number of fire incidents per year is 100. The highest number of reported fires - 153 took place in 2018, and the least - 68 in 2007. The data has an increasing trend.
The average number of yearly fire incidents per 10k residents in Castle Rock, CO compared to nearest cities:
(Note: Based on data for the last 3 years, including only cities with population 5,000 and above)
| Castle Rock: | 23.3 |
| Castle Pines: | 1.4 |
| Parker: | 25.7 |
| Lone Tree: | 25.3 |
| Highlands Ranch: | 5.0 |
| Centennial: | 6.9 |
| Greenwood Village: | 12.1 |
| Littleton: | 45.4 |
| Cherry Hills Village: | 13.5 |
 The median response time based on all reported fire incidents is 7 minutes. This is about the same as the state median value.
The median response time in Castle Rock, CO compared to nearest cities:
(Note: Based on data for all years, including only cities with at least 500 fire incidents)
| Castle Rock: | 7 minutes |
| Sedalia: | 15 minutes |
| Parker: | 7 minutes |
| Lone Tree: | 6 minutes |
| Highlands Ranch: | 7 minutes |
| Elizabeth: | 8 minutes |
| Centennial: | 6 minutes |
| Littleton: | 7 minutes |
| Englewood: | 6 minutes |
 According to the reports from the years 2003 - 2018 the average number of fire-related yearly casualties is 2. The highest number of casualties - 6 took place in 2004, and the lowest - 0 in 2003. The data has a rising trend.
The average number of injuries per 1,000 fire incidents is 22. This indicator was the highest - 59 in 2004, and the lowest 0 in 2003. The trend for injuries per 1,000 fires is increasing. Compared to the Colorado value the number of casualties per 1,000 fire incidents is higher.
According to the reports from the years 2003 - 2018 the average number of fire-related yearly casualties is 2. The highest number of casualties - 6 took place in 2004, and the lowest - 0 in 2003. The data has a rising trend.
The average number of injuries per 1,000 fire incidents is 22. This indicator was the highest - 59 in 2004, and the lowest 0 in 2003. The trend for injuries per 1,000 fires is increasing. Compared to the Colorado value the number of casualties per 1,000 fire incidents is higher.Casualties per 1,000 incidents in Castle Rock, CO compared to nearest cities:
(Note: Based on data for all years, including only cities with at least 500 fire incidents)
| Castle Rock: | 20.5 |
| Sedalia: | 0.0 |
| Parker: | 8.6 |
| Lone Tree: | 6.9 |
| Highlands Ranch: | 15.8 |
| Elizabeth: | 1.8 |
| Centennial: | 32.4 |
| Littleton: | 19.8 |
| Englewood: | 10.1 |
 28.4% incidents where reported in the morning and 71.6% in the evening. The most fires (15.8%) took place on Friday, and the least (12.7%) on Sunday.
 According to the 1,608 fire incidents from years 2003 - 2018 most fires (14.1%) took place during July, and the least (4.9%) in February.
 Out of all 35,201 cases reported during the years 2003 - 2018, the most belonged to the categories: Rescue & EMS (47.2%), Hazardous Condition (17.6%), and Service Call (12.8%).
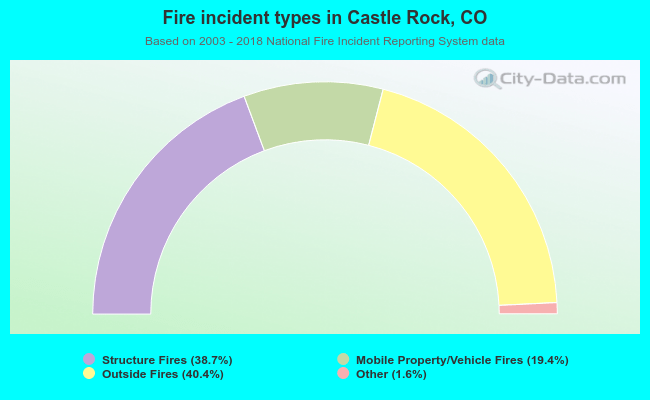 When looking into fire subcategories, the most incidents belonged to: Outside Fires (40.4%), and Structure Fires (38.7%).