Littleton: Fire Incidents, Colorado (CO)
Where are fire incidents reported in Littleton, CO
Something went wrong! Please refresh the page.
| Fire incidents reported | |
|---|---|
| Sreet name | Count |
| BOWLES AVE | 224 |
| SANTA FE DR | 130 |
| BROADWAY | 128 |
| ROXBOROUGH PARK RD | 124 |
| COAL MINE AVE | 108 |
| WADSWORTH BLVD | 108 |
| UNIVERSITY BLVD | 102 |
| BELLEVIEW AVE | 100 |
| KEN CARYL AVE | 80 |
| LITTLETON BLVD | 80 |
| CHATFIELD AVE | 74 |
| KIPLING PKY | 72 |
| STERNE PKY | 68 |
| PRINCE ST | 66 |
| ALKIRE ST | 58 |
| COUNTY LINE RD | 56 |
| CROSS DR | 56 |
| LOWELL BLVD | 56 |
| POWERS AVE | 54 |
| WINDERMERE ST | 54 |
| MINERAL AVE | 52 |
| ROXBOROUGH PARK | 48 |
| TITAN RD | 48 |
| BANNOCK ST | 46 |
| ARAPAHOE RD | 44 |
| DRY CREEK RD | 44 |
| BERRY AVE | 42 |
| DATURA ST | 42 |
| GALLUP ST | 42 |
| ELATI ST | 40 |
| Other | 1,741 |
2002 - 2018 National Fire Incident Reporting System (NFIRS) incidents
- Incident types reported to NFIRS in Littleton, CO
- 49,91058.1%Rescue & EMS
- 8,86610.3%False Alarm
- 8,3149.7%Hazardous Condition
- 8,1489.5%Service Call
- 6,5097.6%Good Intent Call
- 3,9874.6%Fire
- 1110.1%Special Incident
- Fire incident types reported to NFIRS in Littleton, CO
- 1,67141.9%Outside Fires
- 1,61540.5%Structure Fires
- 54513.7%Mobile Property/Vehicle Fires
- 1563.9%Other
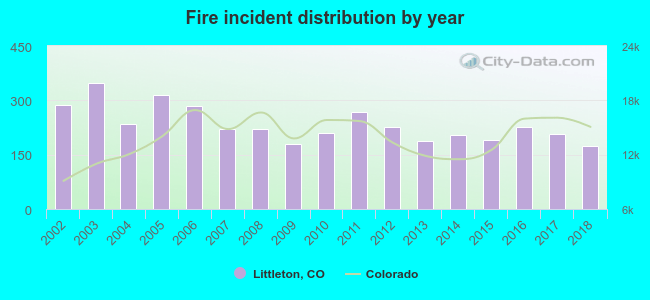 According to the data from the years 2002 - 2018 the average number of fire incidents per year is 235. The highest number of reported fires - 348 took place in 2003, and the least - 174 in 2018. The data has a declining trend.
The average number of yearly fire incidents per 10k residents in Littleton, CO compared to nearest cities:
(Note: Based on data for the last 3 years, including only cities with population 5,000 and above)
| Littleton: | 45.4 |
| Englewood: | 46.5 |
| Sheridan: | 45.9 |
| Cherry Hills Village: | 13.5 |
| Highlands Ranch: | 5.0 |
| Greenwood Village: | 12.1 |
| Lone Tree: | 25.3 |
| Centennial: | 6.9 |
| Glendale: | 18.9 |
 The median response time based on all reported fire incidents is 7 minutes. This is comparable to the Colorado median value.
The median response time in Littleton, CO compared to nearest cities:
(Note: Based on data for all years, including only cities with at least 500 fire incidents)
| Littleton: | 7 minutes |
| Englewood: | 6 minutes |
| Sheridan: | 4 minutes |
| Highlands Ranch: | 7 minutes |
| Lone Tree: | 6 minutes |
| Centennial: | 6 minutes |
| Lakewood: | 5 minutes |
| Denver: | 4 minutes |
| Sedalia: | 15 minutes |
 According to the reports from the years 2002 - 2018 the average number of fire-related yearly deaths is 1. The highest number of reported deaths - 3 took place in 2008, and the lowest - 0 in 2002. The data has a rising trend.
The average number of deaths per 1,000 fires is 2. This indicator was the highest - 14 in 2008, and the lowest 0 in 2002. The trend for deaths per 1,000 fires is growing. Compared to the state value the number of deaths per 1,000 incidents is higher.
According to the reports from the years 2002 - 2018 the average number of fire-related yearly deaths is 1. The highest number of reported deaths - 3 took place in 2008, and the lowest - 0 in 2002. The data has a rising trend.
The average number of deaths per 1,000 fires is 2. This indicator was the highest - 14 in 2008, and the lowest 0 in 2002. The trend for deaths per 1,000 fires is growing. Compared to the state value the number of deaths per 1,000 incidents is higher.
 Based on the data from the years 2002 - 2018 the average number of fire-related casualties per year is 5. The highest number of casualties - 13 took place in 2011, and the lowest - 0 in 2002. The data has an increasing trend.
The average number of casualties per 1,000 fires is 20. This indicator was the highest - 49 in 2011, and the lowest 0 in 2002. The trend for casualties per 1,000 fires is increasing. Compared to the Colorado value the number of casualties per 1,000 incidents is higher.
Based on the data from the years 2002 - 2018 the average number of fire-related casualties per year is 5. The highest number of casualties - 13 took place in 2011, and the lowest - 0 in 2002. The data has an increasing trend.
The average number of casualties per 1,000 fires is 20. This indicator was the highest - 49 in 2011, and the lowest 0 in 2002. The trend for casualties per 1,000 fires is increasing. Compared to the Colorado value the number of casualties per 1,000 incidents is higher.Casualties per 1,000 incidents in Littleton, CO compared to nearest cities:
(Note: Based on data for all years, including only cities with at least 500 fire incidents)
| Littleton: | 19.8 |
| Englewood: | 10.1 |
| Sheridan: | 17.1 |
| Highlands Ranch: | 15.8 |
| Lone Tree: | 6.9 |
| Centennial: | 32.4 |
| Lakewood: | 36.1 |
| Denver: | 20.6 |
| Sedalia: | 0.0 |
 29.0% incidents where reported in the morning and 71.0% in the evening. The most fires (16.1%) took place on Saturday, and the least (13.6%) on Wednesday.
 Based on the 3,987 incident reports from years 2002 - 2018 most fires (12.3%) took place during July, and the least (6.2%) in December.
 Out of all 85,921 cases reported during the years 2002 - 2018, the most belonged to the categories: Rescue & EMS (58.1%), False Alarm (10.3%), and Hazardous Condition (9.7%).
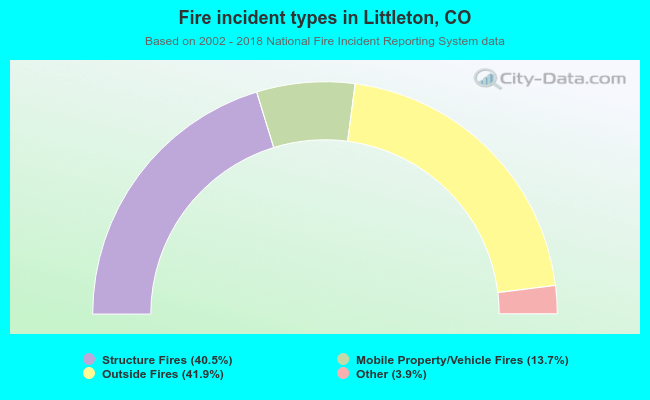 When looking into fire subcategories, the most reports belonged to: Outside Fires (41.9%), and Structure Fires (40.5%).