Centennial: Fire Incidents, Colorado (CO)
Where are fire incidents reported in Centennial, CO
Something went wrong! Please refresh the page.
| Fire incidents reported | |
|---|---|
| Sreet name | Count |
| ARAPAHOE RD | 112 |
| SMOKY HILL RD | 90 |
| PARKER RD | 48 |
| UNIVERSITY BLVD | 44 |
| PICADILLY ST | 36 |
| DRY CREEK RD | 34 |
| BELLEVIEW PL | 30 |
| FREMONT AVE | 30 |
| HIMALAYA ST | 26 |
| PROGRESS DR | 24 |
| DORADO DR | 22 |
| GEDDES AVE | 22 |
| QUEBEC ST | 22 |
| IVY WAY | 20 |
| JERICHO WAY | 20 |
| BERRY PL | 18 |
| EASTER AVE | 18 |
| POWERS PL | 18 |
| PROGRESS AVE | 18 |
| BLACKHAWK ST | 16 |
| BRIARWOOD AVE | 16 |
| COUNTY LINE RD | 16 |
| INVERNESS DR | 16 |
| LAKE AVE | 16 |
| BERRY DR | 14 |
| CLINTON ST | 14 |
| CRESTLINE PL | 14 |
| HIGHLINE CIR | 14 |
| IDA AVE | 14 |
| NETHERLAND ST | 14 |
| Other | 450 |
2002 - 2018 National Fire Incident Reporting System (NFIRS) incidents
- Incident types reported to NFIRS in Centennial, CO
- 16,63757.0%Rescue & EMS
- 3,16210.8%False Alarm
- 2,92110.0%Hazardous Condition
- 2,7869.5%Service Call
- 2,3788.1%Good Intent Call
- 1,2664.3%Fire
- Fire incident types reported to NFIRS in Centennial, CO
- 59146.7%Structure Fires
- 47537.5%Outside Fires
- 16012.6%Mobile Property/Vehicle Fires
- 403.2%Other
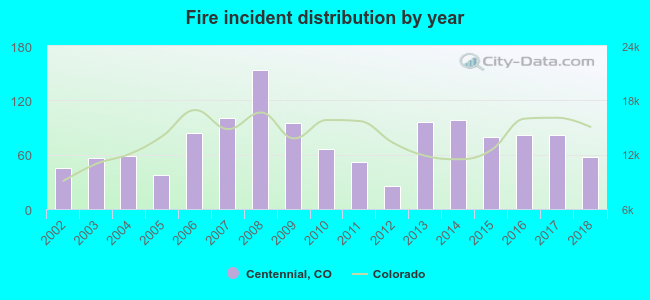 Based on the data from the years 2002 - 2018 the average number of fire incidents per year is 74. The highest number of fires - 153 took place in 2008, and the least - 25 in 2012. The data has a rising trend.
The average number of yearly fire incidents per 10k residents in Centennial, CO compared to nearest cities:
(Note: Based on data for the last 3 years, including only cities with population 5,000 and above)
| Centennial: | 6.9 |
| Lone Tree: | 25.3 |
| Greenwood Village: | 12.1 |
| Highlands Ranch: | 5.0 |
| Cherry Hills Village: | 13.5 |
| Parker: | 25.7 |
| Littleton: | 45.4 |
| Englewood: | 46.5 |
| Castle Pines: | 1.4 |
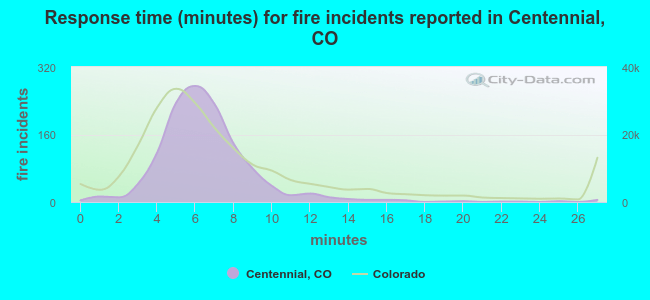 The median response time based on all reported fire incidents is 6 minutes. This is comparable to the state median value.
The median response time in Centennial, CO compared to nearest cities:
(Note: Based on data for all years, including only cities with at least 500 fire incidents)
| Centennial: | 6 minutes |
| Lone Tree: | 6 minutes |
| Highlands Ranch: | 7 minutes |
| Parker: | 7 minutes |
| Littleton: | 7 minutes |
| Englewood: | 6 minutes |
| Aurora: | 6 minutes |
| Sheridan: | 4 minutes |
| Sedalia: | 15 minutes |
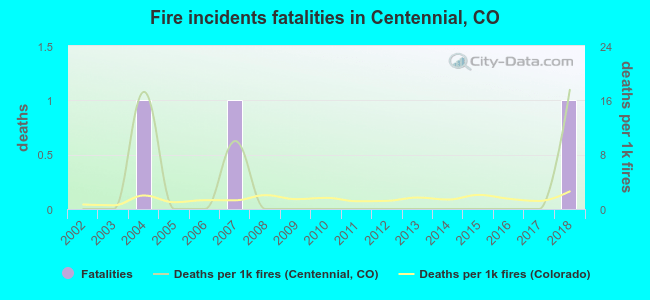 Based on the reports from the years 2002 - 2018 the average number of fire-related yearly deaths is 0. The highest number of deaths - 1 took place in 2004, and the lowest - 0 in 2002. The data has a rising trend.
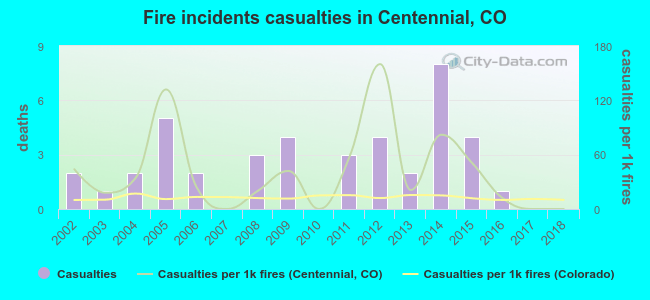 According to the reports from the years 2002 - 2018 the average number of fire-related yearly casualties is 2. The highest number of reported injuries - 8 took place in 2014, and the lowest - 0 in 2007. The data has a dropping trend.
The average number of injuries per 1,000 fires is 41. This indicator was the highest - 160 in 2012, and the lowest 0 in 2007. The trend for casualties per 1,000 fire incidents is dropping. Compared to the Colorado value the number of injuries per 1,000 incidents is much higher.
According to the reports from the years 2002 - 2018 the average number of fire-related yearly casualties is 2. The highest number of reported injuries - 8 took place in 2014, and the lowest - 0 in 2007. The data has a dropping trend.
The average number of injuries per 1,000 fires is 41. This indicator was the highest - 160 in 2012, and the lowest 0 in 2007. The trend for casualties per 1,000 fire incidents is dropping. Compared to the Colorado value the number of injuries per 1,000 incidents is much higher.
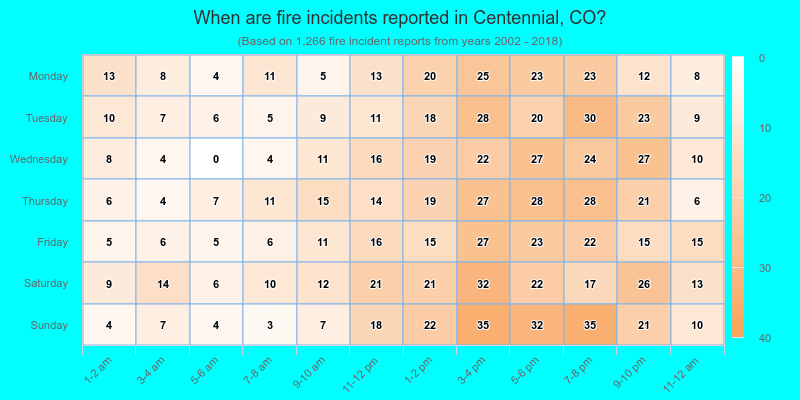
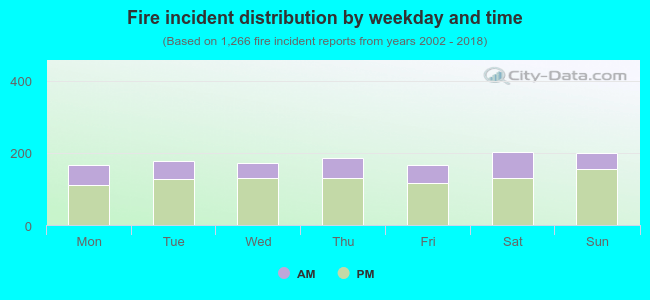 28.9% incidents where reported in the morning and 71.1% in the evening. The most fires (16.0%) took place on Saturday, and the least (13.0%) on Monday.
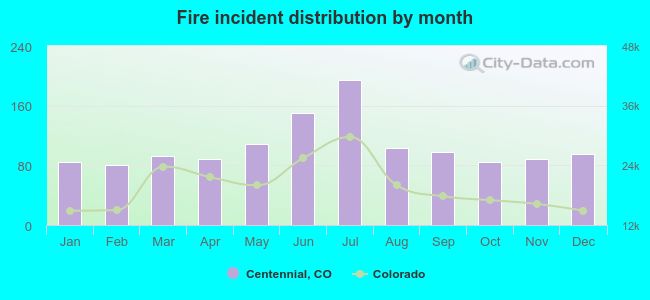 According to the 1,266 fire incidents from years 2002 - 2018 most fires (15.3%) took place during July, and the least (6.3%) in February.
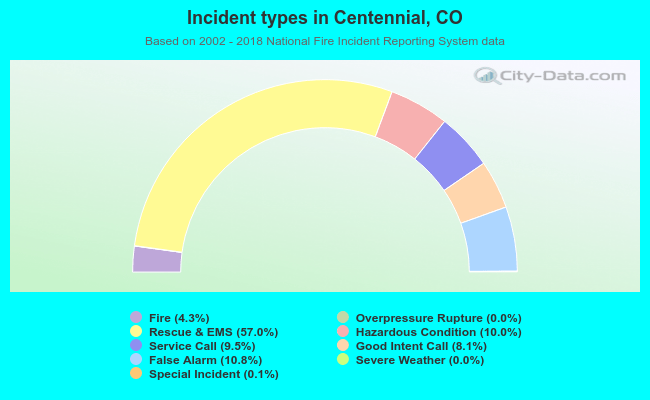 Out of all 29,193 cases reported during the years 2002 - 2018, the most belonged to the categories: Rescue & EMS (57.0%), False Alarm (10.8%), and Hazardous Condition (10.0%).
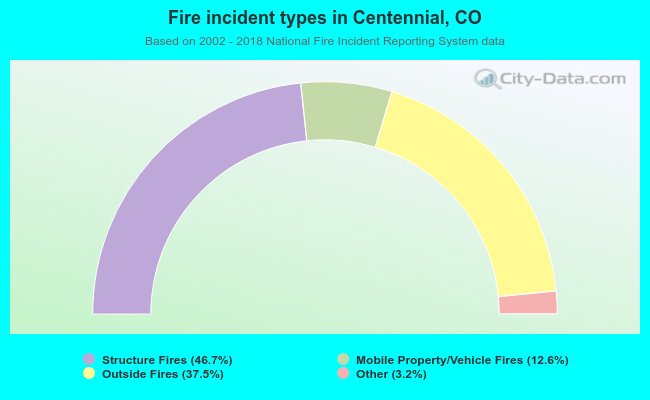 When looking into fire subcategories, the most incidents belonged to: Structure Fires (46.7%), and Outside Fires (37.5%).