Crime rate in Portsmouth, Virginia (VA): murders, rapes, robberies, assaults, burglaries, thefts, auto thefts, arson, law enforcement employees, police officers, crime map
Crime rate in Portsmouth, VA
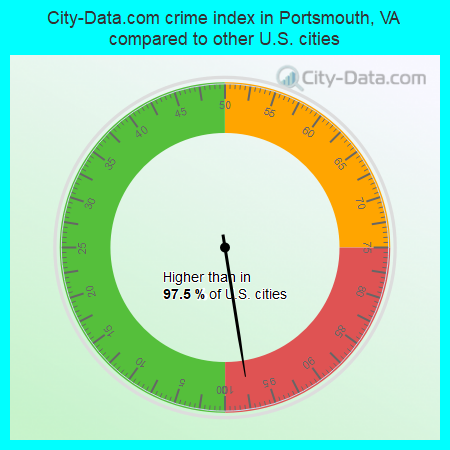
The 2022 crime rate in Portsmouth, VA is 538 (City-Data.com crime index), which is 2.2 times greater than the U.S. average. It was higher than in 97.5% U.S. cities. The 2022 Portsmouth crime rate rose by 24% compared to 2021. The number of homicides stood at 47 - an increase of 11 compared to 2021. In the last 5 years Portsmouth has seen rise of violent crime and decline of property crime.See how dangerous Portsmouth, VA is compared to the nearest cities:
(Note: Higher means more crime)
(Note: Higher means more crime)
| Portsmouth: | 537.5 |
| Chesapeake: | 214.0 |
| Norfolk: | 461.0 |
| Hampton: | 239.8 |
| Virginia Beach: | 109.6 |
| Suffolk: | 226.4 |
| Smithfield: | 99.7 |
| Newport News: | 288.4 |
| Poquoson: | 76.7 |
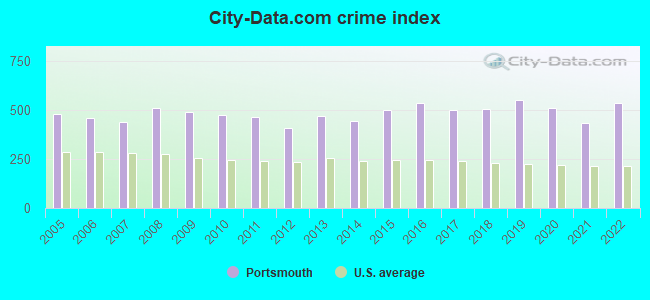
The City-Data.com crime index weighs serious crimes and violent crimes more heavily. Higher means more crime, U.S. average is 246.1. It adjusts for the number of visitors and daily workers commuting into cities.
- means the value is smaller than the state average.- means the value is about the same as the state average.
- means the value is bigger than the state average.
- means the value is much bigger than the state average.
According to our research of Virginia and other state lists, there were 405 registered sex offenders living in Portsmouth, Virginia as of May 23, 2024.
The ratio of all residents to sex offenders in Portsmouth is 240 to 1.
Violent crime rate in 2022
| Portsmouth: | 534.2 |
| U.S. Average: | 219.8 |
Violent crime rate in 2021
| Portsmouth: | 456.6 |
| U.S. Average: | 224.8 |
Violent crime rate in 2020
| Portsmouth: | 529.7 |
| U.S. Average: | 228.2 |
Violent crime rate in 2019
| Portsmouth: | 519.2 |
| U.S. Average: | 219.9 |
Violent crime rate in 2018
| Portsmouth: | 454.3 |
| U.S. Average: | 221.2 |
Violent crime rate in 2017
| Portsmouth: | 400.6 |
| U.S. Average: | 226.2 |
Violent crime rate in 2016
| Portsmouth: | 453.0 |
| U.S. Average: | 227.3 |
Violent crime rate in 2015
| Portsmouth: | 417.7 |
| U.S. Average: | 219.3 |
Violent crime rate in 2014
| Portsmouth: | 345.3 |
| U.S. Average: | 211.1 |
Violent crime rate in 2013
| Portsmouth: | 349.9 |
| U.S. Average: | 214.2 |
Violent crime rate in 2012
| Portsmouth: | 278.6 |
| U.S. Average: | 187.4 |
Violent crime rate in 2011
| Portsmouth: | 334.1 |
| U.S. Average: | 187.1 |
Violent crime rate in 2010
| Portsmouth: | 350.7 |
| U.S. Average: | 195.7 |
Violent crime rate in 2009
| Portsmouth: | 389.7 |
| U.S. Average: | 208.9 |
Violent crime rate in 2008
| Portsmouth: | 408.2 |
| U.S. Average: | 222.5 |
Violent crime rate in 2007
| Portsmouth: | 396.1 |
| U.S. Average: | 229.1 |
Violent crime rate in 2006
| Portsmouth: | 433.1 |
| U.S. Average: | 232.6 |
Violent crime rate in 2005
| Portsmouth: | 452.8 |
| U.S. Average: | 227.0 |
Property crime rate in 2022
| Portsmouth: | 351.7 |
| U.S. Average: | 166.5 |
Property crime rate in 2021
| Portsmouth: | 280.0 |
| U.S. Average: | 157.8 |
Property crime rate in 2020
| Portsmouth: | 355.3 |
| U.S. Average: | 169.6 |
Property crime rate in 2019
| Portsmouth: | 480.1 |
| U.S. Average: | 179.7 |
Property crime rate in 2018
| Portsmouth: | 457.9 |
| U.S. Average: | 190.2 |
Property crime rate in 2017
| Portsmouth: | 511.0 |
| U.S. Average: | 206.4 |
Property crime rate in 2016
| Portsmouth: | 533.2 |
| U.S. Average: | 216.6 |
Property crime rate in 2015
| Portsmouth: | 475.1 |
| U.S. Average: | 221.5 |
Property crime rate in 2014
| Portsmouth: | 475.9 |
| U.S. Average: | 230.8 |
Property crime rate in 2013
| Portsmouth: | 536.5 |
| U.S. Average: | 250.4 |
Property crime rate in 2012
| Portsmouth: | 461.6 |
| U.S. Average: | 267.3 |
Property crime rate in 2011
| Portsmouth: | 510.2 |
| U.S. Average: | 273.5 |
Property crime rate in 2010
| Portsmouth: | 525.3 |
| U.S. Average: | 276.4 |
Property crime rate in 2009
| Portsmouth: | 486.0 |
| U.S. Average: | 285.6 |
Property crime rate in 2008
| Portsmouth: | 478.3 |
| U.S. Average: | 302.2 |
Property crime rate in 2007
| Portsmouth: | 398.9 |
| U.S. Average: | 309.2 |
Property crime rate in 2006
| Portsmouth: | 403.2 |
| U.S. Average: | 317.3 |
Property crime rate in 2005
| Portsmouth: | 409.1 |
| U.S. Average: | 322.3 |


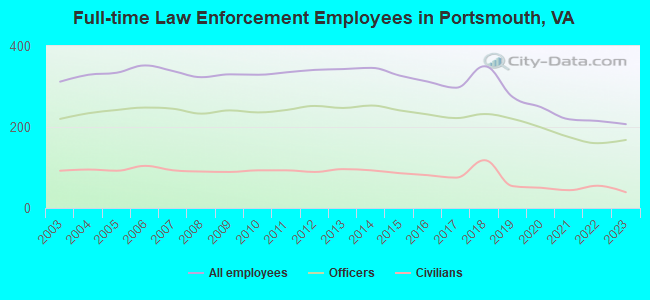
Full-time law enforcement employees in 2021, including police officers: 219 (175 officers - 138 male; 37 female).
| Officers per 1,000 residents here: | 1.84 |
| Virginia average: | 2.24 |
Full-time law enforcement employees in 2020, including police officers: 249 (199 officers - 149 male; 50 female).
| Officers per 1,000 residents here: | 2.11 |
| Virginia average: | 2.31 |
Full-time law enforcement employees in 2019, including police officers: 274 (220 officers - 171 male; 49 female).
| Officers per 1,000 residents here: | 2.34 |
| Virginia average: | 2.27 |
Full-time law enforcement employees in 2018, including police officers: 350 (232 officers - 180 male; 52 female).
| Officers per 1,000 residents here: | 2.46 |
| Virginia average: | 2.26 |
Full-time law enforcement employees in 2017, including police officers: 297 (222 officers - 178 male; 44 female).
| Officers per 1,000 residents here: | 2.33 |
| Virginia average: | 2.25 |
Full-time law enforcement employees in 2016, including police officers: 312 (231 officers - 191 male; 40 female).
| Officers per 1,000 residents here: | 2.41 |
| Virginia average: | 2.25 |
Full-time law enforcement employees in 2015, including police officers: 327 (241 officers - 200 male; 41 female).
| Officers per 1,000 residents here: | 2.51 |
| Virginia average: | 2.26 |
Full-time law enforcement employees in 2014, including police officers: 346 (253 officers - 212 male; 41 female).
| Officers per 1,000 residents here: | 2.62 |
| Virginia average: | 2.27 |
Full-time law enforcement employees in 2013, including police officers: 343 (247 officers - 213 male; 34 female).
| Officers per 1,000 residents here: | 2.55 |
| Virginia average: | 2.27 |
Full-time law enforcement employees in 2012, including police officers: 341 (252 officers - 217 male; 35 female).
| Officers per 1,000 residents here: | 2.60 |
| Virginia average: | 2.27 |
Full-time law enforcement employees in 2011, including police officers: 335 (242 officers - 209 male; 33 female).
| Officers per 1,000 residents here: | 2.50 |
| Virginia average: | 2.28 |
Full-time law enforcement employees in 2010, including police officers: 329 (236 officers - 209 male; 27 female).
| Officers per 1,000 residents here: | 2.47 |
| Virginia average: | 2.30 |
Full-time law enforcement employees in 2009, including police officers: 330 (241 officers - 214 male; 27 female).
| Officers per 1,000 residents here: | 2.39 |
| Virginia average: | 2.32 |
Full-time law enforcement employees in 2008, including police officers: 323 (233 officers - 210 male; 23 female).
| Officers per 1,000 residents here: | 2.29 |
| Virginia average: | 2.38 |
Full-time law enforcement employees in 2007, including police officers: 338 (245 officers - 219 male; 26 female).
| Officers per 1,000 residents here: | 2.42 |
| Virginia average: | 2.34 |
Full-time law enforcement employees in 2006, including police officers: 352 (248 officers - 221 male; 27 female).
| Officers per 1,000 residents here: | 2.45 |
| Virginia average: | 2.31 |
Full-time law enforcement employees in 2005, including police officers: 334 (242 officers - 214 male; 28 female).
| Officers per 1,000 residents here: | 2.40 |
| Virginia average: | 2.29 |
Full-time law enforcement employees in 2004, including police officers: 329 (234 officers - 205 male; 29 female).
| Officers per 1,000 residents here: | 2.33 |
| Virginia average: | 2.28 |
Full-time law enforcement employees in 2003, including police officers: 312 (220 officers - 194 male; 26 female).
| Officers per 1,000 residents here: | 2.18 |
| Virginia average: | 2.27 |