Crime rate in Chesapeake, Virginia (VA): murders, rapes, robberies, assaults, burglaries, thefts, auto thefts, arson, law enforcement employees, police officers, crime map
Crime rate in Chesapeake, VA
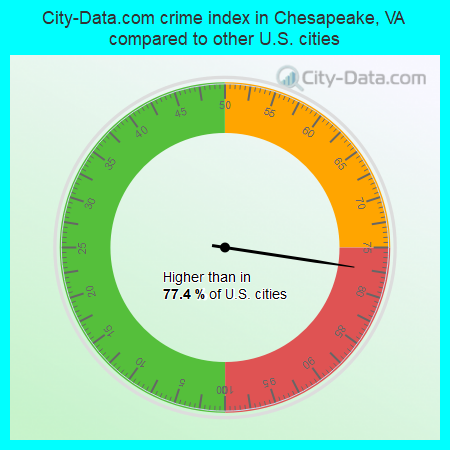
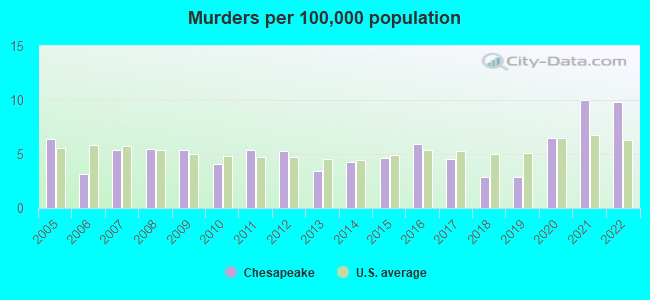
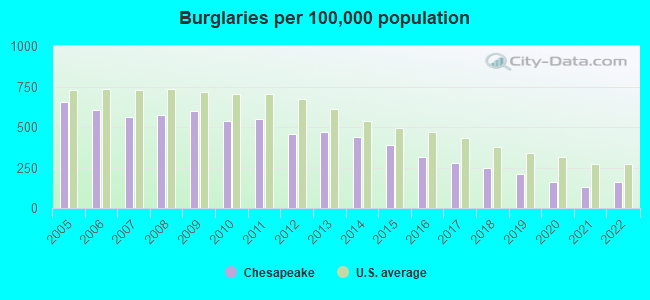
The 2022 crime rate in Chesapeake, VA is 214 (City-Data.com crime index), which is about the average for the U.S. cities. It was higher than in 77.4% U.S. cities. The 2022 Chesapeake crime rate fell by 3% compared to 2021. The number of homicides stood at 25. In the last 5 years Chesapeake has seen increasing violent crime and decreasing property crime.See how dangerous Chesapeake, VA is compared to the nearest cities:
(Note: Higher means more crime)
(Note: Higher means more crime)
| Chesapeake: | 214.0 |
| Portsmouth: | 537.5 |
| Norfolk: | 461.0 |
| Virginia Beach: | 109.6 |
| Suffolk: | 226.4 |
| Hampton: | 239.8 |
| Smithfield: | 99.7 |
| Newport News: | 288.4 |
| Windsor: | 141.5 |
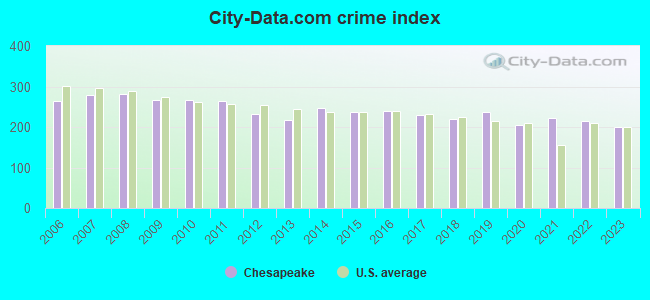
The City-Data.com crime index weighs serious crimes and violent crimes more heavily. Higher means more crime, U.S. average is 246.1. It adjusts for the number of visitors and daily workers commuting into cities.
- means the value is smaller than the state average.- means the value is about the same as the state average.
- means the value is bigger than the state average.
- means the value is much bigger than the state average.
According to our research of Virginia and other state lists, there were 498 registered sex offenders living in Chesapeake, Virginia as of May 23, 2024.
The ratio of all residents to sex offenders in Chesapeake is 474 to 1.
The ratio of registered sex offenders to all residents in this city is lower than the state average.
Violent crime rate in 2022
| Chesapeake: | 237.6 |
| U.S. Average: | 219.8 |
Violent crime rate in 2021
| Chesapeake: | 271.7 |
| U.S. Average: | 224.8 |
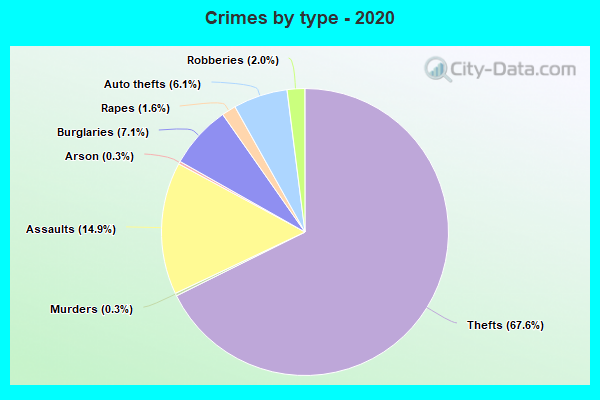
Violent crime rate in 2020
| Chesapeake: | 237.9 |
| U.S. Average: | 228.2 |
Violent crime rate in 2019
| Chesapeake: | 260.5 |
| U.S. Average: | 219.9 |
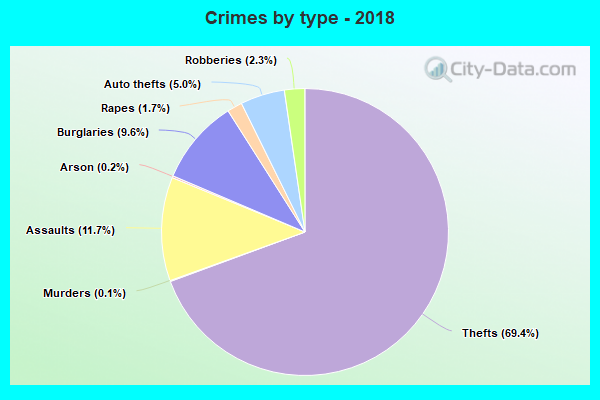
Violent crime rate in 2018
| Chesapeake: | 230.5 |
| U.S. Average: | 221.2 |
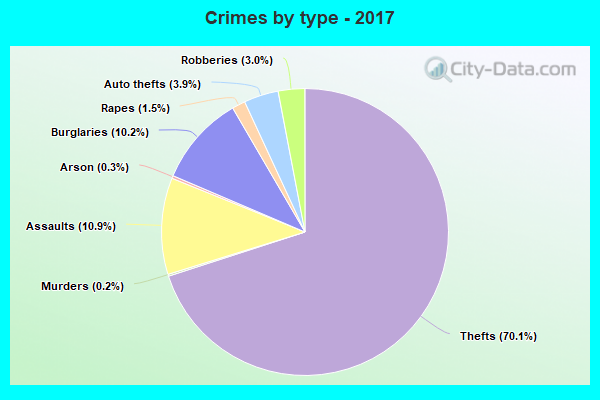
Violent crime rate in 2017
| Chesapeake: | 238.2 |
| U.S. Average: | 226.2 |
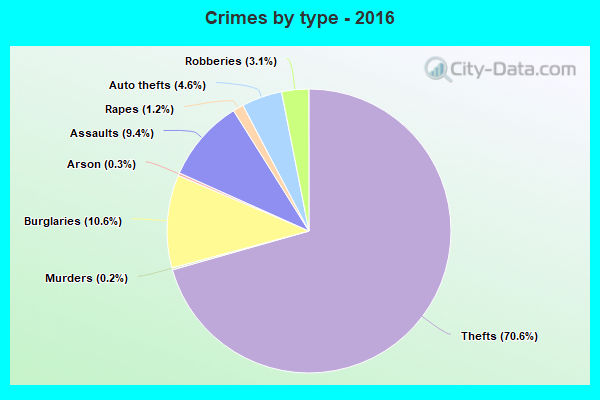
Violent crime rate in 2016
| Chesapeake: | 232.3 |
| U.S. Average: | 227.3 |
Violent crime rate in 2015
| Chesapeake: | 229.3 |
| U.S. Average: | 219.3 |
Violent crime rate in 2014
| Chesapeake: | 235.9 |
| U.S. Average: | 211.1 |
Violent crime rate in 2013
| Chesapeake: | 176.7 |
| U.S. Average: | 214.2 |
Violent crime rate in 2012
| Chesapeake: | 200.6 |
| U.S. Average: | 187.4 |
Violent crime rate in 2011
| Chesapeake: | 217.5 |
| U.S. Average: | 187.1 |
Violent crime rate in 2010
| Chesapeake: | 210.2 |
| U.S. Average: | 195.7 |
Violent crime rate in 2009
| Chesapeake: | 213.0 |
| U.S. Average: | 208.9 |
Violent crime rate in 2008
| Chesapeake: | 253.6 |
| U.S. Average: | 222.5 |
Violent crime rate in 2007
| Chesapeake: | 237.5 |
| U.S. Average: | 229.1 |
Violent crime rate in 2006
| Chesapeake: | 228.9 |
| U.S. Average: | 232.6 |
Violent crime rate in 2005
| Chesapeake: | 268.5 |
| U.S. Average: | 227.0 |
Property crime rate in 2022
| Chesapeake: | 140.7 |
| U.S. Average: | 166.5 |
Property crime rate in 2021
| Chesapeake: | 121.7 |
| U.S. Average: | 157.8 |
Property crime rate in 2020
| Chesapeake: | 127.8 |
| U.S. Average: | 169.6 |
Property crime rate in 2019
| Chesapeake: | 161.8 |
| U.S. Average: | 179.7 |
Property crime rate in 2018
| Chesapeake: | 158.3 |
| U.S. Average: | 190.2 |
Property crime rate in 2017
| Chesapeake: | 166.4 |
| U.S. Average: | 206.4 |
Property crime rate in 2016
| Chesapeake: | 188.5 |
| U.S. Average: | 216.6 |
Property crime rate in 2015
| Chesapeake: | 198.3 |
| U.S. Average: | 221.5 |
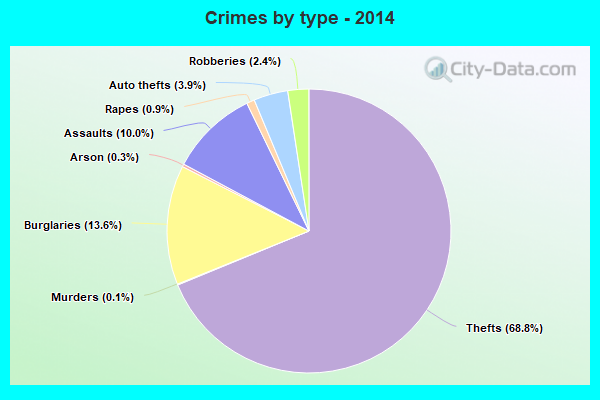
Property crime rate in 2014
| Chesapeake: | 216.1 |
| U.S. Average: | 230.8 |
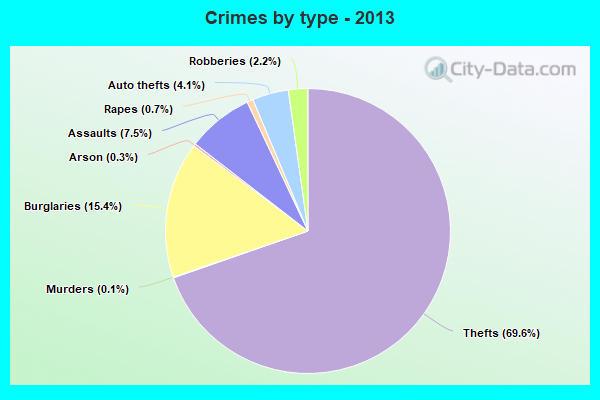
Property crime rate in 2013
| Chesapeake: | 217.8 |
| U.S. Average: | 250.4 |
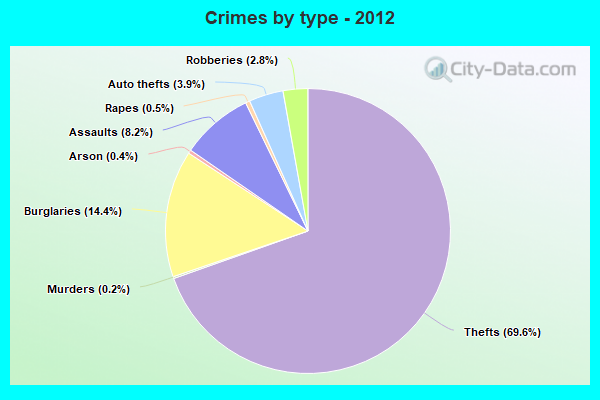
Property crime rate in 2012
| Chesapeake: | 221.1 |
| U.S. Average: | 267.3 |
Property crime rate in 2011
| Chesapeake: | 258.0 |
| U.S. Average: | 273.5 |
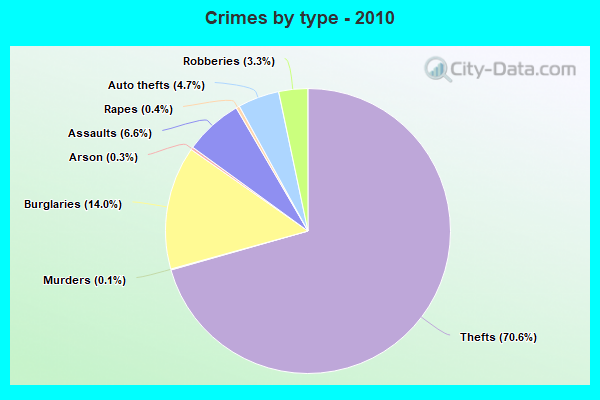
Property crime rate in 2010
| Chesapeake: | 268.4 |
| U.S. Average: | 276.4 |
Property crime rate in 2009
| Chesapeake: | 285.6 |
| U.S. Average: | 285.6 |
Property crime rate in 2008
| Chesapeake: | 267.1 |
| U.S. Average: | 302.2 |
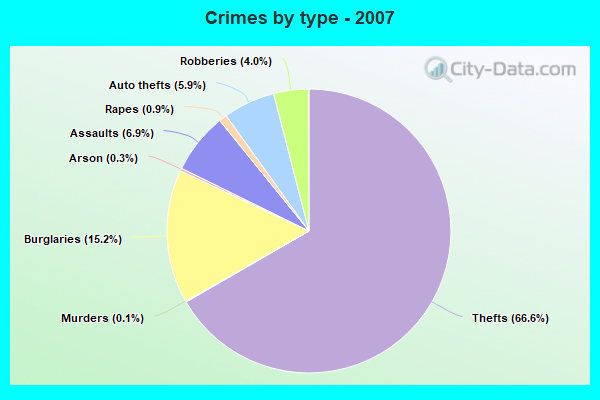
Property crime rate in 2007
| Chesapeake: | 259.0 |
| U.S. Average: | 309.2 |
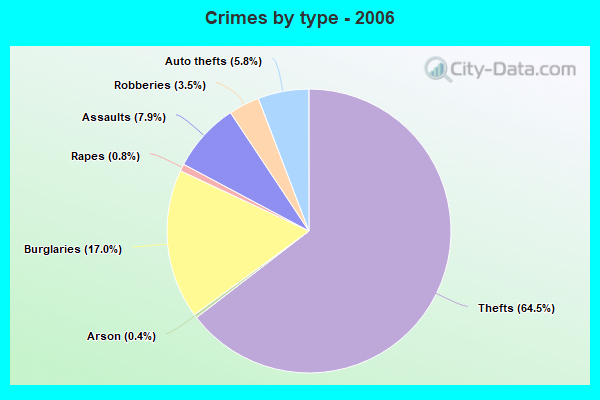
Property crime rate in 2006
| Chesapeake: | 258.9 |
| U.S. Average: | 317.3 |
Property crime rate in 2005
| Chesapeake: | 293.6 |
| U.S. Average: | 322.3 |


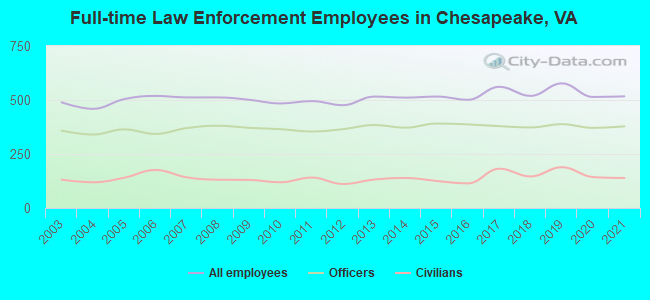
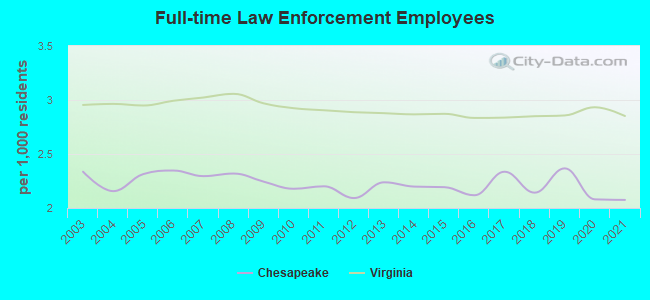
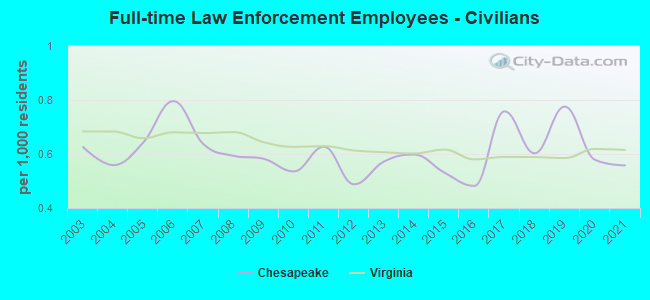
Full-time law enforcement employees in 2021, including police officers: 517 (378 officers - 303 male; 75 female).
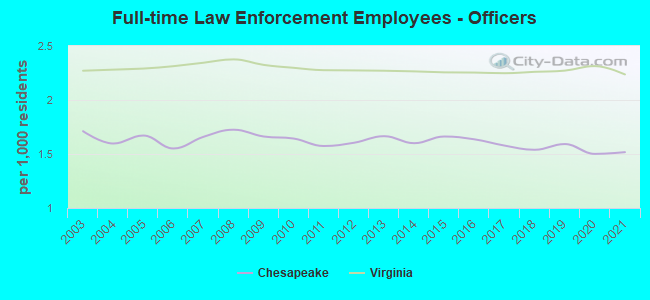
| Officers per 1,000 residents here: | 1.52 |
| Virginia average: | 2.24 |
Full-time law enforcement employees in 2020, including police officers: 514 (371 officers - 300 male; 71 female).
| Officers per 1,000 residents here: | 1.50 |
| Virginia average: | 2.31 |
Full-time law enforcement employees in 2019, including police officers: 577 (388 officers - 314 male; 74 female).
| Officers per 1,000 residents here: | 1.59 |
| Virginia average: | 2.27 |
Full-time law enforcement employees in 2018, including police officers: 519 (373 officers - 307 male; 66 female).
| Officers per 1,000 residents here: | 1.54 |
| Virginia average: | 2.26 |
Full-time law enforcement employees in 2017, including police officers: 561 (379 officers - 309 male; 70 female).
| Officers per 1,000 residents here: | 1.58 |
| Virginia average: | 2.25 |
Full-time law enforcement employees in 2016, including police officers: 501 (387 officers - 311 male; 76 female).
| Officers per 1,000 residents here: | 1.64 |
| Virginia average: | 2.25 |
Full-time law enforcement employees in 2015, including police officers: 516 (391 officers - 320 male; 71 female).
| Officers per 1,000 residents here: | 1.66 |
| Virginia average: | 2.26 |
Full-time law enforcement employees in 2014, including police officers: 511 (372 officers - 305 male; 67 female).
| Officers per 1,000 residents here: | 1.60 |
| Virginia average: | 2.27 |
Full-time law enforcement employees in 2013, including police officers: 516 (384 officers - 318 male; 66 female).
| Officers per 1,000 residents here: | 1.67 |
| Virginia average: | 2.27 |
Full-time law enforcement employees in 2012, including police officers: 476 (365 officers - 303 male; 62 female).
| Officers per 1,000 residents here: | 1.60 |
| Virginia average: | 2.27 |
Full-time law enforcement employees in 2011, including police officers: 495 (354 officers - 298 male; 56 female).
| Officers per 1,000 residents here: | 1.57 |
| Virginia average: | 2.28 |
Full-time law enforcement employees in 2010, including police officers: 484 (365 officers - 306 male; 59 female).
| Officers per 1,000 residents here: | 1.64 |
| Virginia average: | 2.30 |
Full-time law enforcement employees in 2009, including police officers: 501 (371 officers - 315 male; 56 female).
| Officers per 1,000 residents here: | 1.66 |
| Virginia average: | 2.32 |
Full-time law enforcement employees in 2008, including police officers: 512 (381 officers - 325 male; 56 female).
| Officers per 1,000 residents here: | 1.73 |
| Virginia average: | 2.38 |
Full-time law enforcement employees in 2007, including police officers: 512 (370 officers - 320 male; 50 female).
| Officers per 1,000 residents here: | 1.66 |
| Virginia average: | 2.34 |
Full-time law enforcement employees in 2006, including police officers: 519 (343 officers - 294 male; 49 female).
| Officers per 1,000 residents here: | 1.55 |
| Virginia average: | 2.31 |
Full-time law enforcement employees in 2005, including police officers: 504 (364 officers - 311 male; 53 female).
| Officers per 1,000 residents here: | 1.67 |
| Virginia average: | 2.29 |
Full-time law enforcement employees in 2004, including police officers: 459 (340 officers - 290 male; 50 female).
| Officers per 1,000 residents here: | 1.60 |
| Virginia average: | 2.28 |
Full-time law enforcement employees in 2003, including police officers: 489 (358 officers - 302 male; 56 female).
| Officers per 1,000 residents here: | 1.71 |
| Virginia average: | 2.27 |