Crime rate in Norfolk, Virginia (VA): murders, rapes, robberies, assaults, burglaries, thefts, auto thefts, arson, law enforcement employees, police officers, crime map
Crime rate in Norfolk, VA
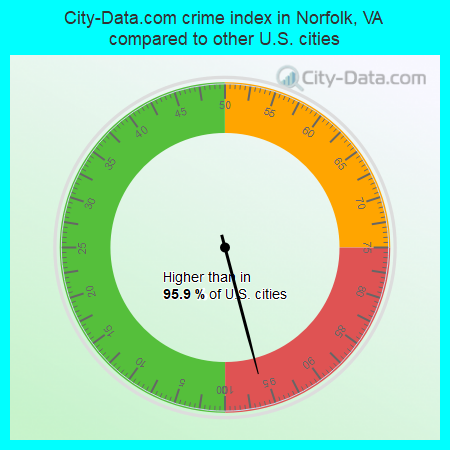
The 2022 crime rate in Norfolk, VA is 461 (City-Data.com crime index), which is 1.9 times higher than the U.S. average. It was higher than in 95.9% U.S. cities. The 2022 Norfolk crime rate rose by 17% compared to 2021. The number of homicides stood at 63. In the last 5 years Norfolk has seen rise of violent crime and increasing property crime.See how dangerous Norfolk, VA is compared to the nearest cities:
(Note: Higher means more crime)
(Note: Higher means more crime)
| Norfolk: | 461.0 |
| Portsmouth: | 537.5 |
| Chesapeake: | 214.0 |
| Virginia Beach: | 109.6 |
| Hampton: | 239.8 |
| Newport News: | 288.4 |
| Poquoson: | 76.7 |
| Smithfield: | 99.7 |
| Suffolk: | 226.4 |

The City-Data.com crime index weighs serious crimes and violent crimes more heavily. Higher means more crime, U.S. average is 246.1. It adjusts for the number of visitors and daily workers commuting into cities.
- means the value is smaller than the state average.- means the value is about the same as the state average.
- means the value is bigger than the state average.
- means the value is much bigger than the state average.
According to our research of Virginia and other state lists, there were 869 registered sex offenders living in Norfolk, Virginia as of May 23, 2024.
The ratio of all residents to sex offenders in Norfolk is 282 to 1.
The ratio of registered sex offenders to all residents in this city is near the state average.
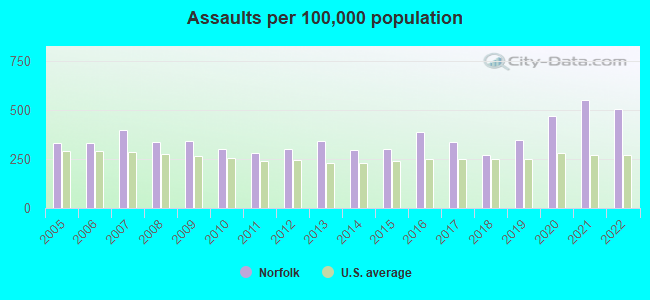
Violent crime rate in 2022
| Norfolk: | 412.8 |
| U.S. Average: | 219.8 |
Violent crime rate in 2021
| Norfolk: | 439.0 |
| U.S. Average: | 224.8 |
Violent crime rate in 2020
| Norfolk: | 379.2 |
| U.S. Average: | 228.2 |
Violent crime rate in 2019
| Norfolk: | 329.5 |
| U.S. Average: | 219.9 |
Violent crime rate in 2018
| Norfolk: | 284.8 |
| U.S. Average: | 221.2 |
Violent crime rate in 2017
| Norfolk: | 333.4 |
| U.S. Average: | 226.2 |
Violent crime rate in 2016
| Norfolk: | 384.6 |
| U.S. Average: | 227.3 |
Violent crime rate in 2015
| Norfolk: | 315.2 |
| U.S. Average: | 219.3 |
Violent crime rate in 2014
| Norfolk: | 304.4 |
| U.S. Average: | 211.1 |
Violent crime rate in 2013
| Norfolk: | 335.4 |
| U.S. Average: | 214.2 |
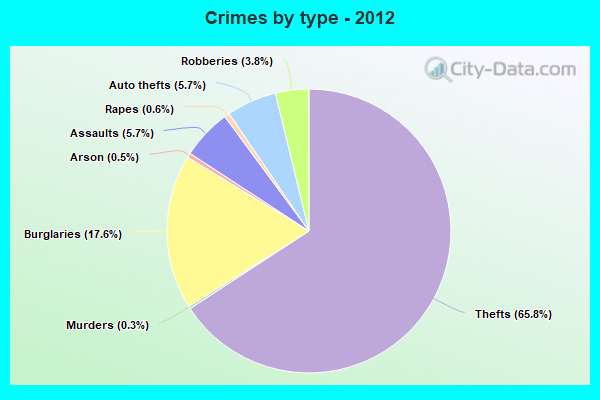
Violent crime rate in 2012
| Norfolk: | 311.2 |
| U.S. Average: | 187.4 |
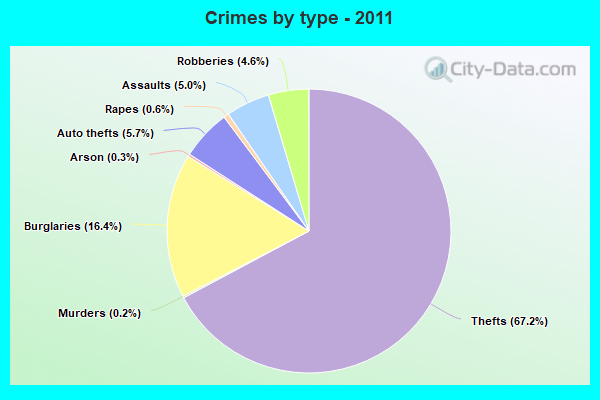
Violent crime rate in 2011
| Norfolk: | 325.2 |
| U.S. Average: | 187.1 |
Violent crime rate in 2010
| Norfolk: | 339.0 |
| U.S. Average: | 195.7 |
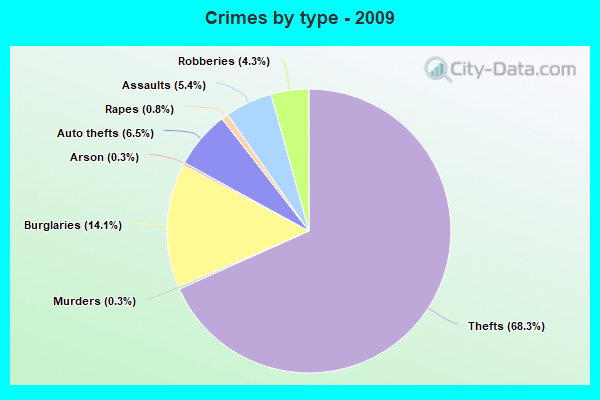
Violent crime rate in 2009
| Norfolk: | 392.8 |
| U.S. Average: | 208.9 |
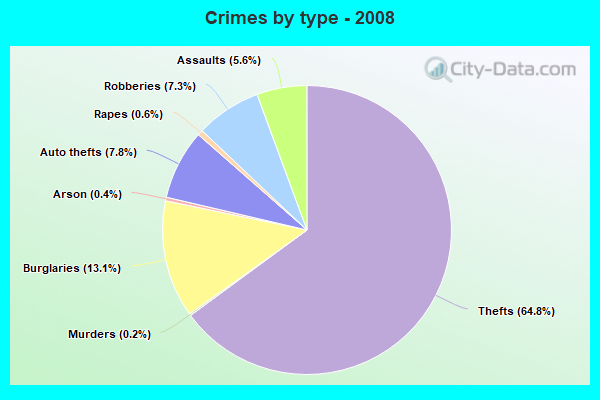
Violent crime rate in 2008
| Norfolk: | 457.5 |
| U.S. Average: | 222.5 |
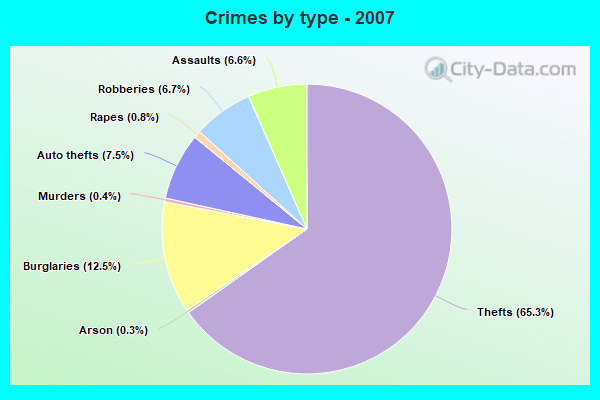
Violent crime rate in 2007
| Norfolk: | 364.1 |
| U.S. Average: | 229.1 |
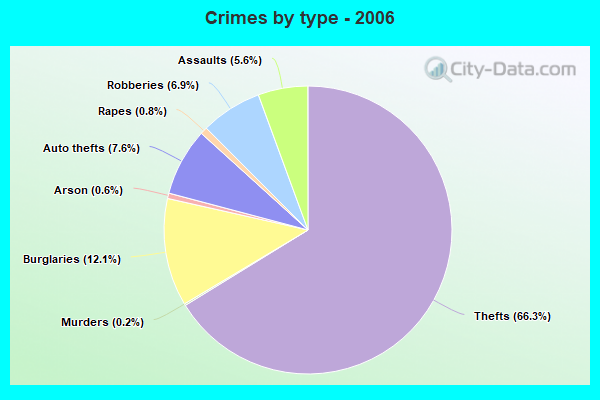
Violent crime rate in 2006
| Norfolk: | 323.4 |
| U.S. Average: | 232.6 |
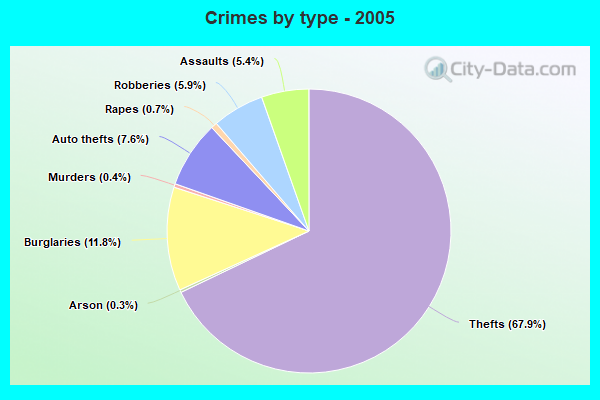
Violent crime rate in 2005
| Norfolk: | 325.3 |
| U.S. Average: | 227.0 |
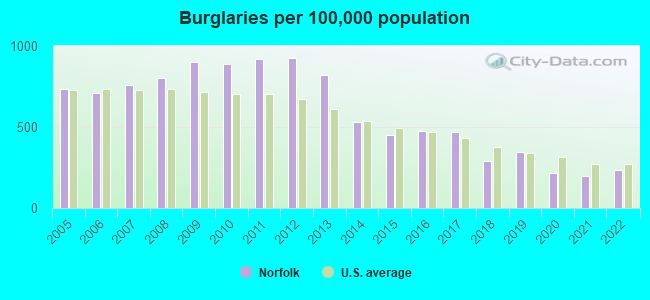
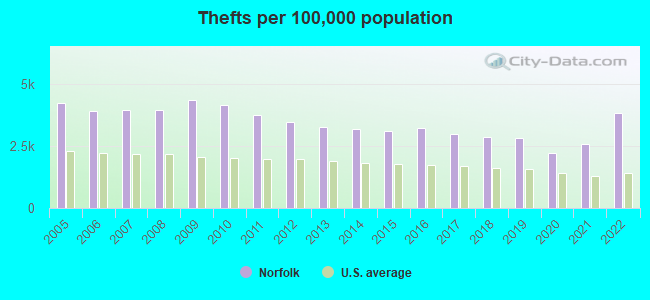
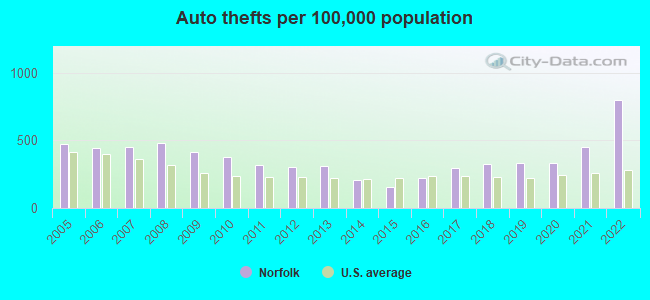
Property crime rate in 2022
| Norfolk: | 358.5 |
| U.S. Average: | 166.5 |
Property crime rate in 2021
| Norfolk: | 236.5 |
| U.S. Average: | 157.8 |
Property crime rate in 2020
| Norfolk: | 202.7 |
| U.S. Average: | 169.6 |
Property crime rate in 2019
| Norfolk: | 259.2 |
| U.S. Average: | 179.7 |
Property crime rate in 2018
| Norfolk: | 249.7 |
| U.S. Average: | 190.2 |
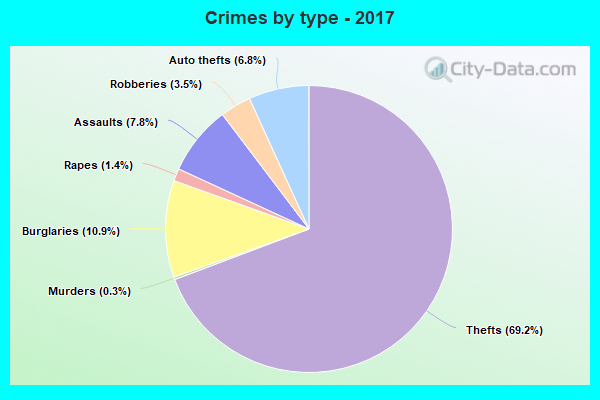
Property crime rate in 2017
| Norfolk: | 288.6 |
| U.S. Average: | 206.4 |
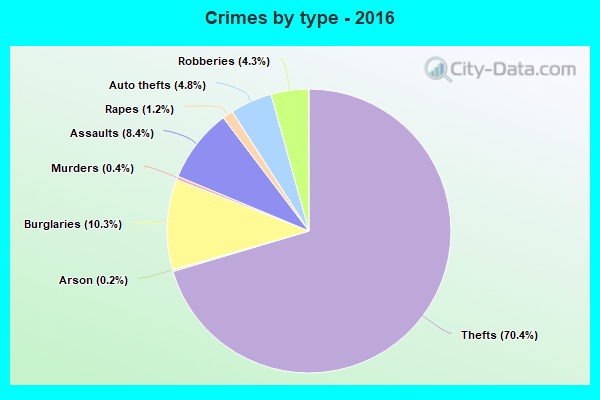
Property crime rate in 2016
| Norfolk: | 289.2 |
| U.S. Average: | 216.6 |
Property crime rate in 2015
| Norfolk: | 267.6 |
| U.S. Average: | 221.5 |
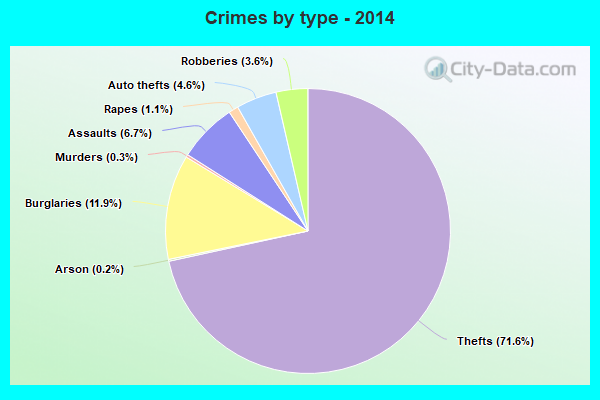
Property crime rate in 2014
| Norfolk: | 296.4 |
| U.S. Average: | 230.8 |
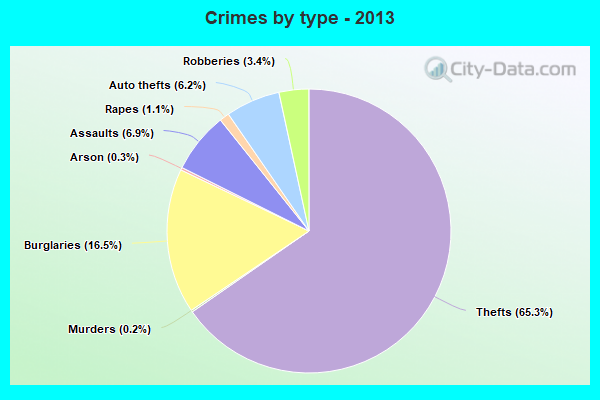
Property crime rate in 2013
| Norfolk: | 374.4 |
| U.S. Average: | 250.4 |
Property crime rate in 2012
| Norfolk: | 402.4 |
| U.S. Average: | 267.3 |
Property crime rate in 2011
| Norfolk: | 420.4 |
| U.S. Average: | 273.5 |
Property crime rate in 2010
| Norfolk: | 443.4 |
| U.S. Average: | 276.4 |
Property crime rate in 2009
| Norfolk: | 459.9 |
| U.S. Average: | 285.6 |
Property crime rate in 2008
| Norfolk: | 429.0 |
| U.S. Average: | 302.2 |
Property crime rate in 2007
| Norfolk: | 308.4 |
| U.S. Average: | 309.2 |
Property crime rate in 2006
| Norfolk: | 298.7 |
| U.S. Average: | 317.3 |
Property crime rate in 2005
| Norfolk: | 317.3 |
| U.S. Average: | 322.3 |
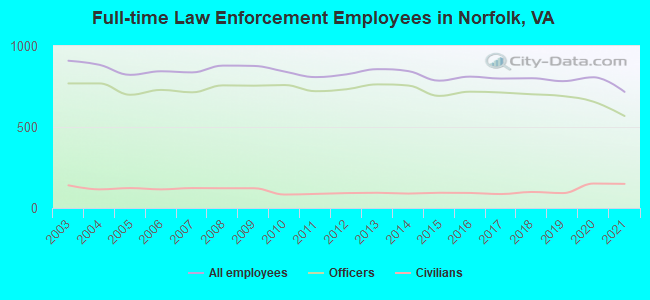
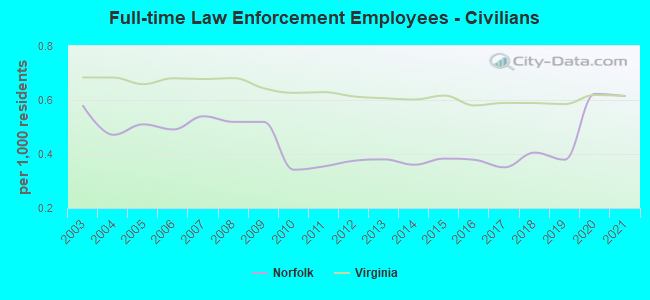
Full-time law enforcement employees in 2021, including police officers: 717 (568 officers - 504 male; 64 female).
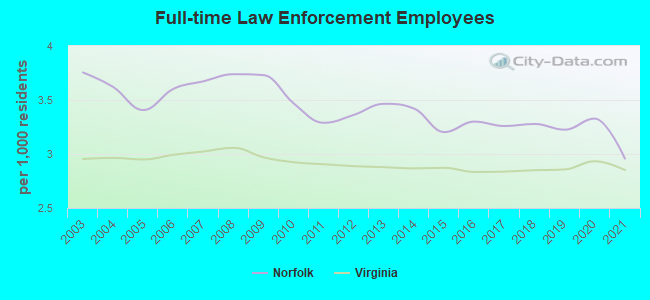
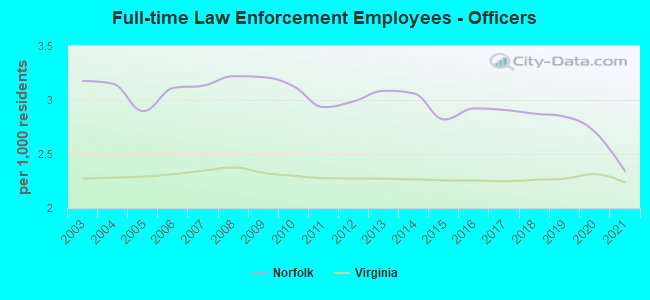
| Officers per 1,000 residents here: | 2.34 |
| Virginia average: | 2.24 |
Full-time law enforcement employees in 2020, including police officers: 807 (656 officers - 577 male; 79 female).
| Officers per 1,000 residents here: | 2.70 |
| Virginia average: | 2.31 |
Full-time law enforcement employees in 2019, including police officers: 783 (691 officers - 615 male; 76 female).
| Officers per 1,000 residents here: | 2.85 |
| Virginia average: | 2.27 |
Full-time law enforcement employees in 2018, including police officers: 801 (702 officers - 621 male; 81 female).
| Officers per 1,000 residents here: | 2.87 |
| Virginia average: | 2.26 |
Full-time law enforcement employees in 2017, including police officers: 799 (713 officers - 633 male; 80 female).
| Officers per 1,000 residents here: | 2.91 |
| Virginia average: | 2.25 |
Full-time law enforcement employees in 2016, including police officers: 811 (718 officers - 641 male; 77 female).
| Officers per 1,000 residents here: | 2.92 |
| Virginia average: | 2.25 |
Full-time law enforcement employees in 2015, including police officers: 786 (692 officers - 624 male; 68 female).
| Officers per 1,000 residents here: | 2.82 |
| Virginia average: | 2.26 |
Full-time law enforcement employees in 2014, including police officers: 845 (756 officers - 682 male; 74 female).
| Officers per 1,000 residents here: | 3.06 |
| Virginia average: | 2.27 |
Full-time law enforcement employees in 2013, including police officers: 857 (763 officers - 684 male; 79 female).
| Officers per 1,000 residents here: | 3.09 |
| Virginia average: | 2.27 |
Full-time law enforcement employees in 2012, including police officers: 825 (733 officers - 662 male; 71 female).
| Officers per 1,000 residents here: | 2.99 |
| Virginia average: | 2.27 |
Full-time law enforcement employees in 2011, including police officers: 808 (721 officers - 643 male; 78 female).
| Officers per 1,000 residents here: | 2.93 |
| Virginia average: | 2.28 |
Full-time law enforcement employees in 2010, including police officers: 842 (759 officers - 682 male; 77 female).
| Officers per 1,000 residents here: | 3.13 |
| Virginia average: | 2.30 |
Full-time law enforcement employees in 2009, including police officers: 877 (755 officers - 675 male; 80 female).
| Officers per 1,000 residents here: | 3.21 |
| Virginia average: | 2.32 |
Full-time law enforcement employees in 2008, including police officers: 879 (757 officers - 675 male; 82 female).
| Officers per 1,000 residents here: | 3.22 |
| Virginia average: | 2.38 |
Full-time law enforcement employees in 2007, including police officers: 837 (714 officers - 631 male; 83 female).
| Officers per 1,000 residents here: | 3.13 |
| Virginia average: | 2.34 |
Full-time law enforcement employees in 2006, including police officers: 844 (729 officers - 639 male; 90 female).
| Officers per 1,000 residents here: | 3.11 |
| Virginia average: | 2.31 |
Full-time law enforcement employees in 2005, including police officers: 822 (699 officers - 619 male; 80 female).
| Officers per 1,000 residents here: | 2.90 |
| Virginia average: | 2.29 |
Full-time law enforcement employees in 2004, including police officers: 884 (769 officers - 688 male; 81 female).
| Officers per 1,000 residents here: | 3.15 |
| Virginia average: | 2.28 |
Full-time law enforcement employees in 2003, including police officers: 909 (769 officers - 684 male; 85 female).
| Officers per 1,000 residents here: | 3.18 |
| Virginia average: | 2.27 |


Zip codes: 23502, 23503, 23504, 23505, 23507, 23508, 23509, 23510, 23511, 23513, 23517, 23518, 23523, 23551.