Estimated zip code population in 2022: 33,373 Zip code population in 2010: 34,836 Zip code population in 2000: 32,799
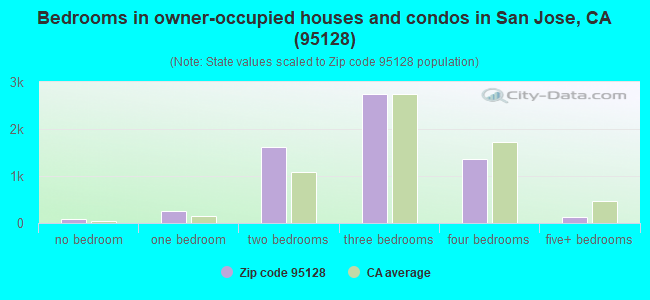
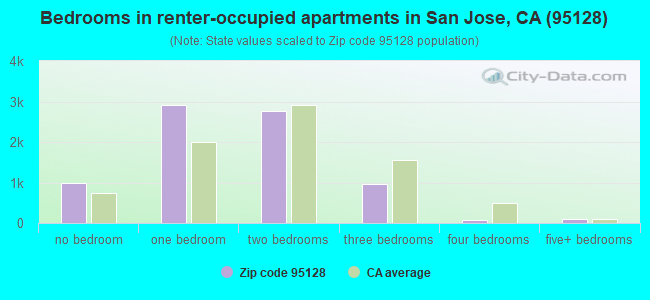
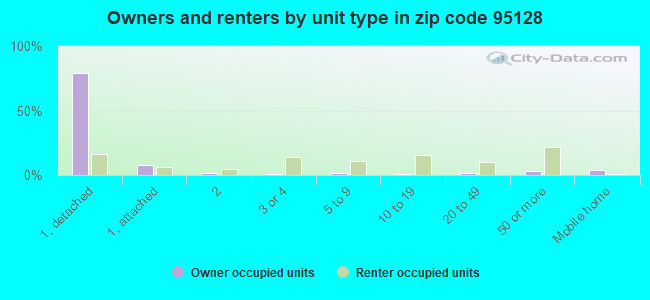
Houses and condos: 15,131 Renter-occupied apartments: 7,783
% of renters here:
56%
State:
44%
March 2022 cost of living index in zip code 95128: 125.4 (high, U.S. average is 100)
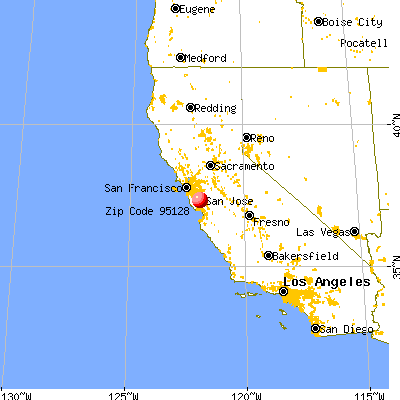
Land area: 3.9 sq. mi. Water area: 0.0 sq. mi.
Population density: 8,548 people per square mile
(high).
OSM Map
General Map
Google Map
MSN Map
OSM Map
General Map
Google Map
MSN Map
OSM Map
General Map
Google Map
MSN Map
OSM Map
General Map
Google Map
MSN Map
Please wait while loading the map...
Real estate property taxes paid for housing units in 2022:
This zip code:
0.6% ($8,148)
California:
0.7% ($4,831)
Median real estate property taxes paid for housing units with mortgages in 2022: $9,480 (0.7%) Median real estate property taxes paid for housing units with no mortgage in 2022: $4,989 (0.4%)
Averages for the 2020 tax year for zip code 95128, filed in 2021:
Average Adjusted Gross Income (AGI) in 2020: $122,328 (Individual Income Tax Returns)
Here:
$122,328
State:
$95,910
Salary/wage: $115,436 (reported on 84.4% of returns)
Here:
$115,436
State:
$77,331
(% of AGI for various income ranges: 1301.3% for AGIs below $25k, 4240.1% for AGIs $25k-50k, 7796.3% for AGIs $50k-75k, 11546.8% for AGIs $75k-100k, 21566.0% for AGIs $100k-200k, 148034.8% for AGIs over 200k)
Taxable interest for individuals: $1,733 (reported on 38.3% of returns)
This zip code:
$1,733
California:
$2,294
(% of AGI for various income ranges: 25.4% for AGIs below $25k, 21.4% for AGIs $25k-50k, 47.1% for AGIs $50k-75k, 75.3% for AGIs $75k-100k, 143.6% for AGIs $100k-200k, 1007.3% for AGIs over 200k)
Ordinary dividends: $6,163 (reported on 29.2% of returns)
Here:
$6,163
State:
$10,949
(% of AGI for various income ranges: 34.8% for AGIs below $25k, 50.0% for AGIs $25k-50k, 112.9% for AGIs $50k-75k, 208.3% for AGIs $75k-100k, 321.8% for AGIs $100k-200k, 3079.4% for AGIs over 200k)
Net capital gain/loss in AGI: +$27,310 (reported on 29.0% of returns)
Here:
+$27,310
State:
+$49,306
(% of AGI for various income ranges: 16.4% for AGIs below $25k, 48.5% for AGIs $25k-50k, 108.4% for AGIs $50k-75k, 359.1% for AGIs $75k-100k, 607.3% for AGIs $100k-200k, 18490.0% for AGIs over 200k)
Profit/loss from business: +$20,150 (reported on 15.9% of returns)
Here:
+$20,150
State:
+$15,671
(% of AGI for various income ranges: 228.9% for AGIs below $25k, 192.4% for AGIs $25k-50k, 332.5% for AGIs $50k-75k, 416.3% for AGIs $75k-100k, 614.0% for AGIs $100k-200k, 4045.9% for AGIs over 200k)
Taxable individual retirement arrangement distribution: $21,017 (reported on 5.9% of returns)
95128:
$21,017
California:
$23,505
(% of AGI for various income ranges: 40.8% for AGIs below $25k, 81.4% for AGIs $25k-50k, 178.1% for AGIs $50k-75k, 234.1% for AGIs $75k-100k, 379.8% for AGIs $100k-200k, 1119.5% for AGIs over 200k)
Self-employed (Keogh) retirement plans: $23,681 (reported on 1.0% of returns)
95128:
$23,681
California:
$30,163
(% of AGI for various income ranges: 18.5% for AGIs $50k-75k, 51.4% for AGIs $100k-200k, 424.3% for AGIs over 200k)
Total itemized deductions: $34,297 (reported on 17.8% of returns)
Here:
$34,297
State:
$39,517
(% of AGI for various income ranges: 139.3% for AGIs below $25k, 153.9% for AGIs $25k-50k, 480.3% for AGIs $50k-75k, 881.0% for AGIs $75k-100k, 1662.1% for AGIs $100k-200k, 8469.8% for AGIs over 200k)
Charity contributions: $6,533 (reported on 13.9% of returns)
Here:
$6,533
State:
$12,598
(% of AGI for various income ranges: 3.9% for AGIs below $25k, 15.1% for AGIs $25k-50k, 34.9% for AGIs $50k-75k, 71.8% for AGIs $75k-100k, 209.4% for AGIs $100k-200k, 1621.7% for AGIs over 200k)
Taxes paid: $9,203 (reported on 17.8% of returns)
95128:
$9,203
State:
$8,807
(% of AGI for various income ranges: 29.7% for AGIs below $25k, 34.2% for AGIs $25k-50k, 123.5% for AGIs $50k-75k, 247.8% for AGIs $75k-100k, 508.7% for AGIs $100k-200k, 2160.0% for AGIs over 200k)
Earned income credit: $1,650 (reported on 7.8% of returns)
Here:
$1,650
State:
$2,074
(% of AGI for various income ranges: 62.2% for AGIs below $25k, 36.8% for AGIs $25k-50k)
Percentage of individuals using paid preparers for their 2020 taxes: 92.1%
Here:
92%
State:
92%
(% for various income ranges: 88.1% for AGIs below $25k, 91.9% for AGIs $25k-50k, 93.1% for AGIs $50k-75k, 93.7% for AGIs $75k-100k, 93.4% for AGIs $100k-200k, 94.5% for AGIs over 200k)
Averages for the 2012 tax year for zip code 95128, filed in 2013:
Average Adjusted Gross Income (AGI) in 2012: $76,872 (Individual Income Tax Returns)
Here:
$76,872
State:
$72,726
Salary/wage: $71,649 (reported on 85.7% of returns)
Here:
$71,649
State:
$59,079
(% of AGI for various income ranges: 76.6% for AGIs below $25k, 85.4% for AGIs $25k-50k, 81.6% for AGIs $50k-75k, 80.6% for AGIs $75k-100k, 84.6% for AGIs $100k-200k, 73.3% for AGIs over 200k)
Taxable interest for individuals: $1,318 (reported on 36.1% of returns)
This zip code:
$1,318
California:
$2,146
(% of AGI for various income ranges: 0.9% for AGIs below $25k, 0.4% for AGIs $25k-50k, 0.5% for AGIs $50k-75k, 0.6% for AGIs $75k-100k, 0.5% for AGIs $100k-200k, 0.8% for AGIs over 200k)
Ordinary dividends: $5,051 (reported on 22.1% of returns)
Here:
$5,051
State:
$9,308
(% of AGI for various income ranges: 1.3% for AGIs below $25k, 0.8% for AGIs $25k-50k, 1.0% for AGIs $50k-75k, 1.2% for AGIs $75k-100k, 1.1% for AGIs $100k-200k, 2.2% for AGIs over 200k)
Net capital gain/loss in AGI: +$17,058 (reported on 20.7% of returns)
Here:
+$17,058
State:
+$30,460
(% of AGI for various income ranges: 0.2% for AGIs $25k-50k, 0.4% for AGIs $50k-75k, 0.7% for AGIs $75k-100k, 1.0% for AGIs $100k-200k, 12.7% for AGIs over 200k)
Profit/loss from business: +$20,674 (reported on 14.8% of returns)
Here:
+$20,674
State:
+$17,064
(% of AGI for various income ranges: 10.2% for AGIs below $25k, 4.2% for AGIs $25k-50k, 3.8% for AGIs $50k-75k, 4.5% for AGIs $75k-100k, 3.6% for AGIs $100k-200k, 3.2% for AGIs over 200k)
Taxable individual retirement arrangement distribution: $15,106 (reported on 6.6% of returns)
95128:
$15,106
California:
$19,557
(% of AGI for various income ranges: 2.0% for AGIs below $25k, 1.5% for AGIs $25k-50k, 2.0% for AGIs $50k-75k, 1.8% for AGIs $75k-100k, 1.3% for AGIs $100k-200k, 0.8% for AGIs over 200k)
Self-employment retirement plans: $18,994 (reported on 1.1% of returns)
95128:
$18,994
California:
$24,530
(% of AGI for various income ranges: 0.3% for AGIs $50k-75k, 0.3% for AGIs $75k-100k, 0.3% for AGIs $100k-200k, 0.4% for AGIs over 200k)
Total itemized deductions: $30,498 (20% of AGI, reported on 36.0% of returns)
Here:
$30,498
State:
$34,004
Here:
20.2% of AGI
State:
22.7% of AGI
(% of AGI for various income ranges: 8.9% for AGIs below $25k, 7.4% for AGIs $25k-50k, 11.8% for AGIs $50k-75k, 15.3% for AGIs $75k-100k, 17.8% for AGIs $100k-200k, 14.8% for AGIs over 200k)
Charity contributions: $2,915 (reported on 28.2% of returns)
Here:
$2,915
State:
$4,659
(% of AGI for various income ranges: 0.4% for AGIs below $25k, 0.5% for AGIs $25k-50k, 1.0% for AGIs $50k-75k, 1.3% for AGIs $75k-100k, 1.4% for AGIs $100k-200k, 1.0% for AGIs over 200k)
Taxes paid: $14,387 (reported on 35.9% of returns)
95128:
$14,387
State:
$14,448
(% of AGI for various income ranges: 1.7% for AGIs below $25k, 1.8% for AGIs $25k-50k, 3.6% for AGIs $50k-75k, 5.9% for AGIs $75k-100k, 8.2% for AGIs $100k-200k, 9.1% for AGIs over 200k)
Earned income credit: $1,760 (reported on 11.2% of returns)
Here:
$1,760
State:
$2,286
(% of AGI for various income ranges: 3.6% for AGIs below $25k, 0.6% for AGIs $25k-50k)
Percentage of individuals using paid preparers for their 2012 taxes: 58.7%
Here:
59%
State:
64%
(% for various income ranges: 58.0% for AGIs below $25k, 59.5% for AGIs $25k-50k, 57.8% for AGIs $50k-75k, 58.0% for AGIs $75k-100k, 58.1% for AGIs $100k-200k, 62.5% for AGIs over 200k)
Averages for the 2004 tax year for zip code 95128, filed in 2005:
Average Adjusted Gross Income (AGI) in 2004: $57,221 (Individual Income Tax Returns)
Here:
$57,221
State:
$58,600
Salary/wage: $54,135 (reported on 84.9% of returns)
Here:
$54,135
State:
$49,455
(% of AGI for various income ranges: 129.2% for AGIs below $10k, 76.9% for AGIs $10k-25k, 85.9% for AGIs $25k-50k, 83.2% for AGIs $50k-75k, 84.1% for AGIs $75k-100k, 76.2% for AGIs over 100k)
Taxable interest for individuals: $2,013 (reported on 45.0% of returns)
This zip code:
$2,013
California:
$2,365
(% of AGI for various income ranges: 7.6% for AGIs below $10k, 1.8% for AGIs $10k-25k, 1.2% for AGIs $25k-50k, 1.2% for AGIs $50k-75k, 1.0% for AGIs $75k-100k, 1.9% for AGIs over 100k)
Taxable dividends: $2,676 (reported on 24.3% of returns)
Here:
$2,676
State:
$4,746
(% of AGI for various income ranges: 5.7% for AGIs below $10k, 1.5% for AGIs $10k-25k, 0.8% for AGIs $25k-50k, 0.9% for AGIs $50k-75k, 0.8% for AGIs $75k-100k, 1.3% for AGIs over 100k)
Net capital gain/loss: +$9,850 (reported on 23.4% of returns)
Here:
+$9,850
State:
+$23,418
(% of AGI for various income ranges: -5.3% for AGIs below $10k, -0.1% for AGIs $10k-25k, 0.1% for AGIs $25k-50k, 0.5% for AGIs $50k-75k, 1.0% for AGIs $75k-100k, 8.0% for AGIs over 100k)
Profit/loss from business: +$19,075 (reported on 14.2% of returns)
Here:
+$19,075
State:
+$16,826
(% of AGI for various income ranges: 8.8% for AGIs below $10k, 6.9% for AGIs $10k-25k, 3.8% for AGIs $25k-50k, 3.4% for AGIs $50k-75k, 4.6% for AGIs $75k-100k, 5.1% for AGIs over 100k)
IRA payment deduction: $2,940 (reported on 2.7% of returns)
95128:
$2,940
California:
$3,192
(% of AGI for various income ranges: 0.3% for AGIs below $10k, 0.1% for AGIs $10k-25k, 0.2% for AGIs $25k-50k, 0.2% for AGIs $50k-75k, 0.2% for AGIs $75k-100k, 0.1% for AGIs over 100k)
Self-employed pension: $12,353 (reported on 1.5% of returns)
Here:
$12,353
California:
$17,688
(% of AGI for various income ranges: 0.1% for AGIs $10k-25k, 0.1% for AGIs $25k-50k, 0.2% for AGIs $50k-75k, 0.3% for AGIs $75k-100k, 0.5% for AGIs over 100k)
Total itemized deductions: $25,428 (25% of AGI, reported on 37.1% of returns)
Here:
$25,428
State:
$28,113
Here:
24.6% of AGI
State:
25.3% of AGI
(% of AGI for various income ranges: 32.6% for AGIs below $10k, 10.9% for AGIs $10k-25k, 10.8% for AGIs $25k-50k, 15.6% for AGIs $50k-75k, 19.6% for AGIs $75k-100k, 18.4% for AGIs over 100k)
Charity contributions deductions: $2,769 (3% of AGI, reported on 31.8% of returns)
Here:
$2,769
State:
$3,923
Here:
2.6% of AGI
State:
3.3% of AGI
(% of AGI for various income ranges: 1.2% for AGIs below $10k, 0.8% for AGIs $10k-25k, 1.0% for AGIs $25k-50k, 1.5% for AGIs $50k-75k, 1.7% for AGIs $75k-100k, 1.8% for AGIs over 100k)
Total tax: $9,290 (reported on 79.2% of returns)
95128:
$9,290
State:
$10,761
(% of AGI for various income ranges: 5.1% for AGIs below $10k, 4.4% for AGIs $10k-25k, 7.7% for AGIs $25k-50k, 10.6% for AGIs $50k-75k, 11.7% for AGIs $75k-100k, 16.9% for AGIs over 100k)
Earned income credit: $1,424 (reported on 9.5% of returns)
Here:
$1,424
State:
$1,763
Percentage of individuals using paid preparers for their 2004 taxes: 60.7%
Here:
61%
State:
66%
(% for various income ranges: 52.2% for AGIs below $10k, 64.4% for AGIs $10k-25k, 62.3% for AGIs $25k-50k, 59.9% for AGIs $50k-75k, 60.9% for AGIs $75k-100k, 61.5% for AGIs over 100k)
Likely homosexual households (counted as self-reported same-sex unmarried-partner households)
Lesbian couples: 0.4% of all households
Gay men: 0.6% of all households
Household received Food Stamps/SNAP in the past 12 months: 646 Household did not receive Food Stamps/SNAP in the past 12 months: 13,140
Women who had a birth in the past 12 months: 354 (290 now married, 63 unmarried) Women who did not have a birth in the past 12 months: 8,056 (3,427 now married, 4,619 unmarried)
Housing units in zip code 95128 with a mortgage: 4,377 (542 second mortgage, 18 home equity loan, 512 both second mortgage and home equity loan) Houses without a mortgage: 15
Median monthly owner costs for units with a mortgage: $3,655 Median monthly owner costs for units without a mortgage: $794
Residents with income below the poverty level in 2022:
This zip code:
8.8%
Whole state:
12.2%
Residents with income below 50% of the poverty level in 2022:
This zip code:
3.9%
Whole state:
6.2%
Median number of rooms in houses and condos:
Here:
5.7
State:
6.0
Median number of rooms in apartments:
Here:
3.4
State:
3.9
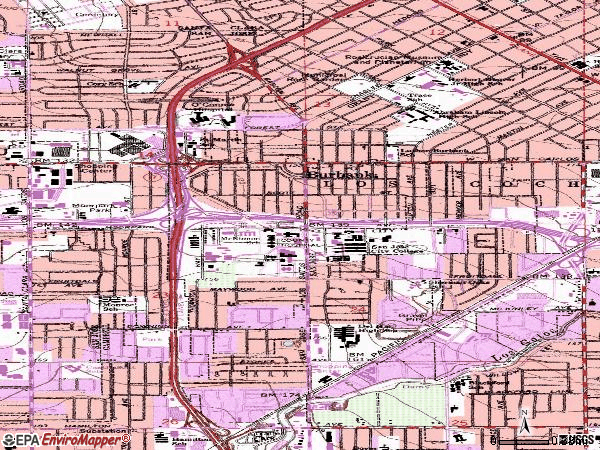
Notable locations in this zip code not listed on our city pages
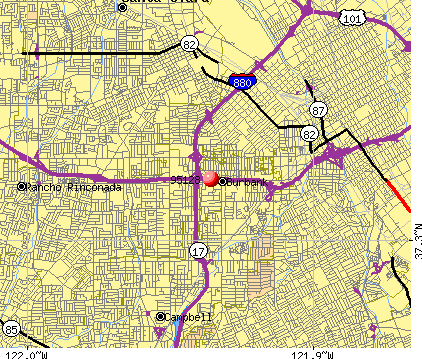
Notable locations in zip code 95128: O'Conner Hospital Library (A), San Jose Fire Department Station 10 (B), San Jose Fire Department Station 4 (C). Display/hide their locations on the map
Churches in zip code 95128 include: Crossroads Bible Church (A), Friendship Agape Chinese Church (B), Immanuel Evangelical Lutheran Church (C), Korean United Methodist Church (D), Apostolic Faith Assembly of God Church (E), Calstar Christian Church (F), Center for Spiritual Enlightenment (G), Creative Mind Science Church (H), Hyang Min Presbyterian Church (I). Display/hide their locations on the map
3,816 married couples with children.
1,416 single-parent households (412 men, 1,004 women).
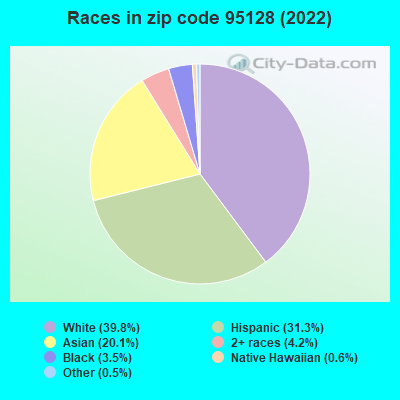
55.4% of residents of 95128 zip code speak English at home.
21.3% of residents speak Spanish at home (66% very well, 11% well, 17% not well, 6% not at all).
8.3% of residents speak other Indo-European language at home (72% very well, 17% well, 9% not well, 2% not at all).
13.1% of residents speak Asian or Pacific Island language at home (53% very well, 27% well, 18% not well, 3% not at all).
1.8% of residents speak other language at home (74% very well, 20% well, 4% not well, 2% not at all).
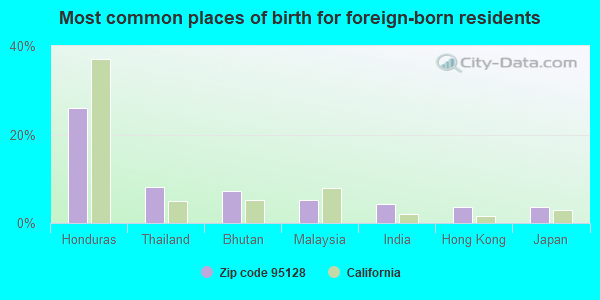
Foreign born population: 10,689 (32.0%) (49.1% of them are naturalized citizens)
Facilities with environmental interests located in this zip code:
CHEVRON STATION NO 96027 (1301 S WINCHESTER BLVD in SAN JOSE, CA)
STATE MASTER (California - Hazardous Waste Tracking) - HAZARDOU WASTE PROGRAM HAZARDOUS WASTE BIENNIAL REPORTER (Resource Conservation and Recovery Act (tracking hazardous waste)) Large Quantity Generators, more that 1000 kg of hazardous waste/month (Resource Conservation and Recovery Act (tracking hazardous waste)) Small Quantity Generators, between 100 kg and 1000 kg of hazardous waste/month (Resource Conservation and Recovery Act (tracking hazardous waste)) - notification Organizations: CHEVRON PRODUCTS CO (CONTACT/OWNER)
Alternative names: CHEVRON NO 96027
FASHION EXPRESS (1375 S BASCOM AVE in SAN JOSE, CA)
STATE MASTER (California - Hazardous Waste Tracking) - HAZARDOU WASTE PROGRAM CRITERIA AND HAZARDOUS AIR POLLUTANT INVENTORY (Inventory of air pollution sources) Small Quantity Generators, between 100 kg and 1000 kg of hazardous waste/month (Resource Conservation and Recovery Act (tracking hazardous waste)) - notification Business SIC classification: DRYCLEANING PLANTS, EXCEPT RUG CLEANING Organizations: FASHION EXPRESS INC (CONTACT/OWNER)
Alternative names: FASHION EXPRESS CLEANERS
LUTHER BURBANK ELEMENTARY (4 WABASH AVE. in SAN JOSE, CA)
(National Center for Education Statistics) - STATE ID-6047575
MIDDLE COLLEGE HIGH (2101 MOORPARK AVE. in SAN JOSE, CA)
(National Center for Education Statistics) - STATE ID-4330593 Organizations: SAN JOSE UNIFIED (SCHOOL DISTRICT)
MONROE MIDDLE (1055 S. MONROE ST. in SAN JOSE, CA)
(National Center for Education Statistics) - STATE ID-6046627 Organizations: CAMPBELL UNION ELEMENTARY (SCHOOL DISTRICT)
EQUILON ENTERPRISES LLC/SHELL STATION (610 S. BASCOM in SAN JOSE, CA)
HAZARDOUS WASTE BIENNIAL REPORTER (Resource Conservation and Recovery Act (tracking hazardous waste)) (Resource Conservation and Recovery Act (tracking hazardous waste))
ACC U TUNE & BRAKE (498 N WINCHESTER BLVD in SAN JOSE, CA)
Small Quantity Generators, between 100 kg and 1000 kg of hazardous waste/month (Resource Conservation and Recovery Act (tracking hazardous waste)) - notification Organizations: CARTER HAWLEY & HALE P A (CONTACT/OWNER)
EXXON SERVICE STATION NO 7-3667 (425 S. WINCHESTER/OLIN in SAN JOSE, CA)
Small Quantity Generators, between 100 kg and 1000 kg of hazardous waste/month (Resource Conservation and Recovery Act (tracking hazardous waste)) - notification Organizations: EXXON CO USA (CONTACT/OWNER)
MAKE A FRAME (1244 S BASCOM AVE in SAN JOSE, CA)
Small Quantity Generators, between 100 kg and 1000 kg of hazardous waste/month (Resource Conservation and Recovery Act (tracking hazardous waste)) - notification Organizations: GALE ENSIGN (CONTACT/OWNER)
AMBER REALTY AND PROPERTY (3033 MOORPARK AVE, NO.2 in SAN JOSE, CA)
COMPLIANCE ACTIVITY (Tracking inspections of insecticide, fungicide, and rodenticide, and toxic substances)
JOHN COLENDICH AUTOMOTIVE C/O (590 W HEDDING STREET in SAN JOSE, CA)
CRITERIA AND HAZARDOUS AIR POLLUTANT INVENTORY (Inventory of air pollution sources) Business SIC classification: MOTOR VEHICLE DEALERS (NEW AND USED)
Housing units lacking complete plumbing facilities: 0.7% Housing units lacking complete kitchen facilities: 1.3%
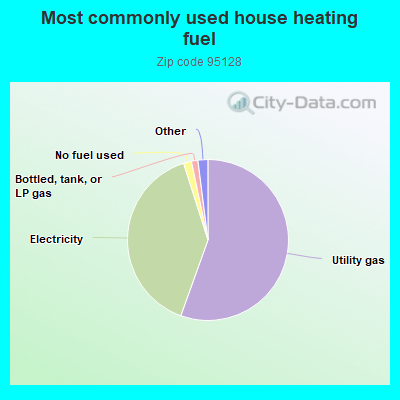
55.5%Utility gas
39.6%Electricity
1.6%No fuel used
1.3%Bottled, tank, or LP gas
0.9%Wood
0.8%Solar energy
Population in 1990: 28,275. Population change in the 1990s: +4,524 (+16.0%).
Place of birth for U.S.-born residents:
This state: 17,477
Northeast: 1,418
Midwest: 1,239
South: 1,143
West: 936
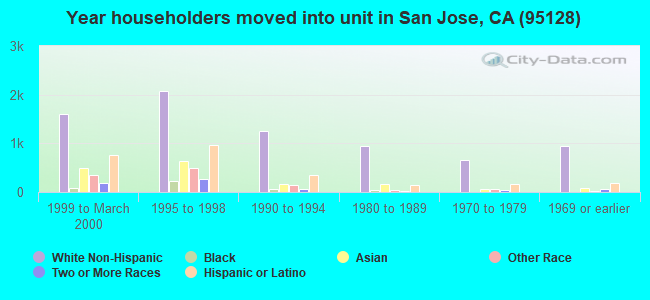
51% of the 95128 zip code residents lived in the same house 5 years ago. Out of people who lived in different houses, 72% lived in this county. Out of people who lived in different counties, 50% lived in California.
85% of the 95128 zip code residents lived in the same house 1 year ago. Out of people who lived in different houses, 57% moved from this county. Out of people who lived in different houses, 23% moved from different county within same state. Out of people who lived in different houses, 14% moved from different state. Out of people who lived in different houses, 5% moved from abroad.
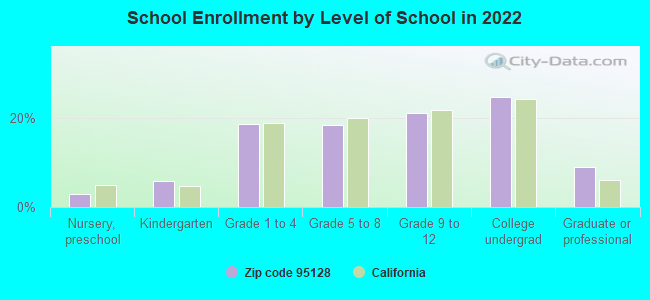
Private vs. public school enrollment:
Students in private schools in grades 1 to 8 (elementary and middle school): 614
Here:
23.9%
California:
10.5%
Students in private schools in grades 9 to 12 (high school): 301
Here:
20.8%
California:
8.5%
Students in private undergraduate colleges: 189
Here:
11.3%
California:
15.9%
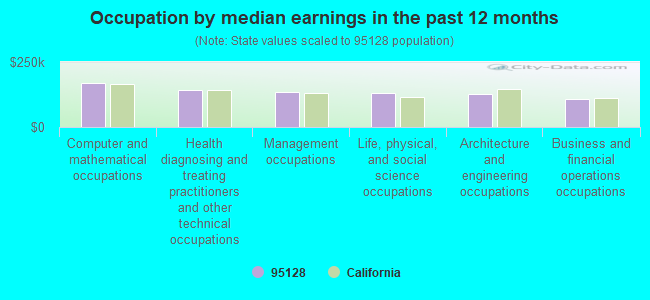
Occupation by median earnings in the past 12 months ($)
169,785Computer and mathematical occupations
142,421Health diagnosing and treating practitioners and other technical occupations
133,894Management occupations
129,952Life, physical, and social science occupations
125,754Architecture and engineering occupations
107,708Business and financial operations occupations
Companies with federal contracts located in this zip code (SAN JOSE, CA):
MULTIGEN-PARADIGM INC (550 S WINCHESTER BLVD; small business) : $3,470,311 in 102 contractsfrom 2000 to 2006
Contracts for Defense Electronics and Communication Equipment -- Applied Research and Exploratory Development (R&D), ADP Software, ADP Support Equipment, ADPE System Configuration, and moreby Navy, Army, Federal Technology Service, Air Force, and others Signed by year:2000: $787,532; 2001: $811,648; 2002: $166,613; 2003: $772,913; 2004: $617,532; 2005: $275,993; 2006: $38,080.
Biggest contracts:
$375,000 with Navy for Defense Electronics and Communication Equipment -- Applied Research and Exploratory Development (R&D). Signed on 2000-02-03. Completion date: 2001-05-31.
$333,497 with Army for ADP Software. Taking place in AL. Signed on 2003-05-28. Completion date: 2004-05-31.
$225,000 with Navy for Defense Electronics and Communication Equipment -- Applied Research and Exploratory Development (R&D). Signed on 2001-01-29. Completion date: 2001-07-29.
$150,000, same as above.Signed on 2001-04-16. Completion date: 2001-10-15.
OPTHUS (560 S WINCHESTER BLVD SU; small business) : $849,343 in 3 contractsfrom 2003 to 2005
$384,295 with Army for Other Research and Development -- Basic Research (R&D). Signed on 2004-08-28. Completion date: 2005-08-29.
$365,050, same as above.Signed on 2005-07-27. Completion date: 2006-08-29.
$99,998, same as above.Signed on 2003-07-31. Completion date: 2004-01-31.
4D INCORPORATED (3031 TISCH WAY STE 900; small business) 30 employees, $10000000 revenue. : $230,754 in 12 contractsfrom 2001 to 2006
Contracts for ADP Software, Other ADP and Telecommunications Services (includes data storage on tapes, compact disks, etc.), ADP Systems Development Services, Automated Information System Design and Integration Services, and moreby National Institutes of Health, NASA, Army Signed by year:2000: $0; 2001: $65,000; 2002: $34,616; 2003: $30,000; 2004: $41,138; 2005: $30,000; 2006: $30,000.
Biggest contracts:
$35,000 with National Institutes of Health for ADP Software. Taking place in MD. Signed on 2001-09-15. Completion date: 2001-09-15.
$30,000 with NASA for Other ADP and Telecommunications Services (includes data storage on tapes, compact disks, etc.). Signed on 2006-09-30. Effective on 2007-01-01. Completion date: 2007-12-31.
$30,000 with NASA for ADP Systems Development Services. Signed on 2005-12-06. Completion date: 2006-12-31.
$30,000 with NASA for Automated Information System Design and Integration Services. Signed on 2004-11-26. Completion date: 2005-12-31.
SOFTWARE SYSTEMS QUALITY CONSU (2269 SUNNY VISTA DRIVE; small business) : $91,202 in 2 contractsin 2004
$134,684 with Navy for ADP Systems Analysis Services. Signed on 2004-03-30. Completion date: 2004-06-12.
-$43,482, same as above.Signed on 2004-09-28. Completion date: 2004-06-12.
AHERN, BRIAN (2279 WALNUT GROVE AVE; small business)
$35,553 with Air Force for Miscellaneous Chemical Specialties. Taking place in AK. Signed on 2000-09-27. Completion date: 2000-10-31.
TURN-KEY OPERATIONS, INCORPORA (1101 SOUTH WINCHESTER BLVD; small business) : $32,875 in 3 contractsfrom 2003 to 2006
$19,808 with Navy for Video Recording and Reproducing Equipment. Signed on 2005-09-29. Completion date: 2005-12-15.
$7,997 with Air Force for Video Recording and Reproducing Equipment. Signed on 2006-02-02. Completion date: 2006-03-02.
$5,070 with Army for ADP Support Equipment. Signed on 2003-10-08. Completion date: 2003-10-24.
WORLD RESEARCH, INC (1245 S WINCHESTER BLVD , S; small business)
$24,950 with Navy for Market Research and Public Opinion Services (includes telephone and field interviews, focus testing, and surveys). Signed on 2005-06-22. Completion date: 2005-09-30.
MENTORNET (1275 S WINCHESTER BLVD ,) : $15,000 in 2 contractsfrom 2003 to 2005
$10,000 with Navy for Other Defense -- Applied Research and Exploratory Development (R&D). Signed on 2005-11-10. Completion date: 2006-11-13.
$5,000 with NASA for . Signed on 2003-07-25. Effective on 2003-08-01. Completion date: 2003-07-31.
oempcworld.com (1101 SOUTH WINCHESTER; small business)
$7,877 with Bureau of Prisoners/Federal Prison System for Mini and Micro Computer Control Devices. Taking place in NJ. Signed on 2005-07-29. Completion date: 2005-08-31.
AMERICAN CINEMA INC (3033 MOORPARK AVE, SUITE 2; small business) : -$2,880 in 4 contractsin 2004
$0 with Army for Public Relations Services(includes writing services, event planning and management, media relations, radio and television analysis, and press services). Taking place in NM. Signed on 2004-09-20. Completion date: 2004-09-21.
$0 with U.S. Army Corps of Engineers - civil program financing only for Public Relations Services(includes writing services, event planning and management, media relations, radio and television analysis, and press services). Taking place in NM. Signed on 2004-09-20. Completion date: 2004-09-21.
-$1,440 with Army for Public Relations Services(includes writing services, event planning and management, media relations, radio and television analysis, and press services). Taking place in NM. Signed on 2004-09-20. Completion date: 2004-09-21.
-$1,440 with U.S. Army Corps of Engineers - civil program financing only for Public Relations Services(includes writing services, event planning and management, media relations, radio and television analysis, and press services). Taking place in NM. Signed on 2004-09-20. Completion date: 2004-09-21.
Top industries in this zip code by the number of employees in 2005:
Health Care and Social Assistance: General Medical and Surgical Hospitals (over 1000 employees: 2 establishments)
Administrative and Support and Waste Management and Remediation Services: Temporary Help Services (500-999: 1, 100-249: 3, 50-99: 2, 20-49: 2, 10-19: 1, 5-9: 1, 1-4: 4)
2006 - 2017 National Fire Incident Reporting System (NFIRS) incidents
According to the data from the years 2006 - 2017 the average number of fire incidents per year is 39. The highest number of fire incidents - 121 took place in 2017, and the least - 0 in 2014. The data has a growing trend.
When looking into fire subcategories, the most incidents belonged to: Outside Fires (49.4%), and Structure Fires (29.1%).
Fire incident types reported to NFIRS in Zip Code 95128


 Nearest zip codes: 95126, 95117, 95053, 95050, 95110, 95008.


 According to the data from the years 2006 - 2017 the average number of fire incidents per year is 39. The highest number of fire incidents - 121 took place in 2017, and the least - 0 in 2014. The data has a growing trend.
 When looking into fire subcategories, the most incidents belonged to: Outside Fires (49.4%), and Structure Fires (29.1%).