Buena Vista neighborhood in San Jose, California (CA), 95126, 95128 detailed profile
Settings
X


Business Search - 14 Million verified businesses
Area: 0.096 square miles
Population: 1,660
Population density:
| Buena Vista: | 17,308 people per square mile |
| San Jose: | 5,554 people per square mile |

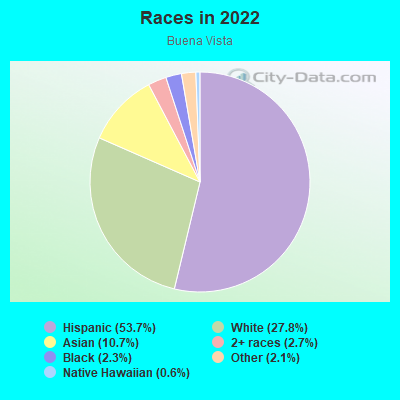
- 91253.7%Hispanic or Latino
- 47127.8%White
- 18210.7%Asian
- 462.7%Two or more races
- 392.3%Black
- 362.1%Some other race
- 110.6%Native Hawaiian and Other
Pacific Islander
Median household income in 2022:
| Buena Vista: | $112,475 |
| San Jose: | $133,835 |
Distribution of median household income
![Distribution of median household income]()
- 21Less than $10,000
- 49$10,000 to $19,999
- 20$20,000 to $29,999
- 68$30,000 to $39,999
- 48$40,000 to $49,999
- 20$50,000 to $59,999
- 44$60,000 to $74,999
- 98$75,000 to $99,999
- 73$100,000 to $124,999
- 43$125,000 to $149,999
- 18$150,000 to $199,999
- 146$200,000 or more

Distribution of owner-occupied house/condo value
![Distribution of owner-occupied house/condo value]()
- 7Less than $50,000
- 26$50,000 to $99,999
- 3$100,000 to $149,999
- 3$250,000 to $299,999
- 2$300,000 to $399,999
- 53$400,000 to $499,999
- 12$500,000 to $749,999
- 27$750,000 to $999,999
- 156$1,000,000 or more

Distribution of rent paid by renters
![Distribution of rent paid by renters]()
- 31$100 to $199
- 40$200 to $299
- 2$300 to $399
- 8$600 to $699
- 19$800 to $899
- 25$1,000 to $1,249
- 27$1,250 to $1,499
- 106$1,500 to $1,999
- 230$2,000 or more

Median rent in 2022:
| Buena Vista: | $1,999 |
| San Jose: | $2,001 |
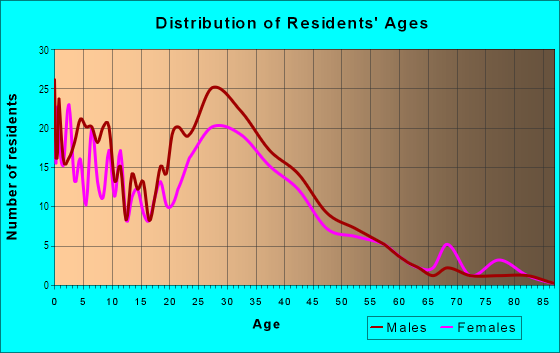
| Males: | 886 |
| Females: | 773 |
Males:
| This neighborhood: | 34.1 years |
| Whole city: | 37.6 years |
| This neighborhood: | 34.1 years |
| Whole city: | 39.1 years |
Average household size:
| Buena Vista: | 2.8 people |
| San Jose: | 2.9 people |
Percentage of family households:
| Buena Vista: | 63.0% |
| San Jose: | 49.9% |
| Here: | 49.9% |
| San Jose: | 53.0% |
Percentage of married-couple families with children (among all households):
| Buena Vista: | 26.2% |
| San Jose: | 25.8% |
Percentage of single-mother households (among all households):
| Buena Vista: | 7.9% |
| San Jose: | 5.2% |
Percentage of never married males 15 years old and over:
Percentage of never married females 15 years old and over:
| Buena Vista: | 24.9% |
| San Jose: | 20.9% |
Percentage of never married females 15 years old and over:
| Buena Vista: | 19.4% |
| city: | 16.7% |
Percentage of people that speak English not well or not at all:
| Buena Vista: | 13.0% |
| San Jose: | 11.4% |
Percentage of people born in this state:
Percentage of people born in another U.S. state:
Percentage of native residents but born outside the U.S.:
Percentage of foreign born residents:
| Here: | 45.8% |
| San Jose: | 46.1% |
Percentage of people born in another U.S. state:
| Buena Vista: | 11.0% |
| San Jose: | 10.4% |
Percentage of native residents but born outside the U.S.:
| Here: | 0.6% |
| city: | 1.7% |
Percentage of foreign born residents:
| Here: | 42.6% |
| San Jose: | 41.8% |
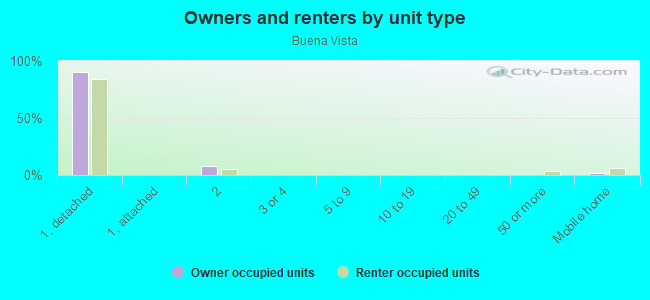
Owner-occupied
Renter-occupied

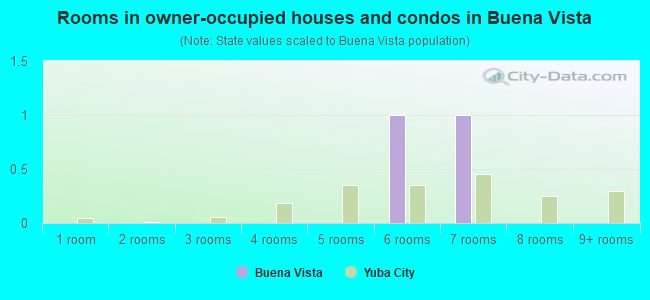
- Rooms in owner-occupied houses and condos in Buena Vista
- 01 room
- 02 rooms
- 203 rooms
- 654 rooms
- 765 rooms
- 636 rooms
- 237 rooms
- 58 rooms
- 239+ rooms
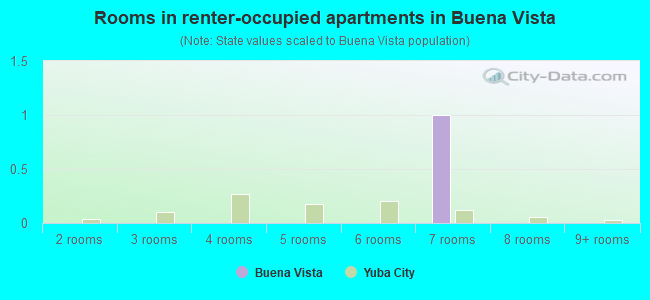
- Rooms in renter-occupied apartments in Buena Vista
- 231 room
- 432 rooms
- 1153 rooms
- 1274 rooms
- 215 rooms
- 386 rooms
- 107 rooms
- 08 rooms
- 219+ rooms
Owner-occupied
Renter-occupied
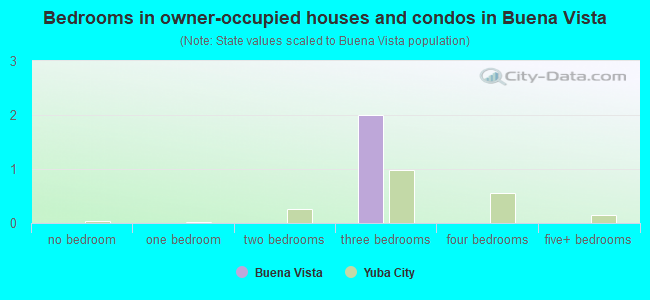
- Bedrooms in owner-occupied houses and condos in Buena Vista
- 0no bedroom
- 211 bedroom
- 1162 bedrooms
- 733 bedrooms
- 44 bedrooms
- 05+ bedrooms

- Bedrooms in renter-occupied apartments in Buena Vista
- 27no bedroom
- 1421 bedroom
- 1532 bedrooms
- 143 bedrooms
- 14 bedrooms
- 215+ bedrooms
Average number of cars or other vehicles available in houses/condos:
Average number of cars or other vehicles available in apartments:
| This neighborhood: | 2.1 |
| San Jose: | 2.3 |
Average number of cars or other vehicles available in apartments:
| Here: | 1.7 |
| city: | 1.6 |
Percentage of units with a mortgage:
| Buena Vista: | 77.1% |
| San Jose: | 66.9% |
Average estimated value of detached houses in 2022 (42.6% of all units):
| Buena Vista: | $1,022,442 |
| San Jose: | $1,532,815 |
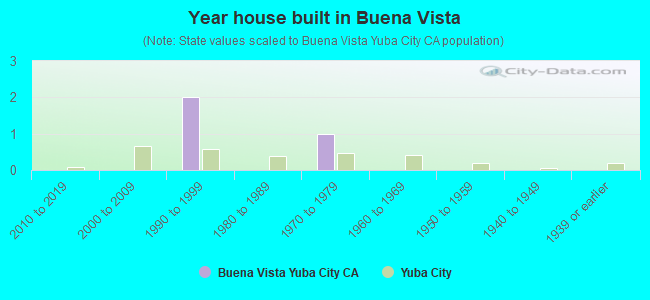
- Year house built in Buena Vista
- 02020 or later
- 462010 to 2019
- 422000 to 2009
- 191990 to 1999
- 541980 to 1989
- 751970 to 1979
- 761960 to 1969
- 1001950 to 1959
- 1091940 to 1949
- 1111939 or earlier
City-data.com crime index for city in 2020 (higher means more crime):
| City: | 268.4 |
| U.S. average: | 219.5 |
Travel time to work (commute)
![Travel time to work (commute)]()
- 6Less than 5 minutes
- 285 to 9 minutes
- 13110 to 14 minutes
- 15315 to 19 minutes
- 21320 to 24 minutes
- 4925 to 29 minutes
- 21430 to 34 minutes
- 1035 to 39 minutes
- 1840 to 44 minutes
- 2945 to 59 minutes
- 3160 to 89 minutes
- 2990 or more minutes

Means of transportation to work
![Means of transportation to work]()
- 64.3%628Drove a car alone
- 18.0%176Carpooled
- 1.5%15Bus
- 0.2%2Long-distance train or commuter rail
- 1.7%17Light rail, streetcar or trolley
- 0.6%6Taxi
- 1.8%18Motorcycle
- 0.9%9Bicycle
- 2.3%22Walked
- 2.1%21Other means
- 12.8%125Worked at home

Time leaving home to go to work
![Time leaving home to go to work]()
- 1012:00 a.m. to 4:59 a.m.
- 575:00 a.m. to 5:29 a.m.
- 525:30 a.m. to 5:59 a.m.
- 1086:00 a.m. to 6:29 a.m.
- 716:30 a.m. to 6:59 a.m.
- 1027:00 a.m. to 7:29 a.m.
- 1167:30 a.m. to 7:59 a.m.
- 1198:00 a.m. to 8:29 a.m.
- 408:30 a.m. to 8:59 a.m.
- 569:00 a.m. to 9:59 a.m.
- 4410:00 a.m. to 10:59 a.m.
- 911:00 a.m. to 11:59 a.m.
- 9612:00 p.m. to 3:59 p.m.
- 454:00 p.m. to 11:59 p.m.

Occupations of males:
- Percentage of males in management occupations (except farmers):
Here: 12.8% city: 13.0%
- Percentage of males in business and financial operations occupations:
Here: 8.5% city: 4.6%
- Percentage of males in computer and mathematical occupations:
Here: 5.8% city: 13.6%
- Percentage of males in architecture and engineering occupations:
Here: 2.1% city: 10.2%
- Percentage of males in life, physical, and social science occupations:
Here: 1.6% city: 1.1%
- Percentage of males in education, training, and library occupations:
Here: 4.7% city: 2.8%
- Percentage of males in service occupations:
Here: 31.6% city: 12.7%
- Percentage of males in sales and office occupations:
Here: 10.3% city: 12.8%
- Percentage of males in construction, extraction, and maintenance occupations:
Here: 8.1% city: 7.8%
- Percentage of males in production occupations:
Here: 3.1% city: 5.5%
- Percentage of males in transportation occupations:
Here: 1.2% city: 3.6%
- Percentage of males in material moving occupations:
Here: 1.3% city: 3.1%
Occupations of females:
- Percentage of females in management occupations (except farmers):
Here: 10.6% city: 11.0%
- Percentage of females in business and financial operations occupations:
Here: 4.2% city: 8.6%
- Percentage of females in computer and mathematical occupations:
Here: 3.1% city: 5.4%
- Percentage of females in architecture and engineering occupations:
Here: 1.9% city: 2.8%
- Percentage of females in life, physical, and social science occupations:
Here: 1.1% city: 1.7%
- Percentage of females in community and social services occupations:
Here: 2.3% city: 1.8%
- Percentage of females in education, training, and library occupations:
Here: 2.0% city: 8.1%
- Percentage of females in arts, design, entertainment, sports, and media occupations:
Here: 3.5% city: 2.0%
- Percentage of females in healthcare practitioners and technical occupations:
Here: 4.3% city: 6.8%
- Percentage of females in service occupations:
Here: 46.5% city: 21.7%
- Percentage of females in sales and office occupations:
Here: 16.8% city: 22.0%
- Percentage of females in production occupations:
Here: 2.4% city: 4.0%
- Percentage of females in material moving occupations:
Here: 1.2% city: 1.5%
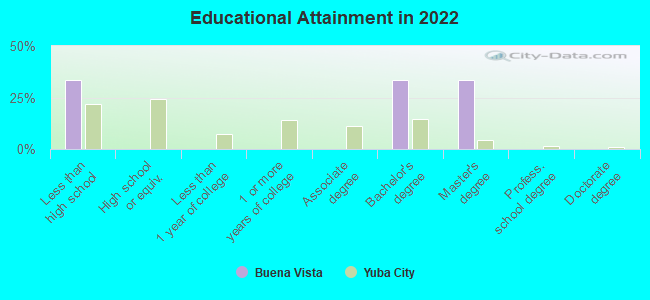
Education in this neighborhood (subdivision or community):
- Percentage of people 3 years and older in K-12 schools:
Buena Vista: 30.3% San Jose: 16.1%
- Percentage of people 3 years and older in undergraduate colleges:
Buena Vista: 3.6% San Jose: 6.5%
- Percentage of people 3 years and older in grad. or professional schools:
Buena Vista: 2.6% San Jose: 2.0%
- Percentage of students K-12 enrolled in private schools:
Buena Vista: 30.8% San Jose: 14.9%
Percentage of population below poverty level:
| Buena Vista: | 8.2% |
| San Jose: | 9.0% |
Median year owner moved in (as recorded in 2022):
Median year renter moved in (as recorded in 2022):
| Buena Vista: | 2010 |
| San Jose: | 2008 |
Median year renter moved in (as recorded in 2022):
| Buena Vista: | 2014 |
| San Jose: | 2020 |
Percentage of married-couple families with both working:
| Buena Vista: | 56.9% |
| San Jose: | 72.5% |
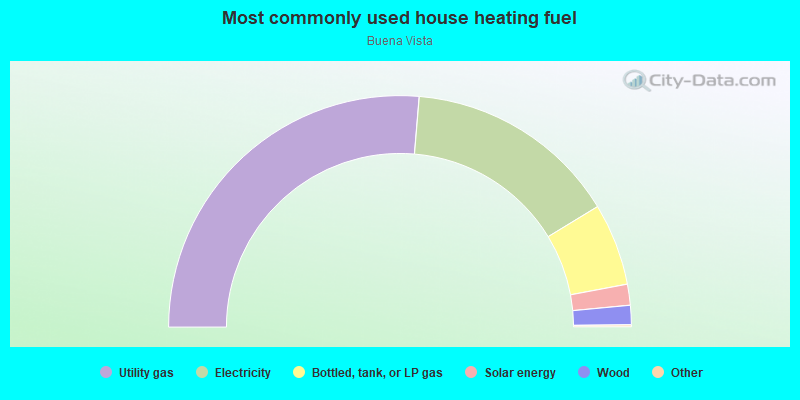
- 48.8%Electricity
- 43.5%Utility gas
- 2.9%No fuel used
- 1.9%Bottled, tank, or LP gas
- 1.9%Wood
- 1.0%Solar energy
Roads and streets:
Scott St
Length: 0.53 miles
Directions: E-W, SW-NE
Address range: 1500 to 1899
Directions: E-W, SW-NE
Address range: 1500 to 1899
Mayellen Ave
Length: 0.11 miles
Direction: N-S
Address range: 500 to 599
Direction: N-S
Address range: 500 to 599
Clifton Ave
Length: 0.10 miles
Direction: N-S
Address range: 500 to 549
Direction: N-S
Address range: 500 to 549
New St
Length: 0.02 miles
Direction: N-S
Direction: N-S
S Willard Ave
Length: 0.01 miles
Direction: N-S
Address range: 490 to 499
Direction: N-S
Address range: 490 to 499