Bascom (Forest) neighborhood in San Jose, California (CA), 95128 detailed profile
Settings
X

Business Search - 14 Million verified businesses
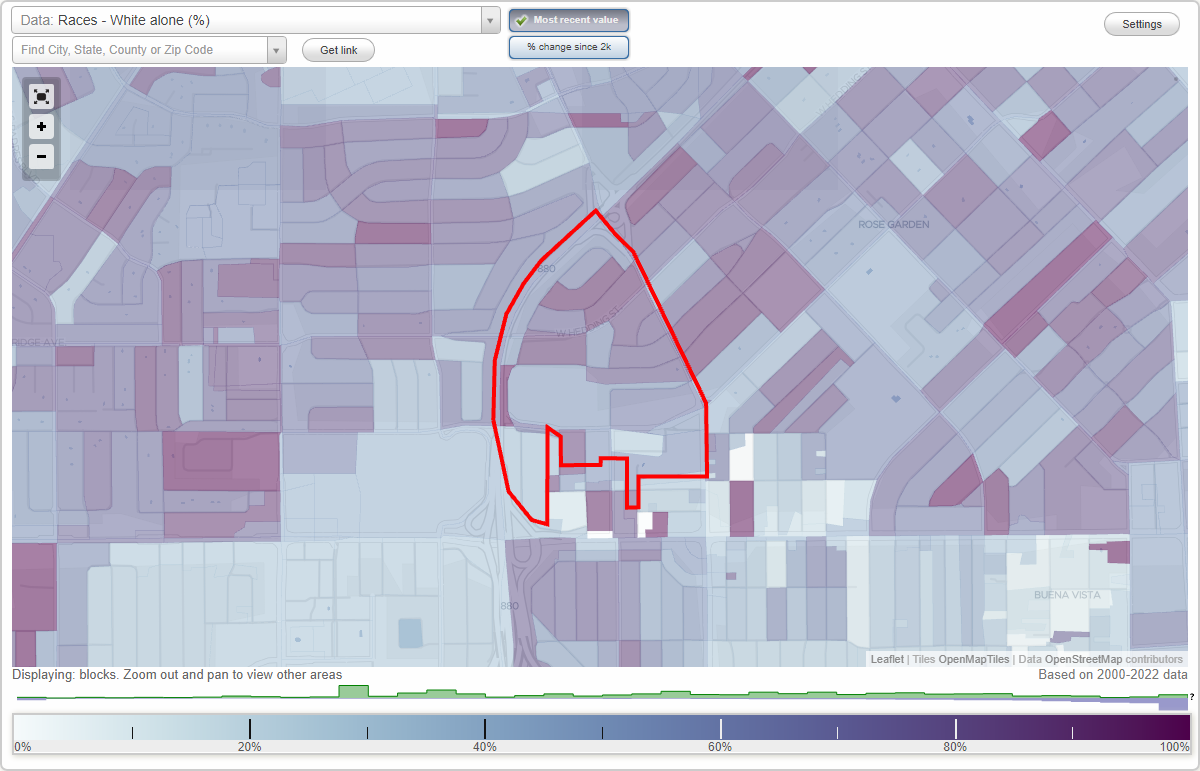
Area: 0.231 square miles
Population: 1,426
Population density:
| Bascom (Forest): | 6,178 people per square mile |
| San Jose: | 5,554 people per square mile |

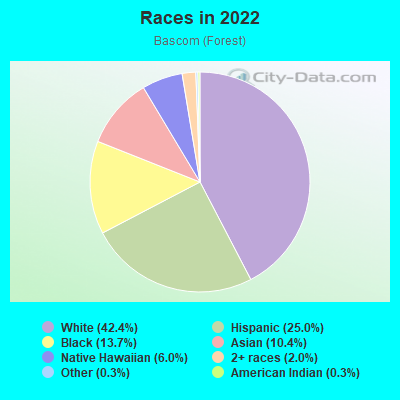
- 67342.4%White
- 39725.0%Hispanic or Latino
- 21813.7%Black
- 16610.4%Asian
- 956.0%Native Hawaiian and Other
Pacific Islander - 312.0%Two or more races
- 40.3%American Indian
- 50.3%Some other race
Median household income in 2022:
| Bascom (Forest): | $144,335 |
| San Jose: | $133,835 |
Distribution of median household income
![Distribution of median household income]()
- 19Less than $10,000
- 51$10,000 to $19,999
- 76$20,000 to $29,999
- 54$30,000 to $39,999
- 16$40,000 to $49,999
- 50$50,000 to $59,999
- 20$60,000 to $74,999
- 166$75,000 to $99,999
- 177$100,000 to $124,999
- 59$125,000 to $149,999
- 51$150,000 to $199,999
- 115$200,000 or more

Distribution of owner-occupied house/condo value
![Distribution of owner-occupied house/condo value]()
- 4Less than $50,000
- 39$100,000 to $149,999
- 5$150,000 to $199,999
- 38$250,000 to $299,999
- 4$300,000 to $399,999
- 4$400,000 to $499,999
- 7$500,000 to $749,999
- 75$750,000 to $999,999
- 350$1,000,000 or more

Distribution of rent paid by renters
![Distribution of rent paid by renters]()
- 15$100 to $199
- 15$300 to $399
- 10$600 to $699
- 175$1,000 to $1,249
- 16$1,250 to $1,499
- 162$1,500 to $1,999
- 210$2,000 or more

Median rent in 2022:
| Bascom (Forest): | $2,148 |
| San Jose: | $2,001 |
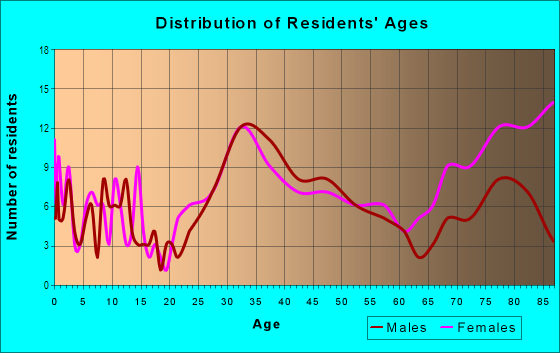
| Males: | 788 |
| Females: | 637 |
Males:
| This neighborhood: | 38.5 years |
| Whole city: | 37.6 years |
| This neighborhood: | 41.8 years |
| Whole city: | 39.1 years |
Average household size:
| Bascom (Forest): | 2.4 people |
| San Jose: | 2.9 people |
Percentage of family households:
| Bascom (Forest): | 20.9% |
| San Jose: | 49.9% |
| Here: | 34.5% |
| San Jose: | 53.0% |
Percentage of married-couple families with children (among all households):
| Bascom (Forest): | 41.2% |
| San Jose: | 25.8% |
Percentage of single-mother households (among all households):
| Bascom (Forest): | 6.4% |
| San Jose: | 5.2% |
Percentage of never married males 15 years old and over:
Percentage of never married females 15 years old and over:
| Bascom (Forest): | 17.6% |
| San Jose: | 20.9% |
Percentage of never married females 15 years old and over:
| Bascom (Forest): | 11.6% |
| city: | 16.7% |
Percentage of people that speak English not well or not at all:
| Bascom (Forest): | 10.3% |
| San Jose: | 11.4% |
Percentage of people born in this state:
Percentage of people born in another U.S. state:
Percentage of native residents but born outside the U.S.:
Percentage of foreign born residents:
| Here: | 52.2% |
| San Jose: | 46.1% |
Percentage of people born in another U.S. state:
| Bascom (Forest): | 16.1% |
| San Jose: | 10.4% |
Percentage of native residents but born outside the U.S.:
| Here: | 2.3% |
| city: | 1.7% |
Percentage of foreign born residents:
| Here: | 29.5% |
| San Jose: | 41.8% |
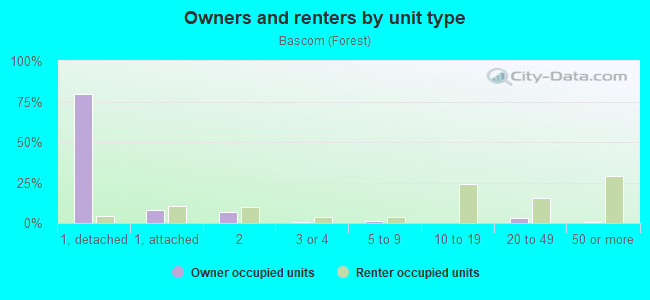
Owner-occupied
Renter-occupied

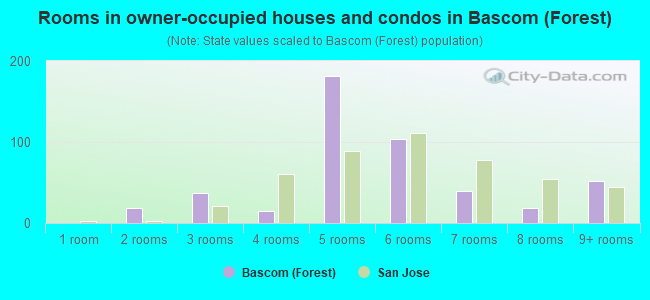
- Rooms in owner-occupied houses and condos in Bascom <
> - 01 room
- 182 rooms
- 373 rooms
- 154 rooms
- 1815 rooms
- 1046 rooms
- 397 rooms
- 188 rooms
- 529+ rooms
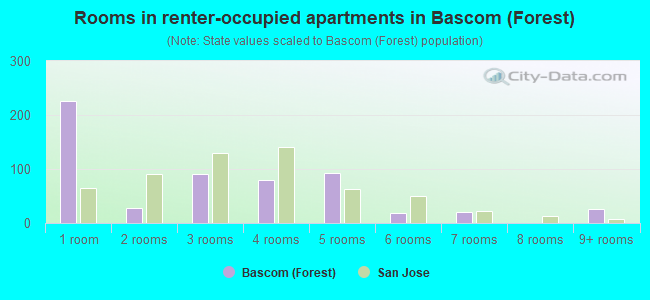
- Rooms in renter-occupied apartments in Bascom <
> - 2251 room
- 272 rooms
- 903 rooms
- 804 rooms
- 925 rooms
- 186 rooms
- 217 rooms
- 08 rooms
- 269+ rooms
Owner-occupied
Renter-occupied
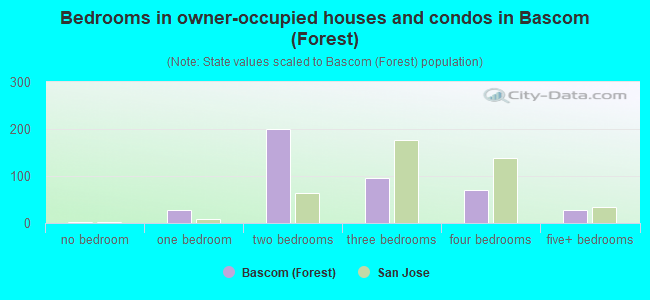
- Bedrooms in owner-occupied houses and condos in Bascom <
> - 2no bedroom
- 281 bedroom
- 2012 bedrooms
- 963 bedrooms
- 704 bedrooms
- 275+ bedrooms
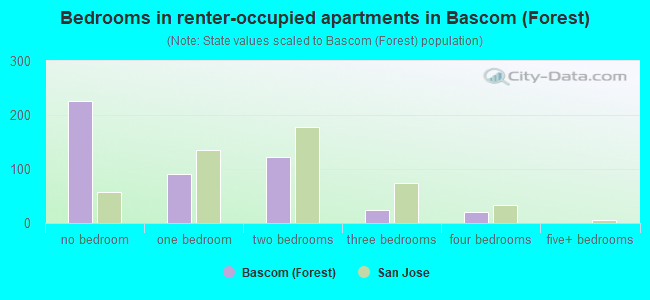
- Bedrooms in renter-occupied apartments in Bascom <
> - 225no bedroom
- 911 bedroom
- 1232 bedrooms
- 243 bedrooms
- 214 bedrooms
- 05+ bedrooms
Average number of cars or other vehicles available in houses/condos:
Average number of cars or other vehicles available in apartments:
| This neighborhood: | 1.4 |
| San Jose: | 2.3 |
Average number of cars or other vehicles available in apartments:
| Here: | 1.5 |
| city: | 1.6 |
Percentage of units with a mortgage:
| Bascom (Forest): | 87.3% |
| San Jose: | 66.9% |
Average estimated value of detached houses in 2022 (58.3% of all units):
| Bascom (Forest): | $1,137,387 |
| San Jose: | $1,532,815 |
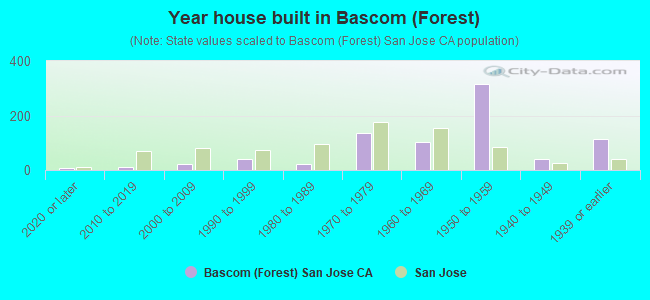
- Year house built in Bascom <
> - 62020 or later
- 122010 to 2019
- 212000 to 2009
- 421990 to 1999
- 221980 to 1989
- 1341970 to 1979
- 1011960 to 1969
- 3161950 to 1959
- 421940 to 1949
- 1131939 or earlier
City-data.com crime index for city in 2020 (higher means more crime):
| City: | 268.4 |
| U.S. average: | 219.5 |
Travel time to work (commute)
![Travel time to work (commute)]()
- 10Less than 5 minutes
- 405 to 9 minutes
- 8010 to 14 minutes
- 9615 to 19 minutes
- 6920 to 24 minutes
- 3825 to 29 minutes
- 6830 to 34 minutes
- 1435 to 39 minutes
- 1440 to 44 minutes
- 7245 to 59 minutes
- 2360 to 89 minutes
- 990 or more minutes

Means of transportation to work
![Means of transportation to work]()
- 49.0%330Drove a car alone
- 8.2%55Carpooled
- 2.5%17Bus
- 2.5%17Subway or elevated rail
- 2.7%18Long-distance train or commuter rail
- 8.5%57Light rail, streetcar or trolley
- 6.1%41Taxi
- 5.3%36Motorcycle
- 1.3%9Bicycle
- 5.2%35Walked
- 0.9%6Other means
- 41.3%278Worked at home

Time leaving home to go to work
![Time leaving home to go to work]()
- 1312:00 a.m. to 4:59 a.m.
- 105:00 a.m. to 5:29 a.m.
- 125:30 a.m. to 5:59 a.m.
- 266:00 a.m. to 6:29 a.m.
- 286:30 a.m. to 6:59 a.m.
- 717:00 a.m. to 7:29 a.m.
- 677:30 a.m. to 7:59 a.m.
- 858:00 a.m. to 8:29 a.m.
- 338:30 a.m. to 8:59 a.m.
- 499:00 a.m. to 9:59 a.m.
- 1910:00 a.m. to 10:59 a.m.
- 911:00 a.m. to 11:59 a.m.
- 4112:00 p.m. to 3:59 p.m.
- 344:00 p.m. to 11:59 p.m.

Occupations of males:
- Percentage of males in management occupations (except farmers):
Here: 6.7% city: 13.0%
- Percentage of males in business and financial operations occupations:
Here: 2.0% city: 4.6%
- Percentage of males in computer and mathematical occupations:
Here: 12.2% city: 13.6%
- Percentage of males in architecture and engineering occupations:
Here: 9.2% city: 10.2%
- Percentage of males in legal occupations:
Here: 3.1% city: 0.8%
- Percentage of males in education, training, and library occupations:
Here: 37.6% city: 2.8%
- Percentage of males in arts, design, entertainment, sports, and media occupations:
Here: 4.0% city: 1.8%
- Percentage of males in service occupations:
Here: 1.3% city: 12.7%
- Percentage of males in sales and office occupations:
Here: 13.7% city: 12.8%
- Percentage of males in transportation occupations:
Here: 4.5% city: 3.6%
Occupations of females:
- Percentage of females in management occupations (except farmers):
Here: 4.7% city: 11.0%
- Percentage of females in business and financial operations occupations:
Here: 6.9% city: 8.6%
- Percentage of females in computer and mathematical occupations:
Here: 2.3% city: 5.4%
- Percentage of females in community and social services occupations:
Here: 2.2% city: 1.8%
- Percentage of females in legal occupations:
Here: 9.2% city: 1.3%
- Percentage of females in education, training, and library occupations:
Here: 18.8% city: 8.1%
- Percentage of females in arts, design, entertainment, sports, and media occupations:
Here: 11.6% city: 2.0%
- Percentage of females in healthcare practitioners and technical occupations:
Here: 6.6% city: 6.8%
- Percentage of females in service occupations:
Here: 19.1% city: 21.7%
- Percentage of females in sales and office occupations:
Here: 18.0% city: 22.0%
- Percentage of females in farming, fishing, and forestry occupations:
Here: 1.6% city: 0.2%
- Percentage of females in production occupations:
Here: 1.0% city: 4.0%
Percentage of people 16-64 in Armed Forces:
| Bascom (Forest): | 0.1% |
| San Jose: | 0.0% |
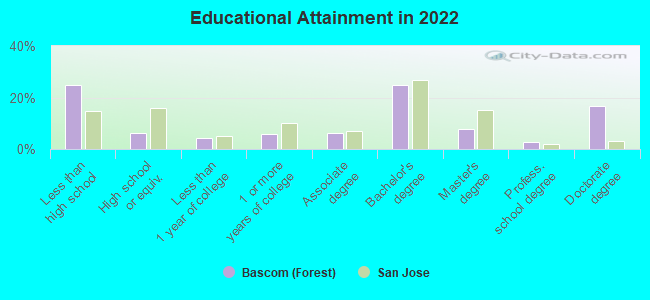
Education in this neighborhood (subdivision or community):
- Percentage of people 3 years and older in K-12 schools:
Bascom (Forest): 25.1% San Jose: 16.1%
- Percentage of people 3 years and older in undergraduate colleges:
Bascom (Forest): 3.0% San Jose: 6.5%
- Percentage of people 3 years and older in grad. or professional schools:
Bascom (Forest): 11.8% San Jose: 2.0%
- Percentage of students K-12 enrolled in private schools:
Bascom (Forest): 58.4% San Jose: 14.9%
Percentage of population below poverty level:
| Bascom (Forest): | 7.7% |
| San Jose: | 9.0% |
Median year owner moved in (as recorded in 2022):
Median year renter moved in (as recorded in 2022):
| Bascom (Forest): | 2006 |
| San Jose: | 2008 |
Median year renter moved in (as recorded in 2022):
| Bascom (Forest): | 2016 |
| San Jose: | 2020 |
Percentage of married-couple families with both working:
| Bascom (Forest): | 121.0% |
| San Jose: | 72.5% |
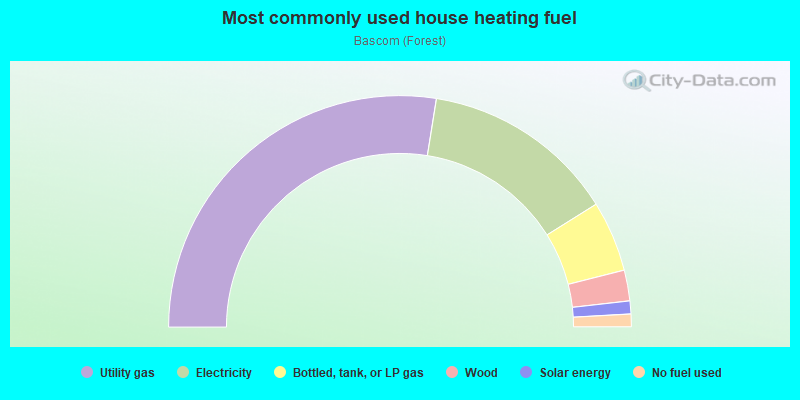
- 55.1%Utility gas
- 27.2%Electricity
- 9.9%Bottled, tank, or LP gas
- 4.3%Wood
- 1.8%Solar energy
- 1.8%No fuel used
Limited-access highways (interstate or state) in this neighborhood:
I- 880 (Nimitz Fwy)
Length: 0.53 miles
Directions: N-S, SW-NE
Directions: N-S, SW-NE
Roads and streets:
N Bascom Ave (Bascom Ave)
Length: 0.65 miles
Directions: N-S, SE-NW
Address range: 101 to 949
Directions: N-S, SE-NW
Address range: 101 to 949
W Hedding St
Length: 0.59 miles
Directions: E-W, SE-NW, SW-NE
Address range: 2000 to 2199
Directions: E-W, SE-NW, SW-NE
Address range: 2000 to 2199
Forest Ave
Length: 0.53 miles
Directions: E-W, SW-NE
Address range: 2000 to 2279
Directions: E-W, SW-NE
Address range: 2000 to 2279
Emory St
Length: 0.50 miles
Direction: E-W
Address range: 2000 to 2199
Direction: E-W
Address range: 2000 to 2199
Laurelei Ave
Length: 0.49 miles
Directions: E-W, N-S, SE-NW, SW-NE
Address range: 2000 to 2299
Directions: E-W, N-S, SE-NW, SW-NE
Address range: 2000 to 2299
Bel Air Ave
Length: 0.33 miles
Directions: E-W, SW-NE
Address range: 2000 to 2199
Directions: E-W, SW-NE
Address range: 2000 to 2199
Bellerose Dr
Length: 0.28 miles
Directions: N-S, SW-NE
Address range: 275 to 899
Directions: N-S, SW-NE
Address range: 275 to 899
Mc Daniel Ave
Length: 0.24 miles
Directions: E-W, SW-NE
Address range: 2001 to 2099
Directions: E-W, SW-NE
Address range: 2001 to 2099
Lynwood Ter
Length: 0.19 miles
Directions: E-W, SE-NW, SW-NE
Address range: 2000 to 2099
Directions: E-W, SE-NW, SW-NE
Address range: 2000 to 2099
Clarmar Way
Length: 0.19 miles
Directions: E-W, N-S, SW-NE
Address range: 155 to 2099
Directions: E-W, N-S, SW-NE
Address range: 155 to 2099
Oconnor Dr
Length: 0.18 miles
Directions: E-W, N-S, SE-NW
Address range: 400 to 599
Directions: E-W, N-S, SE-NW
Address range: 400 to 599
Naglee Ave
Length: 0.18 miles
Directions: E-W, SW-NE
Address range: 2000 to 2099
Directions: E-W, SW-NE
Address range: 2000 to 2099
University Ave
Length: 0.17 miles
Directions: E-W, SW-NE
Address range: 2000 to 2099
Directions: E-W, SW-NE
Address range: 2000 to 2099
Mc Alister Dr
Length: 0.12 miles
Directions: N-S, SE-NW
Address range: 700 to 799
Directions: N-S, SE-NW
Address range: 700 to 799
University Way
Length: 0.11 miles
Directions: N-S, SW-NE
Address range: 2000 to 2099
Directions: N-S, SW-NE
Address range: 2000 to 2099
Revey Ave
Length: 0.06 miles
Directions: N-S, SW-NE
Address range: 100 to 173
Directions: N-S, SW-NE
Address range: 100 to 173
Bailey Ave
Length: 0.01 miles
Direction: E-W
Direction: E-W