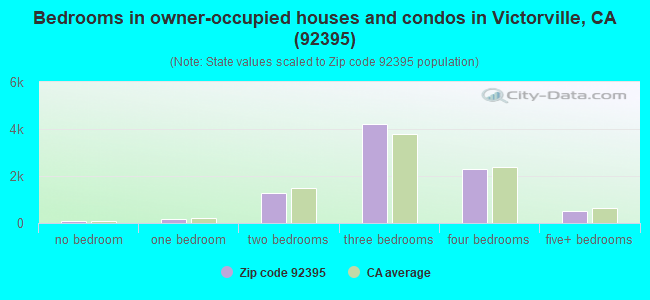
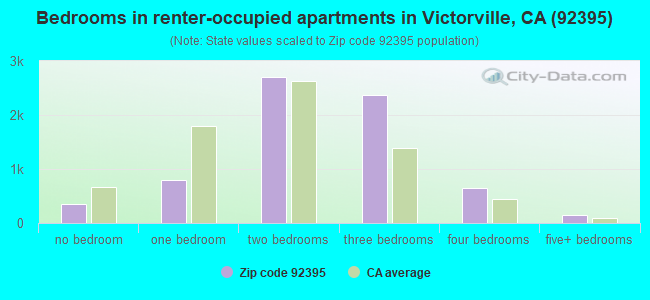
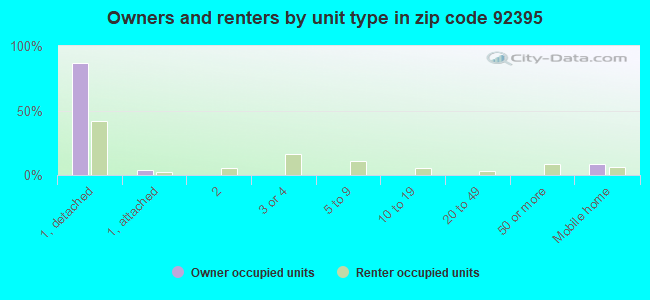
Houses and condos: 16,411 Renter-occupied apartments: 7,028
% of renters here:
45%
State:
44%
March 2022 cost of living index in zip code 92395: 74.5 (low, U.S. average is 100)
Land area: 17.1 sq. mi. Water area: 0.7 sq. mi.
Population density: 2,811 people per square mile
(average).
OSM Map
Google Map
MSN Map
OSM Map
General Map
Google Map
MSN Map
OSM Map
Google Map
MSN Map
OSM Map
Google Map
MSN Map
Please wait while loading the map...
Real estate property taxes paid for housing units in 2022:
This zip code:
0.7% ($2,326)
California:
0.7% ($4,831)
Median real estate property taxes paid for housing units with mortgages in 2022: $2,586 (0.8%) Median real estate property taxes paid for housing units with no mortgage in 2022: $1,699 (0.6%)
Averages for the 2020 tax year for zip code 92395, filed in 2021:
Average Adjusted Gross Income (AGI) in 2020: $46,844 (Individual Income Tax Returns)
Here:
$46,844
State:
$95,910
Salary/wage: $43,999 (reported on 79.6% of returns)
Here:
$43,999
State:
$77,331
(% of AGI for various income ranges: 1042.9% for AGIs below $25k, 3567.0% for AGIs $25k-50k, 7036.6% for AGIs $50k-75k, 10564.1% for AGIs $75k-100k, 19079.2% for AGIs $100k-200k, 62503.0% for AGIs over 200k)
Taxable interest for individuals: $696 (reported on 23.3% of returns)
This zip code:
$696
California:
$2,294
(% of AGI for various income ranges: 5.7% for AGIs below $25k, 10.3% for AGIs $25k-50k, 17.1% for AGIs $50k-75k, 34.9% for AGIs $75k-100k, 116.3% for AGIs $100k-200k, 653.0% for AGIs over 200k)
Ordinary dividends: $2,522 (reported on 5.8% of returns)
Here:
$2,522
State:
$10,949
(% of AGI for various income ranges: 4.9% for AGIs below $25k, 7.9% for AGIs $25k-50k, 22.8% for AGIs $50k-75k, 26.3% for AGIs $75k-100k, 79.4% for AGIs $100k-200k, 795.0% for AGIs over 200k)
Net capital gain/loss in AGI: +$15,012 (reported on 6.7% of returns)
Here:
+$15,012
State:
+$49,306
(% of AGI for various income ranges: 0.8% for AGIs below $25k, 6.2% for AGIs $25k-50k, 33.2% for AGIs $50k-75k, 69.9% for AGIs $75k-100k, 374.6% for AGIs $100k-200k, 14388.0% for AGIs over 200k)
Profit/loss from business: +$8,885 (reported on 19.0% of returns)
Here:
+$8,885
State:
+$15,671
(% of AGI for various income ranges: 186.6% for AGIs below $25k, 167.6% for AGIs $25k-50k, 195.5% for AGIs $50k-75k, 281.3% for AGIs $75k-100k, 489.9% for AGIs $100k-200k, 3457.0% for AGIs over 200k)
Taxable individual retirement arrangement distribution: $13,890 (reported on 3.3% of returns)
92395:
$13,890
California:
$23,505
(% of AGI for various income ranges: 18.5% for AGIs below $25k, 30.5% for AGIs $25k-50k, 82.1% for AGIs $50k-75k, 105.5% for AGIs $75k-100k, 309.5% for AGIs $100k-200k, 1053.0% for AGIs over 200k)
Total itemized deductions: $28,559 (reported on 7.8% of returns)
Here:
$28,559
State:
$39,517
(% of AGI for various income ranges: 34.8% for AGIs below $25k, 114.7% for AGIs $25k-50k, 445.0% for AGIs $50k-75k, 742.9% for AGIs $75k-100k, 1642.9% for AGIs $100k-200k, 5991.0% for AGIs over 200k)
Charity contributions: $6,826 (reported on 6.6% of returns)
Here:
$6,826
State:
$12,598
(% of AGI for various income ranges: 3.2% for AGIs below $25k, 15.9% for AGIs $25k-50k, 71.6% for AGIs $50k-75k, 120.9% for AGIs $75k-100k, 390.8% for AGIs $100k-200k, 1835.0% for AGIs over 200k)
Taxes paid: $7,850 (reported on 7.8% of returns)
92395:
$7,850
State:
$8,807
(% of AGI for various income ranges: 4.3% for AGIs below $25k, 26.2% for AGIs $25k-50k, 123.2% for AGIs $50k-75k, 239.3% for AGIs $75k-100k, 502.4% for AGIs $100k-200k, 1468.0% for AGIs over 200k)
Earned income credit: $2,647 (reported on 28.7% of returns)
Here:
$2,647
State:
$2,074
(% of AGI for various income ranges: 160.4% for AGIs below $25k, 116.0% for AGIs $25k-50k, 1.6% for AGIs $50k-75k)
Percentage of individuals using paid preparers for their 2020 taxes: 94.1%
Here:
94%
State:
92%
(% for various income ranges: 93.4% for AGIs below $25k, 94.5% for AGIs $25k-50k, 94.3% for AGIs $50k-75k, 94.4% for AGIs $75k-100k, 94.4% for AGIs $100k-200k, 96.8% for AGIs over 200k)
Averages for the 2012 tax year for zip code 92395, filed in 2013:
Average Adjusted Gross Income (AGI) in 2012: $39,210 (Individual Income Tax Returns)
Here:
$39,210
State:
$72,726
Salary/wage: $37,254 (reported on 78.4% of returns)
Here:
$37,254
State:
$59,079
(% of AGI for various income ranges: 65.9% for AGIs below $25k, 77.0% for AGIs $25k-50k, 80.0% for AGIs $50k-75k, 79.9% for AGIs $75k-100k, 79.5% for AGIs $100k-200k, 51.1% for AGIs over 200k)
Taxable interest for individuals: $1,041 (reported on 25.4% of returns)
This zip code:
$1,041
California:
$2,146
(% of AGI for various income ranges: 0.7% for AGIs below $25k, 0.4% for AGIs $25k-50k, 0.5% for AGIs $50k-75k, 0.7% for AGIs $75k-100k, 0.6% for AGIs $100k-200k, 1.9% for AGIs over 200k)
Ordinary dividends: $3,372 (reported on 7.7% of returns)
Here:
$3,372
State:
$9,308
(% of AGI for various income ranges: 0.5% for AGIs below $25k, 0.4% for AGIs $25k-50k, 0.4% for AGIs $50k-75k, 0.4% for AGIs $75k-100k, 0.5% for AGIs $100k-200k, 3.1% for AGIs over 200k)
Net capital gain/loss in AGI: +$3,847 (reported on 6.4% of returns)
Here:
+$3,847
State:
+$30,460
(% of AGI for various income ranges: 0.3% for AGIs $75k-100k, 0.7% for AGIs $100k-200k, 6.4% for AGIs over 200k)
Profit/loss from business: +$10,177 (reported on 20.3% of returns)
Here:
+$10,177
State:
+$17,064
(% of AGI for various income ranges: 18.6% for AGIs below $25k, 3.7% for AGIs $25k-50k, 1.6% for AGIs $50k-75k, 1.6% for AGIs $75k-100k, 2.0% for AGIs $100k-200k, 4.6% for AGIs over 200k)
Taxable individual retirement arrangement distribution: $13,148 (reported on 5.3% of returns)
92395:
$13,148
California:
$19,557
(% of AGI for various income ranges: 1.4% for AGIs below $25k, 1.8% for AGIs $25k-50k, 1.5% for AGIs $50k-75k, 2.4% for AGIs $75k-100k, 1.8% for AGIs $100k-200k, 2.2% for AGIs over 200k)
Self-employment retirement plans: $8,433 (reported on 0.2% of returns)
92395:
$8,433
California:
$24,530
Total itemized deductions: $21,779 (28% of AGI, reported on 27.0% of returns)
Here:
$21,779
State:
$34,004
Here:
27.9% of AGI
State:
22.7% of AGI
(% of AGI for various income ranges: 7.2% for AGIs below $25k, 12.5% for AGIs $25k-50k, 18.0% for AGIs $50k-75k, 18.0% for AGIs $75k-100k, 19.0% for AGIs $100k-200k, 15.3% for AGIs over 200k)
Charity contributions: $3,047 (reported on 22.0% of returns)
Here:
$3,047
State:
$4,659
(% of AGI for various income ranges: 0.6% for AGIs below $25k, 1.3% for AGIs $25k-50k, 2.1% for AGIs $50k-75k, 2.2% for AGIs $75k-100k, 2.4% for AGIs $100k-200k, 1.5% for AGIs over 200k)
Taxes paid: $6,252 (reported on 26.8% of returns)
92395:
$6,252
State:
$14,448
(% of AGI for various income ranges: 1.3% for AGIs below $25k, 2.5% for AGIs $25k-50k, 3.9% for AGIs $50k-75k, 4.9% for AGIs $75k-100k, 6.5% for AGIs $100k-200k, 9.3% for AGIs over 200k)
Earned income credit: $2,893 (reported on 35.9% of returns)
Here:
$2,893
State:
$2,286
(% of AGI for various income ranges: 13.3% for AGIs below $25k, 1.8% for AGIs $25k-50k)
Percentage of individuals using paid preparers for their 2012 taxes: 64.9%
Here:
65%
State:
64%
(% for various income ranges: 60.9% for AGIs below $25k, 65.4% for AGIs $25k-50k, 70.6% for AGIs $50k-75k, 71.3% for AGIs $75k-100k, 75.5% for AGIs $100k-200k, 85.7% for AGIs over 200k)
Averages for the 2004 tax year for zip code 92395, filed in 2005:
Average Adjusted Gross Income (AGI) in 2004: $39,673 (Individual Income Tax Returns)
Here:
$39,673
State:
$58,600
Salary/wage: $35,563 (reported on 82.3% of returns)
Here:
$35,563
State:
$49,455
(% of AGI for various income ranges: 115.5% for AGIs below $10k, 74.4% for AGIs $10k-25k, 80.1% for AGIs $25k-50k, 79.2% for AGIs $50k-75k, 78.6% for AGIs $75k-100k, 58.8% for AGIs over 100k)
Taxable interest for individuals: $1,567 (reported on 37.8% of returns)
This zip code:
$1,567
California:
$2,365
(% of AGI for various income ranges: 5.0% for AGIs below $10k, 1.7% for AGIs $10k-25k, 1.2% for AGIs $25k-50k, 0.9% for AGIs $50k-75k, 1.0% for AGIs $75k-100k, 2.1% for AGIs over 100k)
Taxable dividends: $1,877 (reported on 13.4% of returns)
Here:
$1,877
State:
$4,746
(% of AGI for various income ranges: 2.7% for AGIs below $10k, 0.8% for AGIs $10k-25k, 0.5% for AGIs $25k-50k, 0.5% for AGIs $50k-75k, 0.5% for AGIs $75k-100k, 0.8% for AGIs over 100k)
Net capital gain/loss: +$14,142 (reported on 12.7% of returns)
Here:
+$14,142
State:
+$23,418
(% of AGI for various income ranges: -1.1% for AGIs below $10k, 0.4% for AGIs $10k-25k, 0.8% for AGIs $25k-50k, 1.5% for AGIs $50k-75k, 3.1% for AGIs $75k-100k, 12.9% for AGIs over 100k)
Profit/loss from business: +$10,068 (reported on 14.5% of returns)
Here:
+$10,068
State:
+$16,826
(% of AGI for various income ranges: -13.5% for AGIs below $10k, 5.6% for AGIs $10k-25k, 2.6% for AGIs $25k-50k, 2.5% for AGIs $50k-75k, 2.4% for AGIs $75k-100k, 6.5% for AGIs over 100k)
IRA payment deduction: $3,084 (reported on 1.8% of returns)
92395:
$3,084
California:
$3,192
(% of AGI for various income ranges: 0.1% for AGIs $10k-25k, 0.2% for AGIs $25k-50k, 0.1% for AGIs $50k-75k, 0.1% for AGIs $75k-100k, 0.2% for AGIs over 100k)
Self-employed pension: $13,704 (reported on 0.5% of returns)
Here:
$13,704
California:
$17,688
Total itemized deductions: $20,313 (29% of AGI, reported on 37.0% of returns)
Here:
$20,313
State:
$28,113
Here:
28.7% of AGI
State:
25.3% of AGI
(% of AGI for various income ranges: 14.5% for AGIs below $10k, 12.4% for AGIs $10k-25k, 17.7% for AGIs $25k-50k, 21.5% for AGIs $50k-75k, 23.0% for AGIs $75k-100k, 19.2% for AGIs over 100k)
Charity contributions deductions: $2,829 (4% of AGI, reported on 32.9% of returns)
Here:
$2,829
State:
$3,923
Here:
4.0% of AGI
State:
3.3% of AGI
(% of AGI for various income ranges: 0.9% for AGIs below $10k, 1.4% for AGIs $10k-25k, 2.1% for AGIs $25k-50k, 2.8% for AGIs $50k-75k, 3.1% for AGIs $75k-100k, 2.3% for AGIs over 100k)
Total tax: $5,512 (reported on 66.9% of returns)
92395:
$5,512
State:
$10,761
(% of AGI for various income ranges: 3.4% for AGIs below $10k, 3.2% for AGIs $10k-25k, 5.3% for AGIs $25k-50k, 7.5% for AGIs $50k-75k, 9.5% for AGIs $75k-100k, 17.0% for AGIs over 100k)
Earned income credit: $1,968 (reported on 23.8% of returns)
Here:
$1,968
State:
$1,763
Percentage of individuals using paid preparers for their 2004 taxes: 75.0%
Here:
75%
State:
66%
(% for various income ranges: 68.5% for AGIs below $10k, 75.0% for AGIs $10k-25k, 76.2% for AGIs $25k-50k, 78.3% for AGIs $50k-75k, 78.2% for AGIs $75k-100k, 81.4% for AGIs over 100k)
Likely homosexual households (counted as self-reported same-sex unmarried-partner households)
Lesbian couples: 0.3% of all households
Gay men: 0.2% of all households
Household received Food Stamps/SNAP in the past 12 months: 4,953 Household did not receive Food Stamps/SNAP in the past 12 months: 11,290
Women who had a birth in the past 12 months: 839 (423 now married, 419 unmarried) Women who did not have a birth in the past 12 months: 10,717 (3,962 now married, 6,767 unmarried)
Housing units in zip code 92395 with a mortgage: 5,794 (507 second mortgage, 293 both second mortgage and home equity loan) Median monthly owner costs for units with a mortgage: $1,586 Median monthly owner costs for units without a mortgage: $554
Residents with income below the poverty level in 2022:
This zip code:
20.7%
Whole state:
12.2%
Residents with income below 50% of the poverty level in 2022:
This zip code:
10.6%
Whole state:
6.2%
Median number of rooms in houses and condos:
Here:
6.0
State:
6.0
Median number of rooms in apartments:
Here:
4.4
State:
3.9
Notable locations in this zip code not listed on our city pages
Notable locations in zip code 92395: Spring Lake Country Club (A), Victorville Municipal Golf Course (B), Kemper Campbell Ranch (C), Apple Valley Gun Club (D), Mojave State Fish Hatchery (E), Green Tree Country Club (F), American Medical Response Victorville (G), San Bernardino County Fire Department Station 22 - Spring Valley Lake (H), San Bernardino County Fire Department Station 311 Victorville Headquarters (I), San Bernardino County Fire Department Station 314 Victorville (J), Victorville Branch San Bernardino County Library (K), Victorville Activities Center (L). Display/hide their locations on the map
Shopping Centers: Victor Valley Town Center Shopping Center (1), Victor Valley Home Center Shopping Center (2), Hi Desert Plaza Shopping Center (3), Bear Valley Plaza Shopping Center (4), Victor Valley Shopping Center (5), Victor Plaza Shopping Center (6), Valley Center Shopping Center (7), Desert Valley Shopping Center (8). Display/hide their locations on the map
Churches in zip code 92395 include: Congregation Bamidbar Shel Ma'alah (A), Desert Love Christian Center (B), First Missionary Baptist Church (C), Holy Faith Baptist Mission (D), Saint Joan of Arc Catholic Church (E), Saint John Evangelical Lutheran Church (F), Seventh Day Adventist Church of Green Tree (G), United Pentecostal Church (H), Victor Valley Bible Church (I). Display/hide their locations on the map
Parks in zip code 92395 include: Avalon Park (1), Center Street Park (2), Eva Dell Park (3), Forrest Park (4), Pebble Beach Park (5), San Bernardino County Fairgrounds (6). Display/hide their locations on the map
5,797 married couples with children.
5,032 single-parent households (1,132 men, 3,900 women).
59.9% of residents of 92395 zip code speak English at home.
33.1% of residents speak Spanish at home (70% very well, 15% well, 11% not well, 5% not at all).
1.4% of residents speak other Indo-European language at home (89% very well, 8% well, 3% not well).
3.1% of residents speak Asian or Pacific Island language at home (48% very well, 45% well, 7% not well).
2.1% of residents speak other language at home (66% very well, 18% well, 14% not well, 1% not at all).
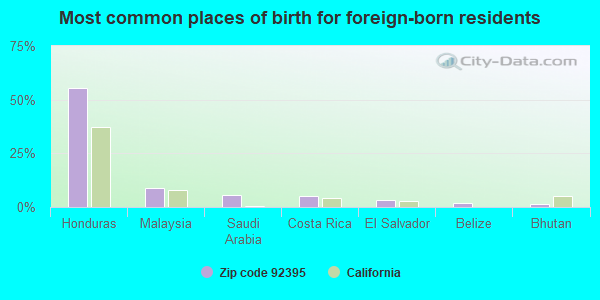
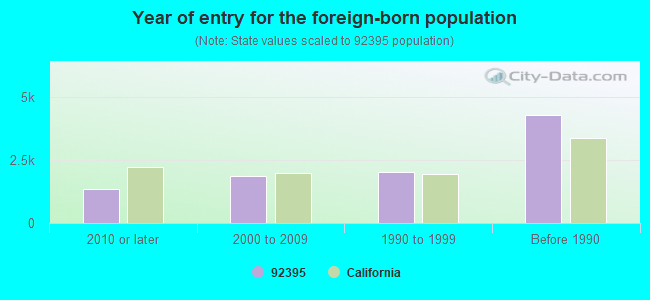
Foreign born population: 9,161 (19.1%) (55.7% of them are naturalized citizens)
This zip code:
19.1%
Whole state:
26.7%
55%Honduras
9%Malaysia
6%Saudi Arabia
5%Costa Rica
3%El Salvador
2%Belize
1%Bhutan
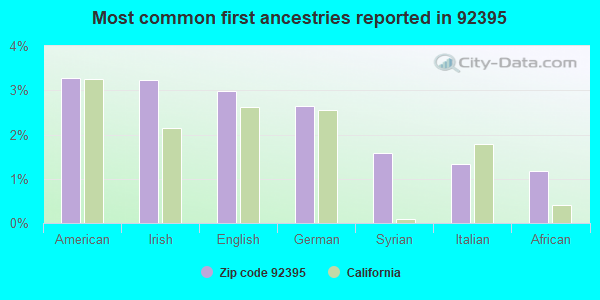
3%American
3%Irish
3%English
3%German
2%Syrian
1%Italian
1%African
Year of entry for the foreign-born population
1,3592010 or later
1,8752000 to 2009
2,0021990 to 1999
4,277Before 1990
Housing units lacking complete plumbing facilities: 0.9% Housing units lacking complete kitchen facilities: 2.5%
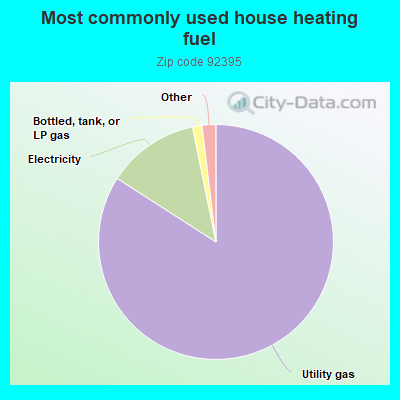
84.2%Utility gas
12.7%Electricity
1.3%Bottled, tank, or LP gas
0.7%Wood
0.5%Solar energy
0.5%No fuel used
Place of birth for U.S.-born residents:
This state: 32,204
Northeast: 950
Midwest: 1,699
South: 1,875
West: 1,660
89% of the 92395 zip code residents lived in the same house 1 year ago. Out of people who lived in different houses, 58% moved from this county. Out of people who lived in different houses, 30% moved from different county within same state. Out of people who lived in different houses, 9% moved from different state. Out of people who lived in different houses, 2% moved from abroad.
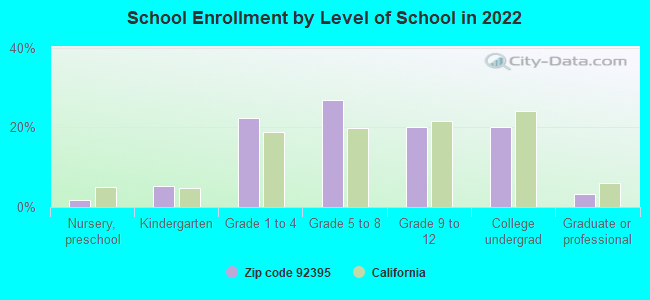
Private vs. public school enrollment:
Students in private schools in grades 1 to 8 (elementary and middle school): 193
Here:
2.6%
California:
10.5%
Students in private schools in grades 9 to 12 (high school): 93
Here:
3.1%
California:
8.5%
Students in private undergraduate colleges: 484
Here:
15.9%
California:
15.9%
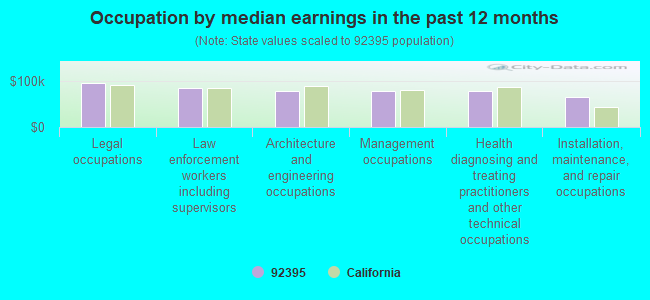
Occupation by median earnings in the past 12 months ($)
94,940Legal occupations
83,298Law enforcement workers including supervisors
77,831Architecture and engineering occupations
77,479Management occupations
76,741Health diagnosing and treating practitioners and other technical occupations
65,679Installation, maintenance, and repair occupations
Companies with federal contracts located in this zip code (VICTORVILLE, CA):
CAZCOM INC (17181 JASMINE ST) : $884,482 in 14 contractsfrom 2000 to 2005
Contracts for Miscellaneous Communication Equipment, Engineering and Technical Services, Communications Services, Radio and Television Communication Equipment, Except Airborne, and moreby Navy, Federal Technology Service, Army, Air Force, and others Signed by year:2000: $253,642; 2001: $169,427; 2002: $114,704; 2003: $265,423; 2004: $27,294; 2005: $53,992; 2006: $0.
Biggest contracts:
$223,469 with Navy for Miscellaneous Communication Equipment. Signed on 2003-07-03. Completion date: 2003-07-07.
$119,000 with Federal Technology Service for Engineering and Technical Services. Signed on 2000-12-15. Completion date: 2001-01-15.
$93,000 with Federal Technology Service for Communications Services. Signed on 2001-10-15. Completion date: 2001-11-15.
$68,363 with Navy for Radio and Television Communication Equipment, Except Airborne. Signed on 2000-08-23. Completion date: 2000-10-04.
JOHN BRICE DBA/IRONCOMPANY.COM (14962 BEAR VALLEY RD; small business) : $260,478 in 35 contractsfrom 2003 to 2006
Contracts for Athletic and Sporting Equipment, Floor Coverings, Recreational and Gymnastic Equipment, Nonwood Construction Lumber and Related Materials, and moreby Army, Departmental Offices, Bureau of Prisoners/Federal Prison System, Air Force, and others Signed by year:2000: $0; 2001: $0; 2002: $0; 2003: $1,950; 2004: $17,173; 2005: $122,059; 2006: $119,296.
Biggest contracts:
$64,392 with Army for Athletic and Sporting Equipment. Signed on 2006-05-18. Effective on 2006-05-16. Completion date: 2006-06-02.
$23,933 with Army for Athletic and Sporting Equipment. Taking place in AL. Signed on 2005-09-20. Completion date: 2005-10-31.
$17,242 with Army for Athletic and Sporting Equipment. Taking place in AK. Signed on 2005-03-04. Completion date: 2005-04-29.
$15,654 with Departmental Offices for Floor Coverings. Taking place in DC. Signed on 2005-09-30. Completion date: 2006-06-30.
JSA HOTEL SUITES LLC (12281 MARIPOSA RD; small business)
$14,339 with Army for Lodging - Hotel/Motel. Signed on 2004-08-05. Completion date: 2004-08-22.
LEE-VICTORVILLE HOTEL CORP (14173 GREEN TREE BLVD; small business)
$10,556 with Army for Lodging - Hotel/Motel. Signed on 2006-04-11. Completion date: 2006-04-20.
Top industries in this zip code by the number of employees in 2005:
Administrative and Support and Waste Management and Remediation Services: Temporary Help Services (over 1000 employees: 1 establishment, 100-249 employees: 1 establishment, 10-19 employees: 1 establishment, 1-4 employees: 1 establishment)
2005 - 2018 National Fire Incident Reporting System (NFIRS) incidents
According to the data from the years 2005 - 2018 the average number of fire incidents per year is 52. The highest number of reported fire incidents - 155 took place in 2018, and the least - 0 in 2012. The data has an increasing trend.
When looking into fire subcategories, the most incidents belonged to: Outside Fires (47.6%), and Structure Fires (34.0%).
Fire incident types reported to NFIRS in Zip Code 92395


 : $884,482 in 14 contracts from 2000 to 2005
 According to the data from the years 2005 - 2018 the average number of fire incidents per year is 52. The highest number of reported fire incidents - 155 took place in 2018, and the least - 0 in 2012. The data has an increasing trend.
 When looking into fire subcategories, the most incidents belonged to: Outside Fires (47.6%), and Structure Fires (34.0%).