Estimated zip code population in 2022: 1,009 Zip code population in 2010: 1,113 Zip code population in 2000: 895
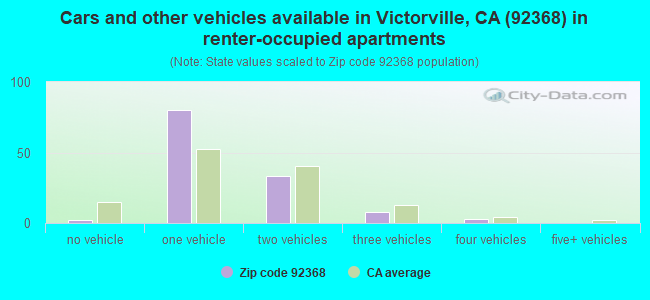
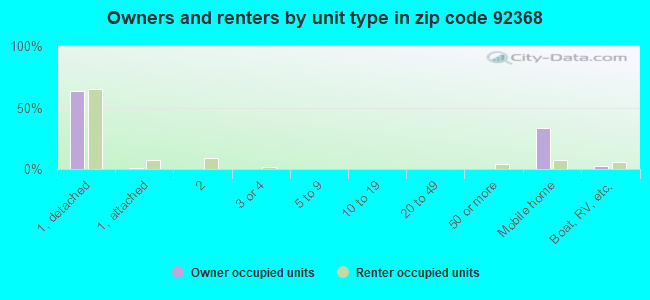
Houses and condos: 394 Renter-occupied apartments: 125
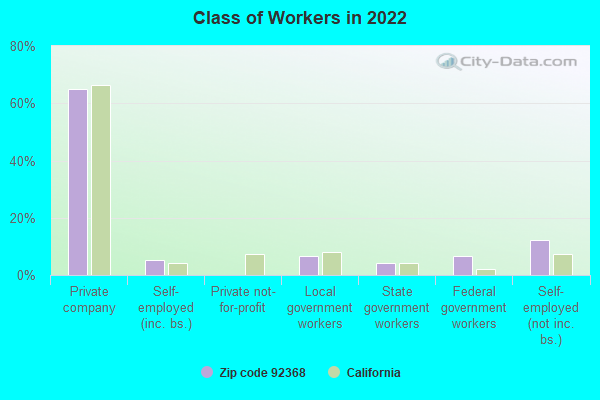
% of renters here:
42%
State:
44%
March 2022 cost of living index in zip code 92368: 74.9 (low, U.S. average is 100)
Land area: 27.9 sq. mi. Water area: 0.4 sq. mi.
Population density: 36 people per square mile
(very low).
OSM Map
General Map
Google Map
MSN Map
OSM Map
General Map
Google Map
MSN Map
OSM Map
General Map
Google Map
MSN Map
OSM Map
General Map
Google Map
MSN Map
Please wait while loading the map...
Real estate property taxes paid for housing units in 2022:
This zip code:
0.4% ($1,391)
California:
0.7% ($4,831)
Median real estate property taxes paid for housing units with mortgages in 2022: $1,427 (0.5%) Median real estate property taxes paid for housing units with no mortgage in 2022: $1,354 (0.4%)
Business Search- 14 Million verified businesses
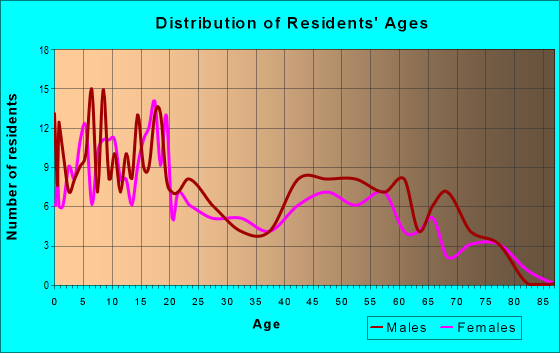
Males: 498
(49.4%)
Females: 510
(50.6%)
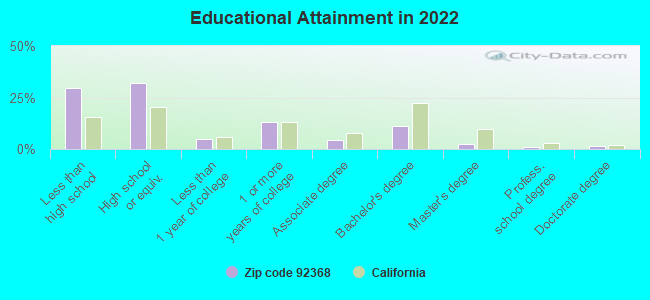
For population 25 years and over in 92368:
High school or higher: 69.1%
Bachelor's degree or higher: 16.0%
Graduate or professional degree: 4.9%
Unemployed: 7.7%
Mean travel time to work (commute): 28.2 minutes
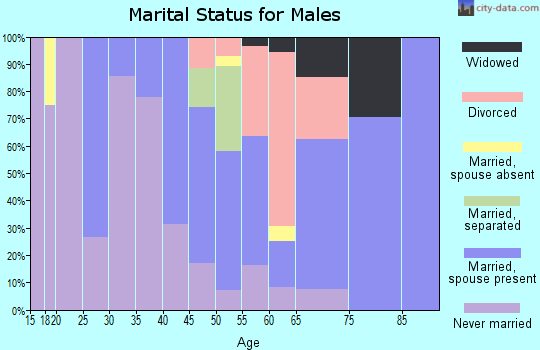
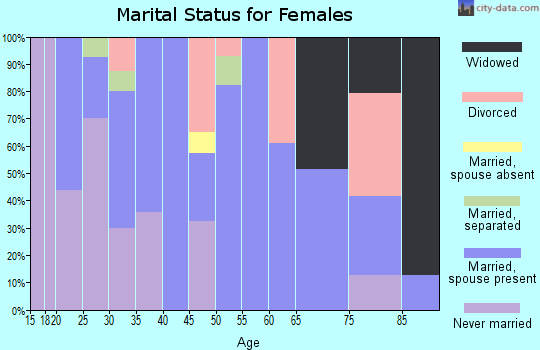
For population 15 years and over in 92368:
Never married: 43.7%
Now married: 31.7%
Separated: 3.1%
Widowed: 7.7%
Divorced: 13.7%
Zip code 92368 compared to state average:
Median household income below state average.
Median house value significantly below state average.
Black race population percentage below state average.
Percentage of population with a bachelor's degree or higher significantly below state average.
Averages for the 2020 tax year for zip code 92368, filed in 2021:
Average Adjusted Gross Income (AGI) in 2020: $37,994 (Individual Income Tax Returns)
Here:
$37,994
State:
$95,910
Salary/wage: $37,412 (reported on 74.3% of returns)
Here:
$37,412
State:
$77,331
(% of AGI for various income ranges: 1066.4% for AGIs below $25k, 3243.8% for AGIs $25k-50k, 6306.7% for AGIs $50k-75k, 10167.5% for AGIs $75k-100k)
Taxable interest for individuals: $200 (reported on 11.4% of returns)
This zip code:
$200
California:
$2,294
(% of AGI for various income ranges: 4.5% for AGIs below $25k, 10.0% for AGIs $50k-75k)
Profit/loss from business: +$5,600 (reported on 20.0% of returns)
Here:
+$5,600
State:
+$15,671
(% of AGI for various income ranges: 286.4% for AGIs below $25k, 96.2% for AGIs $25k-50k)
Earned income credit: $2,373 (reported on 31.4% of returns)
Here:
$2,373
State:
$2,074
(% of AGI for various income ranges: 159.1% for AGIs below $25k, 107.5% for AGIs $25k-50k)
Percentage of individuals using paid preparers for their 2020 taxes: 91.4%
Here:
91%
State:
92%
(% for various income ranges: 88.2% for AGIs below $25k, 100.0% for AGIs $25k-50k, 75.0% for AGIs $50k-75k, 100.0% for AGIs $75k-100k, 100.0% for AGIs $100k-200k)
Averages for the 2012 tax year for zip code 92368, filed in 2013:
Average Adjusted Gross Income (AGI) in 2012: $33,611 (Individual Income Tax Returns)
Here:
$33,611
State:
$72,726
Salary/wage: $32,640 (reported on 74.1% of returns)
Here:
$32,640
State:
$59,079
(% of AGI for various income ranges: 65.9% for AGIs below $25k, 69.7% for AGIs $25k-50k, 80.0% for AGIs $50k-75k, 70.9% for AGIs $75k-100k)
Taxable interest for individuals: $133 (reported on 22.2% of returns)
This zip code:
$133
California:
$2,146
Profit/loss from business: +$8,367 (reported on 22.2% of returns)
Here:
+$8,367
State:
+$17,064
Total itemized deductions: $20,060 (30% of AGI, reported on 18.5% of returns)
Here:
$20,060
State:
$34,004
Here:
30.1% of AGI
State:
22.7% of AGI
Charity contributions: $2,800 (reported on 11.1% of returns)
Here:
$2,800
State:
$4,659
Taxes paid: $4,580 (reported on 18.5% of returns)
92368:
$4,580
State:
$14,448
Earned income credit: $3,078 (reported on 33.3% of returns)
Here:
$3,078
State:
$2,286
(% of AGI for various income ranges: 14.4% for AGIs below $25k, 1.6% for AGIs $25k-50k)
Percentage of individuals using paid preparers for their 2012 taxes: 70.4%
Here:
70%
State:
64%
(% for various income ranges: 64.3% for AGIs below $25k, 83.3% for AGIs $25k-50k, 75.0% for AGIs $50k-75k, 66.7% for AGIs $75k-100k)
Averages for the 2004 tax year for zip code 92368, filed in 2005:
Average Adjusted Gross Income (AGI) in 2004: $26,203 (Individual Income Tax Returns)
Here:
$26,203
State:
$58,600
Salary/wage: $27,390 (reported on 80.1% of returns)
Here:
$27,390
State:
$49,455
(% of AGI for various income ranges: 104.5% for AGIs below $10k, 72.8% for AGIs $10k-25k, 92.3% for AGIs $25k-50k, 82.2% for AGIs $50k-75k, 81.1% for AGIs $75k-100k)
Taxable interest for individuals: $600 (reported on 22.6% of returns)
This zip code:
$600
California:
$2,365
(% of AGI for various income ranges: 1.6% for AGIs $10k-25k, 0.3% for AGIs $25k-50k, 0.2% for AGIs $50k-75k, 0.2% for AGIs $75k-100k)
Taxable dividends: $375 (reported on 6.0% of returns)
Here:
$375
State:
$4,746
Net capital gain/loss: +$667 (reported on 4.5% of returns)
Here:
+$667
State:
+$23,418
Profit/loss from business: +$4,382 (reported on 12.8% of returns)
Here:
+$4,382
State:
+$16,826
Total itemized deductions: $17,653 (33% of AGI, reported on 18.4% of returns)
Here:
$17,653
State:
$28,113
Here:
32.7% of AGI
State:
25.3% of AGI
Charity contributions deductions: $2,842 (5% of AGI, reported on 14.3% of returns)
Here:
$2,842
State:
$3,923
Here:
5.3% of AGI
State:
3.3% of AGI
Total tax: $2,856 (reported on 57.5% of returns)
92368:
$2,856
State:
$10,761
(% of AGI for various income ranges: 4.8% for AGIs below $10k, 2.8% for AGIs $10k-25k, 5.3% for AGIs $25k-50k, 10.2% for AGIs $50k-75k, 7.0% for AGIs $75k-100k)
Earned income credit: $1,904 (reported on 31.2% of returns)
Here:
$1,904
State:
$1,763
Percentage of individuals using paid preparers for their 2004 taxes: 66.9%
Here:
67%
State:
66%
(% for various income ranges: 73.2% for AGIs below $10k, 64.9% for AGIs $10k-25k, 66.7% for AGIs $25k-50k, 58.6% for AGIs $50k-75k, 66.7% for AGIs $75k-100k)
Household received Food Stamps/SNAP in the past 12 months: 98 Household did not receive Food Stamps/SNAP in the past 12 months: 215
Women who did not have a birth in the past 12 months: 224 (61 now married, 164 unmarried)
Housing units in zip code 92368 with a mortgage: 82 (1 second mortgage) Median monthly owner costs for units with a mortgage: $1,384 Median monthly owner costs for units without a mortgage: $536
Residents with income below the poverty level in 2022:
This zip code:
20.4%
Whole state:
12.2%
Residents with income below 50% of the poverty level in 2022:
This zip code:
6.1%
Whole state:
6.2%
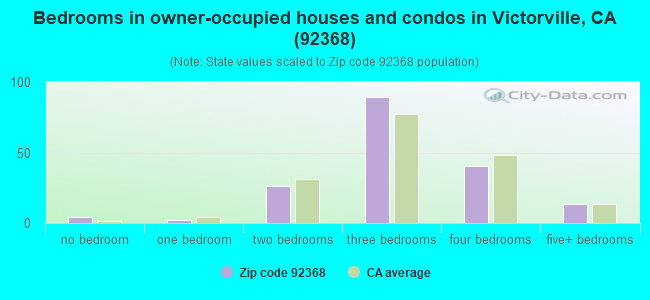
Median number of rooms in houses and condos:
Here:
5.9
State:
6.0
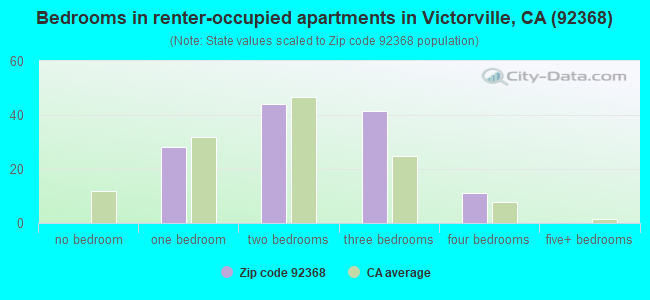
Median number of rooms in apartments:
Here:
4.4
State:
3.9
Notable locations in this zip code not listed on our city pages
Size of family households: 47 2-persons, 46 3-persons, 64 4-persons, 25 5-persons, 3 6-persons, 18 7-or-more-persons
Size of nonfamily households: 48 1-person, 38 2-persons, 7 3-persons
75 married couples with children.
87 single-parent households (9 men, 78 women).
51.9% of residents of 92368 zip code speak English at home.
38.1% of residents speak Spanish at home (60% very well, 10% well, 18% not well, 12% not at all).
3.7% of residents speak other Indo-European language at home (100% very well).
5.9% of residents speak Asian or Pacific Island language at home (54% very well, 46% well).
Foreign born population: 234 (23.2%) (48.5% of them are naturalized citizens)
This zip code:
23.2%
Whole state:
26.7%
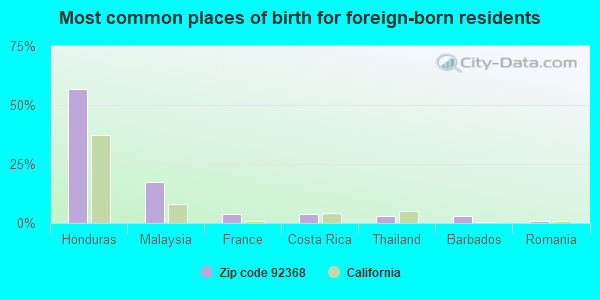
57%Honduras
18%Malaysia
4%France
4%Costa Rica
3%Thailand
3%Barbados
1%Romania
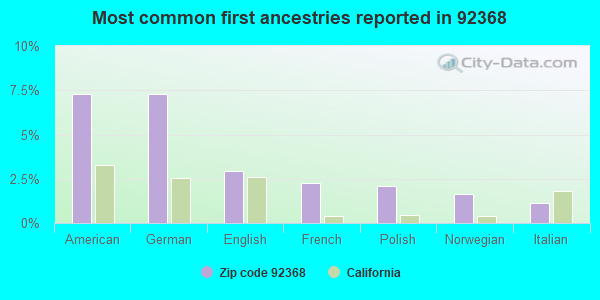
7%American
7%German
3%English
2%French
2%Polish
2%Norwegian
1%Italian
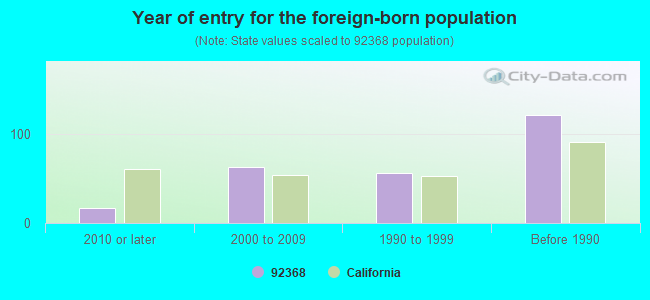
Year of entry for the foreign-born population
172010 or later
632000 to 2009
561990 to 1999
122Before 1990
Facilities with environmental interests located in this zip code:
CALMAT COMPANY ORO GRANDE (20181 NATIONAL TRAILS HIGHWAY in ORO GRANDE, CA)
STATE MASTER (California - Hazardous Waste Tracking) - HAZARDOU WASTE PROGRAM CRITERIA AND HAZARDOUS AIR POLLUTANT INVENTORY (Inventory of air pollution sources) Small Quantity Generators, between 100 kg and 1000 kg of hazardous waste/month (Resource Conservation and Recovery Act (tracking hazardous waste)) - notification Business SIC classification: ASPHALT PAVING MIXTURES AND BLOCKS Alternative names: INDUSTRIAL ASPHALT, INC.
Housing units lacking complete plumbing facilities: 10.0% Housing units lacking complete kitchen facilities: 14.2%
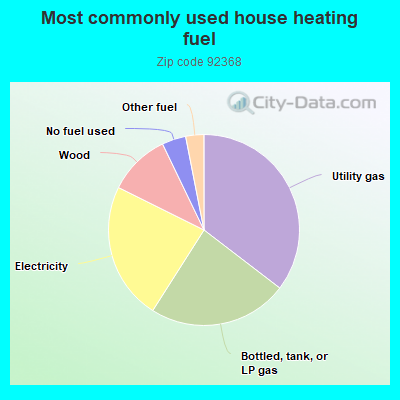
35.7%Utility gas
23.8%Bottled, tank, or LP gas
23.5%Electricity
10.6%Wood
4.1%No fuel used
3.1%Other fuel
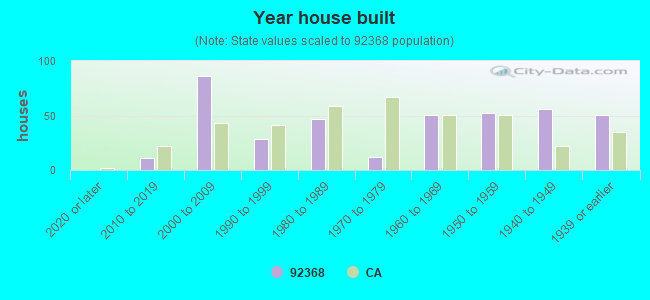
Population in 1990: 852. Population change in the 1990s: +43 (+5.0%).
Place of birth for U.S.-born residents:
This state: 627
Northeast: 19
Midwest: 36
South: 37
West: 19
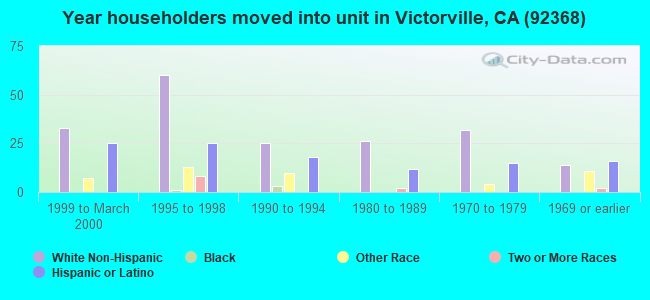
55% of the 92368 zip code residents lived in the same house 5 years ago. Out of people who lived in different houses, 70% lived in this county. Out of people who lived in different counties, 50% lived in California.
75% of the 92368 zip code residents lived in the same house 1 year ago. Out of people who lived in different houses, 56% moved from this county. Out of people who lived in different houses, 34% moved from different county within same state. Out of people who lived in different houses, 5% moved from different state.
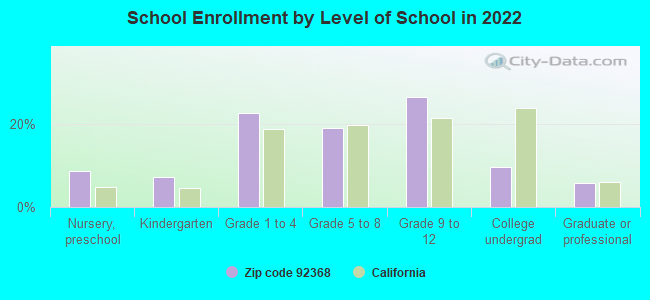
Private vs. public school enrollment:
Students in private schools in grades 1 to 8 (elementary and middle school): 5
Here:
4.6%
California:
10.5%
Students in private schools in grades 9 to 12 (high school):
Here:
0.0%
California:
8.5%
Students in private undergraduate colleges:
Here:
0.0%
California:
15.9%
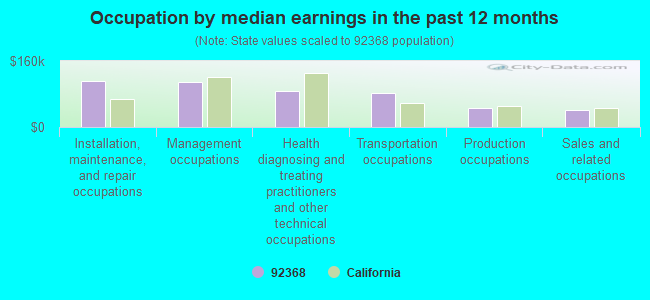
Occupation by median earnings in the past 12 months ($)
110,688Installation, maintenance, and repair occupations
108,120Management occupations
88,079Health diagnosing and treating practitioners and other technical occupations
82,163Transportation occupations
45,638Production occupations
40,180Sales and related occupations
Companies with federal contracts located in this zip code:
LAYNE GRUENEWALD (18968 NATIONAL TRAILS HWY in ORO GRANDE, CA; small business)
$4,336 with Army for Storage Tanks. Signed on 2005-09-13. Completion date: 2005-09-27.
Top industries in this zip code by the number of employees in 2005:
Construction: Power and Communication Line and Related Structures Construction (50-99 employees: 1 establishment)
Mining: Construction Sand and Gravel Mining (5-9: 1)
Construction: Painting and Wall Covering Contractors (1-4: 1)
Educational Services: Elementary and Secondary Schools (1-4: 1)
Other Services (except Public Administration): Other Automotive Mechanical and Electrical Repair and Maintenance (1-4: 1)
Fatal accident statistics in 2014:
Fatal accident count: 1
Vehicles involved in fatal accidents: 2
Fatal accidents caused by drunken drivers: 0
Fatalities: 1
Persons involved in fatal accidents: 2
Pedestrians involved in fatal accidents: 0
Home Mortgage Disclosure Act Aggregated Statistics For Year 2009 (Based on 2 partial tracts)
A) FHA, FSA/RHS & VA Home Purchase Loans
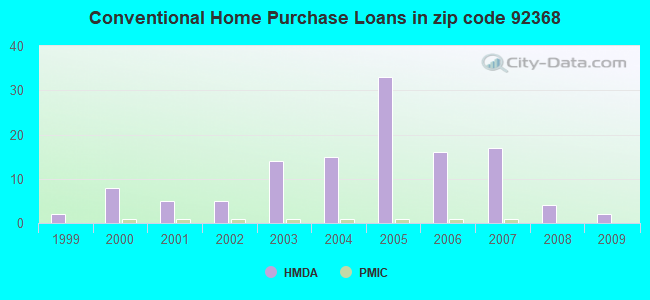
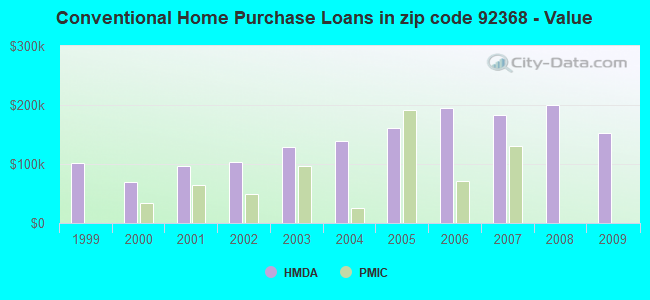
B) Conventional Home Purchase Loans
C) Refinancings
D) Home Improvement Loans
F) Non-occupant Loans on < 5 Family Dwellings (A B C & D)
G) Loans On Manufactured Home Dwelling (A B C & D)
Number
Average Value
Number
Average Value
Number
Average Value
Number
Average Value
Number
Average Value
Number
Average Value
LOANS ORIGINATED
4
$167,375
2
$153,140
3
$151,450
1
$3,160
0
$0
3
$135,420
APPLICATIONS APPROVED, NOT ACCEPTED
0
$0
0
$0
1
$87,960
0
$0
0
$0
0
$0
APPLICATIONS DENIED
3
$174,020
2
$92,390
10
$184,714
1
$62,010
2
$176,550
4
$134,788
APPLICATIONS WITHDRAWN
3
$109,897
1
$88,590
5
$161,618
1
$243,630
1
$88,590
1
$91,760
FILES CLOSED FOR INCOMPLETENESS
0
$0
1
$74,670
1
$112,010
0
$0
0
$0
1
$74,670
Aggregated Statistics For Year 2008 (Based on 2 partial tracts)
A) FHA, FSA/RHS & VA Home Purchase Loans
B) Conventional Home Purchase Loans
C) Refinancings
D) Home Improvement Loans
F) Non-occupant Loans on < 5 Family Dwellings (A B C & D)
G) Loans On Manufactured Home Dwelling (A B C & D)
Number
Average Value
Number
Average Value
Number
Average Value
Number
Average Value
Number
Average Value
Number
Average Value
LOANS ORIGINATED
2
$261,345
4
$199,648
8
$166,585
3
$56,740
1
$74,040
4
$157,725
APPLICATIONS APPROVED, NOT ACCEPTED
0
$0
1
$203,760
3
$163,263
1
$11,390
0
$0
1
$41,130
APPLICATIONS DENIED
0
$0
4
$202,338
19
$203,195
4
$142,855
1
$100,620
7
$137,770
APPLICATIONS WITHDRAWN
2
$202,180
3
$155,880
7
$253,843
1
$2,530
1
$234,140
1
$218,320
FILES CLOSED FOR INCOMPLETENESS
0
$0
1
$194,900
3
$219,160
1
$45,560
1
$389,170
1
$127,190
Aggregated Statistics For Year 2007 (Based on 2 partial tracts)
B) Conventional Home Purchase Loans
C) Refinancings
D) Home Improvement Loans
F) Non-occupant Loans on < 5 Family Dwellings (A B C & D)
G) Loans On Manufactured Home Dwelling (A B C & D)
Number
Average Value
Number
Average Value
Number
Average Value
Number
Average Value
Number
Average Value
LOANS ORIGINATED
17
$183,065
21
$227,657
4
$127,510
6
$241,308
7
$149,431
APPLICATIONS APPROVED, NOT ACCEPTED
3
$201,863
3
$253,753
3
$162,420
3
$206,713
1
$18,980
APPLICATIONS DENIED
15
$184,103
29
$202,431
5
$128,712
5
$188,828
6
$151,240
APPLICATIONS WITHDRAWN
3
$250,167
18
$176,938
3
$112,217
1
$63,280
6
$115,592
FILES CLOSED FOR INCOMPLETENESS
1
$50,620
11
$224,356
1
$137,320
1
$196,170
1
$194,900
Aggregated Statistics For Year 2006 (Based on 2 partial tracts)
A) FHA, FSA/RHS & VA Home Purchase Loans
B) Conventional Home Purchase Loans
C) Refinancings
D) Home Improvement Loans
F) Non-occupant Loans on < 5 Family Dwellings (A B C & D)
G) Loans On Manufactured Home Dwelling (A B C & D)
Number
Average Value
Number
Average Value
Number
Average Value
Number
Average Value
Number
Average Value
Number
Average Value
LOANS ORIGINATED
1
$398,660
16
$194,704
39
$180,932
5
$131,496
13
$199,381
9
$193,074
APPLICATIONS APPROVED, NOT ACCEPTED
0
$0
9
$238,988
7
$202,586
1
$43,030
1
$231,600
1
$48,090
APPLICATIONS DENIED
0
$0
15
$180,981
29
$191,869
11
$121,153
7
$251,583
8
$126,006
APPLICATIONS WITHDRAWN
1
$340,450
8
$204,869
30
$171,215
1
$88,590
4
$183,670
4
$126,560
FILES CLOSED FOR INCOMPLETENESS
1
$109,470
4
$122,762
6
$240,358
0
$0
1
$208,190
1
$201,860
Aggregated Statistics For Year 2005 (Based on 2 partial tracts)
A) FHA, FSA/RHS & VA Home Purchase Loans
B) Conventional Home Purchase Loans
C) Refinancings
D) Home Improvement Loans
F) Non-occupant Loans on < 5 Family Dwellings (A B C & D)
G) Loans On Manufactured Home Dwelling (A B C & D)
Number
Average Value
Number
Average Value
Number
Average Value
Number
Average Value
Number
Average Value
Number
Average Value
LOANS ORIGINATED
3
$146,387
33
$160,731
29
$168,478
3
$153,350
12
$169,327
7
$115,531
APPLICATIONS APPROVED, NOT ACCEPTED
0
$0
8
$150,211
5
$119,600
1
$49,990
2
$131,305
1
$144,280
APPLICATIONS DENIED
0
$0
21
$141,024
30
$134,554
7
$78,829
8
$134,708
4
$70,240
APPLICATIONS WITHDRAWN
0
$0
11
$157,049
23
$174,213
4
$139,532
3
$215,363
3
$117,913
FILES CLOSED FOR INCOMPLETENESS
0
$0
2
$192,370
7
$194,179
0
$0
0
$0
0
$0
Aggregated Statistics For Year 2004 (Based on 2 partial tracts)
A) FHA, FSA/RHS & VA Home Purchase Loans
B) Conventional Home Purchase Loans
C) Refinancings
D) Home Improvement Loans
F) Non-occupant Loans on < 5 Family Dwellings (A B C & D)
G) Loans On Manufactured Home Dwelling (A B C & D)
Number
Average Value
Number
Average Value
Number
Average Value
Number
Average Value
Number
Average Value
Number
Average Value
LOANS ORIGINATED
2
$155,350
15
$138,541
39
$123,558
4
$55,688
5
$139,976
3
$85,007
APPLICATIONS APPROVED, NOT ACCEPTED
0
$0
5
$71,632
8
$91,994
1
$45,560
1
$122,130
3
$82,053
APPLICATIONS DENIED
1
$27,210
11
$86,866
25
$93,781
4
$36,702
2
$80,050
3
$91,757
APPLICATIONS WITHDRAWN
1
$98,080
9
$193,144
20
$106,406
1
$9,490
3
$141,113
3
$97,030
FILES CLOSED FOR INCOMPLETENESS
0
$0
4
$132,255
6
$151,133
0
$0
1
$86,690
1
$177,180
Aggregated Statistics For Year 2003 (Based on 2 partial tracts)
A) FHA, FSA/RHS & VA Home Purchase Loans
B) Conventional Home Purchase Loans
C) Refinancings
D) Home Improvement Loans
F) Non-occupant Loans on < 5 Family Dwellings (A B C & D)
Number
Average Value
Number
Average Value
Number
Average Value
Number
Average Value
Number
Average Value
LOANS ORIGINATED
4
$69,132
14
$128,051
39
$105,678
1
$82,260
4
$128,775
APPLICATIONS APPROVED, NOT ACCEPTED
1
$74,670
2
$45,880
13
$103,438
1
$50,620
4
$82,422
APPLICATIONS DENIED
2
$130,990
6
$119,388
23
$108,099
4
$26,102
1
$94,290
APPLICATIONS WITHDRAWN
0
$0
3
$47,460
8
$122,446
1
$11,390
1
$43,030
FILES CLOSED FOR INCOMPLETENESS
0
$0
1
$75,940
3
$76,357
0
$0
1
$75,940
Aggregated Statistics For Year 2002 (Based on 2 partial tracts)
A) FHA, FSA/RHS & VA Home Purchase Loans
B) Conventional Home Purchase Loans
C) Refinancings
D) Home Improvement Loans
F) Non-occupant Loans on < 5 Family Dwellings (A B C & D)
Number
Average Value
Number
Average Value
Number
Average Value
Number
Average Value
Number
Average Value
LOANS ORIGINATED
6
$88,382
5
$102,766
16
$99,468
0
$0
4
$106,468
APPLICATIONS APPROVED, NOT ACCEPTED
1
$49,990
2
$74,985
5
$91,124
0
$0
1
$75,940
APPLICATIONS DENIED
1
$30,370
9
$126,068
19
$81,931
2
$28,790
4
$133,995
APPLICATIONS WITHDRAWN
1
$102,510
0
$0
9
$97,381
0
$0
0
$0
FILES CLOSED FOR INCOMPLETENESS
0
$0
1
$141,750
1
$51,890
0
$0
0
$0
Aggregated Statistics For Year 2001 (Based on 2 partial tracts)
A) FHA, FSA/RHS & VA Home Purchase Loans
B) Conventional Home Purchase Loans
C) Refinancings
D) Home Improvement Loans
F) Non-occupant Loans on < 5 Family Dwellings (A B C & D)
Number
Average Value
Number
Average Value
Number
Average Value
Number
Average Value
Number
Average Value
LOANS ORIGINATED
5
$93,274
5
$96,566
15
$88,086
1
$18,980
3
$62,227
APPLICATIONS APPROVED, NOT ACCEPTED
1
$92,390
1
$25,310
3
$94,497
1
$18,980
1
$25,310
APPLICATIONS DENIED
0
$0
3
$161,573
19
$57,951
3
$26,790
2
$160,730
APPLICATIONS WITHDRAWN
0
$0
1
$148,080
7
$79,823
1
$18,980
1
$77,200
FILES CLOSED FOR INCOMPLETENESS
0
$0
0
$0
1
$170,860
0
$0
0
$0
Aggregated Statistics For Year 2000 (Based on 2 partial tracts)
A) FHA, FSA/RHS & VA Home Purchase Loans
B) Conventional Home Purchase Loans
C) Refinancings
D) Home Improvement Loans
F) Non-occupant Loans on < 5 Family Dwellings (A B C & D)
Number
Average Value
Number
Average Value
Number
Average Value
Number
Average Value
Number
Average Value
LOANS ORIGINATED
8
$105,836
8
$69,688
6
$65,495
1
$13,290
1
$49,360
APPLICATIONS APPROVED, NOT ACCEPTED
1
$155,040
1
$89,220
3
$90,700
0
$0
0
$0
APPLICATIONS DENIED
1
$58,220
3
$39,023
12
$59,588
3
$21,093
6
$41,765
APPLICATIONS WITHDRAWN
2
$112,955
1
$48,090
2
$49,360
1
$6,330
0
$0
FILES CLOSED FOR INCOMPLETENESS
0
$0
0
$0
0
$0
0
$0
0
$0
Aggregated Statistics For Year 1999 (Based on 1 partial tract)
A) FHA, FSA/RHS & VA Home Purchase Loans
B) Conventional Home Purchase Loans
C) Refinancings
D) Home Improvement Loans
F) Non-occupant Loans on < 5 Family Dwellings (A B C & D)


 Nearest zip codes: 92394, 92342, 92301, 92395, 92392, 92307.