Averages for the 2020 tax year for zip code 85634, filed in 2021:
Average Adjusted Gross Income (AGI) in 2020: $37,587 (Individual Income Tax Returns)
Here:
$37,587
State:
$73,499
Salary/wage: $37,006 (reported on 88.4% of returns)
Here:
$37,006
State:
$59,499
(% of AGI for various income ranges: 1399.4% for AGIs below $25k, 4298.4% for AGIs $25k-50k, 7703.6% for AGIs $50k-75k, 10612.5% for AGIs $75k-100k, 23647.5% for AGIs $100k-200k)
Taxable interest for individuals: $45 (reported on 4.7% of returns)
This zip code:
$45
Arizona:
$2,325
(% of AGI for various income ranges: 0.4% for AGIs below $25k, 1.2% for AGIs $50k-75k)
Profit/loss from business: +$4,088 (reported on 7.3% of returns)
Here:
+$4,088
State:
+$13,214
(% of AGI for various income ranges: 101.0% for AGIs below $25k, 15.6% for AGIs $25k-50k, 22.4% for AGIs $50k-75k)
Taxable individual retirement arrangement distribution: $15,100 (reported on 1.3% of returns)
85634:
$15,100
Arizona:
$23,364
(% of AGI for various income ranges: 62.1% for AGIs $25k-50k)
Earned income credit: $2,413 (reported on 35.3% of returns)
Here:
$2,413
State:
$2,383
(% of AGI for various income ranges: 203.7% for AGIs below $25k, 126.0% for AGIs $25k-50k)
Percentage of individuals using paid preparers for their 2020 taxes: 96.6%
Here:
97%
State:
93%
(% for various income ranges: 97.6% for AGIs below $25k, 96.8% for AGIs $25k-50k, 94.4% for AGIs $50k-75k, 100.0% for AGIs $75k-100k, 88.9% for AGIs $100k-200k)
Averages for the 2012 tax year for zip code 85634, filed in 2013:
Average Adjusted Gross Income (AGI) in 2012: $34,289 (Individual Income Tax Returns)
Here:
$34,289
State:
$57,644
Salary/wage: $32,706 (reported on 93.2% of returns)
Here:
$32,706
State:
$47,932
(% of AGI for various income ranges: 86.0% for AGIs below $25k, 92.5% for AGIs $25k-50k, 85.8% for AGIs $50k-75k, 89.7% for AGIs $75k-100k, 82.4% for AGIs $100k-200k)
Taxable interest for individuals: $140 (reported on 4.8% of returns)
This zip code:
$140
Arizona:
$2,064
(% of AGI for various income ranges: )
Ordinary dividends: $500 (reported on 1.0% of returns)
Here:
$500
State:
$7,268
Profit/loss from business: +$5,150 (reported on 7.7% of returns)
Here:
+$5,150
State:
+$12,323
(% of AGI for various income ranges: 5.1% for AGIs below $25k, 0.7% for AGIs $25k-50k, 0.4% for AGIs $50k-75k)
Taxable individual retirement arrangement distribution: $9,525 (reported on 1.9% of returns)
85634:
$9,525
Arizona:
$18,280
Total itemized deductions: $15,050 (22% of AGI, reported on 2.9% of returns)
Here:
$15,050
State:
$23,651
Here:
21.7% of AGI
State:
20.6% of AGI
Charity contributions: $3,067 (reported on 1.4% of returns)
Here:
$3,067
State:
$4,114
Taxes paid: $3,960 (reported on 2.4% of returns)
85634:
$3,960
State:
$6,509
Earned income credit: $2,316 (reported on 44.0% of returns)
Here:
$2,316
State:
$2,432
(% of AGI for various income ranges: 12.9% for AGIs below $25k, 2.3% for AGIs $25k-50k)
Percentage of individuals using paid preparers for their 2012 taxes: 59.4%
Here:
59%
State:
52%
(% for various income ranges: 59.3% for AGIs below $25k, 61.4% for AGIs $25k-50k, 54.2% for AGIs $50k-75k, 55.6% for AGIs $75k-100k, 60.0% for AGIs $100k-200k)
Averages for the 2004 tax year for zip code 85634, filed in 2005:
Average Adjusted Gross Income (AGI) in 2004: $26,668 (Individual Income Tax Returns)
Here:
$26,668
State:
$50,097
Salary/wage: $26,265 (reported on 93.5% of returns)
Here:
$26,265
State:
$42,146
(% of AGI for various income ranges: 89.9% for AGIs below $10k, 90.5% for AGIs $10k-25k, 94.6% for AGIs $25k-50k, 90.4% for AGIs $50k-75k, 89.6% for AGIs $75k-100k, 85.1% for AGIs over 100k)
Taxable interest for individuals: $336 (reported on 7.6% of returns)
This zip code:
$336
Arizona:
$2,374
(% of AGI for various income ranges: 1.2% for AGIs below $10k, 0.0% for AGIs $10k-25k, 0.1% for AGIs $25k-50k, 0.0% for AGIs $50k-75k, 0.1% for AGIs $75k-100k)
Taxable dividends: $158 (reported on 1.0% of returns)
Here:
$158
State:
$3,888
Profit/loss from business: +$3,932 (reported on 6.9% of returns)
Here:
+$3,932
State:
+$11,088
(% of AGI for various income ranges: 4.2% for AGIs below $10k, 2.4% for AGIs $10k-25k, 0.5% for AGIs $25k-50k, 0.0% for AGIs $50k-75k, 1.1% for AGIs $75k-100k)
IRA payment deduction: $792 (reported on 1.2% of returns)
85634:
$792
Arizona:
$3,023
Total itemized deductions: $17,489 (24% of AGI, reported on 2.4% of returns)
Here:
$17,489
State:
$19,781
Here:
24.5% of AGI
State:
21.8% of AGI
Charity contributions deductions: $1,267 (2% of AGI, reported on 1.6% of returns)
Here:
$1,267
State:
$3,389
Here:
1.6% of AGI
State:
3.5% of AGI
Total tax: $2,638 (reported on 58.7% of returns)
85634:
$2,638
State:
$8,323
(% of AGI for various income ranges: 1.9% for AGIs below $10k, 2.8% for AGIs $10k-25k, 5.1% for AGIs $25k-50k, 8.0% for AGIs $50k-75k, 10.5% for AGIs $75k-100k, 16.5% for AGIs over 100k)
Earned income credit: $1,753 (reported on 42.6% of returns)
Here:
$1,753
State:
$1,786
Percentage of individuals using paid preparers for their 2004 taxes: 90.5%
Here:
91%
State:
60%
(% for various income ranges: 91.1% for AGIs below $10k, 94.0% for AGIs $10k-25k, 89.5% for AGIs $25k-50k, 81.9% for AGIs $50k-75k, 79.6% for AGIs $75k-100k, 78.6% for AGIs over 100k)
Likely homosexual households (counted as self-reported same-sex unmarried-partner households)
Lesbian couples: 0.7% of all households
Gay men: 0.0% of all households
Household received Food Stamps/SNAP in the past 12 months: 629 Household did not receive Food Stamps/SNAP in the past 12 months: 954
Women who had a birth in the past 12 months: 31 (0 now married, 29 unmarried) Women who did not have a birth in the past 12 months: 1,425 (209 now married, 1,229 unmarried)
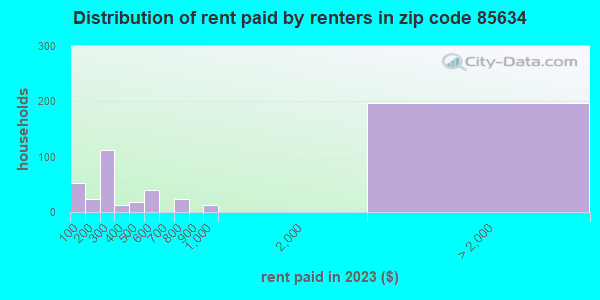
Housing units in zip code 85634 with a mortgage: 124 Median monthly owner costs for units with a mortgage: $935 Median monthly owner costs for units without a mortgage: $308
Residents with income below the poverty level in 2022:
This zip code:
44.6%
Whole state:
12.5%
Residents with income below 50% of the poverty level in 2022:
This zip code:
24.8%
Whole state:
6.0%
Median number of rooms in houses and condos:
Here:
5.0
State:
6.0
Median number of rooms in apartments:
Here:
4.3
State:
4.1
Notable locations in this zip code not listed on our city pages
Notable locations in zip code 85634: Covered Wells (A), Tatnick (B), Picacho (C), Kots Kug (D), Garcia Ranch (E), Gu Kui Chuchg (F), Bam Boo Ranch (G), Quijotoa Trading Post (H), Kitt Peak National Observatory (I), Kohi Kug (J), Kots Kug Ranch (K), San Ignacio Ranch (L), San Juan Spring (M), Santa Rosa Trading Post (N), Chui Vaya (O), Chicli Vo (P), Allison Camp (Q), Steward Observatory (R), Tracy Maintenance Camp (S), Stoa Vaya (T). Display/hide their locations on the map
Churches in zip code 85634 include: Gu Achi Childrens Shrine (A), Our Lady of Guadalupe Mission (B), Queen of Angels Mission (C), Saint Agatha Mission (D), Saint Francis Mission (E), Saint Theresa Mission (F), San Solano Mission (G), Our Lady of Lourdes Mission (H). Display/hide their locations on the map
Lakes and reservoirs: Chagit Vo (A), Francis Tank (B), Gohke Tank (C), Havana Tank (D), Kuke Chehedagi Tank (E), Bird Nest Tank (F), Nolia Tank (G), Not Tak Tank (H). Display/hide their locations on the map
Streams, rivers, and creeks: Sil Nakya Wash (A), Sikul Himatk Wash (B), Gu Vo Wash (C), Sells Wash (D), Murk Kui Wash (E), Mulberry Wash (F), San Vicente Wash (G), San Simon Wash (H), Comobabi Wash (I). Display/hide their locations on the map
In group quarters: 274 (-1 institutionalized population)
Size of family households: 247 2-persons, 235 3-persons, 262 4-persons, 259 5-persons, 57 6-persons, 177 7-or-more-persons
Size of nonfamily households: 260 1-person, 46 2-persons
260 married couples with children.
541 single-parent households (105 men, 436 women).
67.9% of residents of 85634 zip code speak English at home.
0.9% of residents speak Spanish at home (65% very well, 35% well).
29.5% of residents speak other language at home (96% very well, 2% well, 2% not well).
Foreign born population: 10 (0.2%) (9.8% of them are naturalized citizens)
This zip code:
0.2%
Whole state:
13.1%
100%Honduras
1%Italian
1%English
0%Moroccan
0%American
0%Dutch
Year of entry for the foreign-born population
02010 or later
02000 to 2009
01990 to 1999
10Before 1990
Facilities with environmental interests located in this zip code:
BABOQUIVARI HIGH SCHOOL (111 W MAIN in SELLS, AZ)
(Geographic Names Information System) (National Center for Education Statistics) - STATE ID-204 Organizations: INDIAN OASIS-BABOQUIVARI UNIFIED DISTRICT (SCHOOL DISTRICT)
BABOQUIVARI ALTERNATIVE HIGH SCHOOL (P O BOX 248 in SELLS, AZ)
(National Center for Education Statistics) - STATE ID-206 Organizations: INDIAN OASIS-BABOQUIVARI UNIFIED DISTRICT (SCHOOL DISTRICT)
BABOQUIVARI CHILD DEVELOPMENT (PO BOX 248 in SELLS, AZ)
(National Center for Education Statistics) - STATE ID-005 Organizations: INDIAN OASIS-BABOQUIVARI UNIFIED DISTRICT (SCHOOL DISTRICT)
BABOQUIVARI MIDDLE SCHOOL (111 W MAIN in SELLS, AZ)
(National Center for Education Statistics) - STATE ID-103 Organizations: INDIAN OASIS-BABOQUIVARI UNIFIED DISTRICT (SCHOOL DISTRICT)
BUREAU OF INDIAN AFFAIRS PAPAGO (5 CIRCLE DRIVE 49 in SELLS, AZ) . Federal Facility. BUREAU OF INDIAN AFFAIRS. Tribal Land
Small Quantity Generators, between 100 kg and 1000 kg of hazardous waste/month (Resource Conservation and Recovery Act (tracking hazardous waste)) - notification Organizations: US DEPT OF INTERIOR (CONTACT/OWNER)
OASIS PRIMARY SCHOOL (HIGHWAY 86 in SELLS, AZ)
COMPLIANCE ACTIVITY (Tracking inspections of insecticide, fungicide, and rodenticide, and toxic substances) Alternative names: INDIAN OASIS PRIMARY SCHOOL
BITHINOL DU'AG HIGH SCHOOL (P O BOX 38 in SELLS, AZ)
COMPLIANCE ACTIVITY (Tracking inspections of insecticide, fungicide, and rodenticide, and toxic substances)
Housing units lacking complete plumbing facilities: 15.1% Housing units lacking complete kitchen facilities: 17.5%
72.1%Electricity
12.1%Bottled, tank, or LP gas
7.4%Wood
3.4%Utility gas
2.5%No fuel used
1.7%Solar energy
0.9%Fuel oil, kerosene, etc.
Population in 1990: 9,003.
Place of birth for U.S.-born residents:
This state: 5,593
Northeast: 33
Midwest: 108
South: 34
West: 379
77% of the 85634 zip code residents lived in the same house 5 years ago. Out of people who lived in different houses, 67% lived in this county. Out of people who lived in different counties, 50% lived in Arizona.
96% of the 85634 zip code residents lived in the same house 1 year ago. Out of people who lived in different houses, 77% moved from this county. Out of people who lived in different houses, 20% moved from different county within same state. Out of people who lived in different houses, 15% moved from different state. Out of people who lived in different houses, 3% moved from abroad.
Private vs. public school enrollment:
Students in private schools in grades 1 to 8 (elementary and middle school): 44
Here:
4.7%
Arizona:
10.4%
Students in private schools in grades 9 to 12 (high school): 18
Here:
3.0%
Arizona:
8.8%
Students in private undergraduate colleges: 18
Here:
11.2%
Arizona:
13.1%
Occupation by median earnings in the past 12 months ($)
71,946Management occupations
59,250Business and financial operations occupations
58,778Production occupations
58,116Installation, maintenance, and repair occupations
55,229Law enforcement workers including supervisors
45,298Healthcare support occupations
Companies with federal contracts located in this zip code (SELLS, AZ):
TOHONO O'DHAM NATION - SOLID WASTE MANAGEMENT (P.O. BOX 370; small business) : $12,500,967 in 96 contractsfrom 1999 to 2006
Contracts for Other ADP and Telecommunications Services (includes data storage on tapes, compact disks, etc.), ADP Systems Development Services, Program Management/Support Services, Library Services, and moreby Federal Technology Service, Office of Assistant Secretary for Health except national centers (disused code), Office of Assistant Secretary for Management and Budget, Health Resources and Services Administration, and others Signed by year:2000: $6,442,000; 2001: $2,961,000; 2002: $1,605,072; 2003: $209,285; 2004: $514,386; 2005: $133,224; 2006: $0.
Biggest contracts:
$1,999,000 with Federal Technology Service for Other ADP and Telecommunications Services (includes data storage on tapes, compact disks, etc.). Taking place in DC. Signed on 2000-05-15. Completion date: 2000-09-15.
$814,000 with Office of Assistant Secretary for Health except national centers (disused code) for ADP Systems Development Services. Taking place in MD. Signed on 2000-04-15. Completion date: 2000-04-15.
$750,000 with Office of Assistant Secretary for Health except national centers (disused code) for Program Management/Support Services. Taking place in MD. Signed on 2002-09-15. Completion date: 2003-05-15.
$618,000 with Office of Assistant Secretary for Health except national centers (disused code) for Library Services. Taking place in MD. Signed on 2002-10-15. Completion date: 2003-09-15.
TOHONO O'ODHAM UTILITY AUTHORI (HWY 86; small business) 90 employees, $12874122 revenue. Small Disadvantaged Business: $3,077,744 in 36 contractsfrom 2000 to 2006
Contracts for Construction of Structures and Facilities -- Sewage and Waste Facilities, Electric Services, Utilities, Telephone and/or Communications Services (includes Telegraph, Telex, and Cablevision Services), and moreby Public Health Service, Indian Affairs (Assistant Secretary), Office of Policy, Management and Budget/Chief Financial Officer, Bureau of Reclamation, and others Signed by year:2000: $975,000; 2001: $40,000; 2002: $138,727; 2003: $0; 2004: $453,304; 2005: $756,359; 2006: $714,354.
Biggest contracts:
$938,000 with Public Health Service for Construction of Structures and Facilities -- Sewage and Waste Facilities. Signed on 2000-08-15. Completion date: 2001-06-15.
$432,304 with Indian Affairs (Assistant Secretary) for Electric Services. Signed on 2004-01-09. Completion date: 2005-01-09.
$425,175 with Indian Affairs (Assistant Secretary) for Utilities. Signed on 2005-01-11. Effective on 2005-01-01. Completion date: 2006-01-09.
$184,562 with Indian Affairs (Assistant Secretary) for Electric Services. Signed on 2006-07-12. Effective on 2006-08-01. Completion date: 2006-12-31.
TOHONO O'ODHAM NATION, THE (IN (3 MILES W OF SELLS MP 112; small business)
$350,000 with Public Health Service for Construction of Structures and Facilities -- Hospitals and Infirmaries. Signed on 2000-06-15. Completion date: 2001-05-15.
TOHONO O'ODHAM NATION (SELLS BUSINESS LOOP) 900 employees, $0 revenue: $100,000 in 4 contractsfrom 2000 to 2003
$25,000 with Equal Employment Opportunity Commission for Legal Services. Signed on 2003-06-15. Completion date: 2003-09-15.
$25,000 with Equal Employment Opportunity Commission for Other Professional Services. Signed on 2002-06-15. Completion date: 2002-09-15.
$25,000, same as above.Signed on 2001-03-15. Completion date: 2001-09-15.
$25,000 with Equal Employment Opportunity Commission for Legal Services. Signed on 2000-02-15. Completion date: 2000-09-15.
Top industries in this zip code by the number of employees in 2005:
Administrative and Support and Waste Management and Remediation Services: Janitorial Services (100-249 employees: 1 establishment)
Health Care and Social Assistance: General Medical and Surgical Hospitals (100-249: 1)
Educational Services: Junior Colleges (50-99: 1)
Information: Cable and Other Program Distribution (20-49: 1)
Health Care and Social Assistance: Kidney Dialysis Centers (10-19: 1)
Health Care and Social Assistance: Other Individual and Family Services (5-9: 1)
Wholesale Trade: Petroleum and Petroleum Products Merchant Wholesalers (except Bulk Stations and Terminals) (5-9: 1)
Accommodation and Food Services: Food Service Contractors (5-9: 1)
People in group quarters in 2010:
133 people in local jails and other municipal confinement facilities
62 people in nursing facilities/skilled-nursing facilities
27 people in workers' group living quarters and job corps centers
22 people in correctional facilities intended for juveniles
People in group quarters in 2000:
12 people in homes for abused, dependent, and neglected children
11 people in other types of correctional institutions
9 people in unknown juvenile institutions
8 people in other noninstitutional group quarters
3 people in hospitals/wards and hospices for chronically ill
3 people in other hospitals or wards for chronically ill
Fatal accident statistics in 2014:
Fatal accident count: 5
Vehicles involved in fatal accidents: 5
Fatal accidents caused by drunken drivers: 3
Fatalities: 7
Persons involved in fatal accidents: 17
Pedestrians involved in fatal accidents: 0
Fatal accident statistics in 2012:
Fatal accident count: 2
Vehicles involved in fatal accidents: 2
Fatal accidents caused by drunken drivers: 2
Fatalities: 2
Persons involved in fatal accidents: 2
Pedestrians involved in fatal accidents: 0
Home Mortgage Disclosure Act Aggregated Statistics For Year 2009 (Based on 2 full and 2 partial tracts)
A) FHA, FSA/RHS & VA Home Purchase Loans
B) Conventional Home Purchase Loans
C) Refinancings
D) Home Improvement Loans
F) Non-occupant Loans on < 5 Family Dwellings (A B C & D)
G) Loans On Manufactured Home Dwelling (A B C & D)
Number
Average Value
Number
Average Value
Number
Average Value
Number
Average Value
Number
Average Value
Number
Average Value
LOANS ORIGINATED
25
$149,676
19
$115,489
102
$151,974
3
$65,140
6
$103,980
75
$113,747
APPLICATIONS APPROVED, NOT ACCEPTED
2
$218,540
2
$155,290
8
$118,564
0
$0
0
$0
8
$115,108
APPLICATIONS DENIED
4
$98,840
8
$70,225
59
$150,375
7
$35,660
3
$143,427
35
$96,381
APPLICATIONS WITHDRAWN
4
$114,710
4
$139,760
33
$165,972
4
$60,190
3
$142,067
17
$100,255
FILES CLOSED FOR INCOMPLETENESS
3
$127,707
0
$0
6
$181,208
1
$99,290
0
$0
5
$109,632
Aggregated Statistics For Year 2008 (Based on 2 full and 2 partial tracts)
A) FHA, FSA/RHS & VA Home Purchase Loans
B) Conventional Home Purchase Loans
C) Refinancings
D) Home Improvement Loans
F) Non-occupant Loans on < 5 Family Dwellings (A B C & D)
G) Loans On Manufactured Home Dwelling (A B C & D)
Number
Average Value
Number
Average Value
Number
Average Value
Number
Average Value
Number
Average Value
Number
Average Value
LOANS ORIGINATED
35
$139,168
28
$169,513
69
$152,671
5
$85,148
5
$302,508
79
$121,703
APPLICATIONS APPROVED, NOT ACCEPTED
4
$180,680
12
$286,738
15
$124,987
0
$0
4
$192,922
14
$121,964
APPLICATIONS DENIED
13
$165,027
16
$127,406
69
$141,369
14
$59,136
4
$55,768
61
$92,048
APPLICATIONS WITHDRAWN
4
$121,738
7
$176,287
25
$139,103
3
$121,210
2
$294,410
19
$95,333
FILES CLOSED FOR INCOMPLETENESS
1
$118,790
1
$161,860
3
$202,217
1
$16,780
0
$0
3
$158,387
Aggregated Statistics For Year 2007 (Based on 2 full and 2 partial tracts)
A) FHA, FSA/RHS & VA Home Purchase Loans
B) Conventional Home Purchase Loans
C) Refinancings
D) Home Improvement Loans
F) Non-occupant Loans on < 5 Family Dwellings (A B C & D)
G) Loans On Manufactured Home Dwelling (A B C & D)
Number
Average Value
Number
Average Value
Number
Average Value
Number
Average Value
Number
Average Value
Number
Average Value
LOANS ORIGINATED
30
$147,929
68
$174,429
95
$148,173
15
$54,347
15
$155,254
124
$113,699
APPLICATIONS APPROVED, NOT ACCEPTED
5
$150,166
27
$165,373
19
$154,132
5
$57,038
3
$137,380
20
$109,904
APPLICATIONS DENIED
16
$133,456
43
$124,240
115
$123,417
35
$48,308
15
$158,923
113
$90,281
APPLICATIONS WITHDRAWN
3
$158,840
12
$186,990
33
$112,402
5
$73,360
3
$164,283
21
$100,741
FILES CLOSED FOR INCOMPLETENESS
2
$194,510
5
$230,690
10
$163,224
1
$70,730
1
$180,000
5
$166,852
Aggregated Statistics For Year 2006 (Based on 4 full and 2 partial tracts)
A) FHA, FSA/RHS & VA Home Purchase Loans
B) Conventional Home Purchase Loans
C) Refinancings
D) Home Improvement Loans
F) Non-occupant Loans on < 5 Family Dwellings (A B C & D)
G) Loans On Manufactured Home Dwelling (A B C & D)
Number
Average Value
Number
Average Value
Number
Average Value
Number
Average Value
Number
Average Value
Number
Average Value
LOANS ORIGINATED
29
$137,505
160
$155,652
91
$138,232
23
$49,093
23
$175,285
121
$109,281
APPLICATIONS APPROVED, NOT ACCEPTED
2
$167,530
32
$174,175
17
$117,084
6
$57,355
5
$166,580
22
$101,167
APPLICATIONS DENIED
8
$127,972
47
$119,050
124
$119,861
36
$46,495
10
$131,393
97
$91,580
APPLICATIONS WITHDRAWN
5
$137,834
48
$192,589
64
$125,829
5
$82,338
5
$124,412
41
$100,699
FILES CLOSED FOR INCOMPLETENESS
0
$0
10
$248,690
9
$194,257
0
$0
3
$161,863
1
$70,730
Aggregated Statistics For Year 2005 (Based on 4 full and 4 partial tracts)
A) FHA, FSA/RHS & VA Home Purchase Loans
B) Conventional Home Purchase Loans
C) Refinancings
D) Home Improvement Loans
F) Non-occupant Loans on < 5 Family Dwellings (A B C & D)
G) Loans On Manufactured Home Dwelling (A B C & D)
Number
Average Value
Number
Average Value
Number
Average Value
Number
Average Value
Number
Average Value
Number
Average Value
LOANS ORIGINATED
32
$132,605
195
$143,011
106
$127,681
16
$53,152
44
$164,018
140
$89,727
APPLICATIONS APPROVED, NOT ACCEPTED
5
$129,582
35
$147,079
21
$98,879
10
$57,128
11
$131,156
27
$78,874
APPLICATIONS DENIED
5
$86,136
65
$105,760
139
$103,310
35
$46,182
10
$199,067
122
$75,085
APPLICATIONS WITHDRAWN
3
$217,027
42
$151,317
72
$104,975
8
$144,691
12
$133,338
38
$86,993
FILES CLOSED FOR INCOMPLETENESS
0
$0
6
$206,750
34
$100,311
0
$0
0
$0
13
$97,935
Aggregated Statistics For Year 2004 (Based on 4 full and 2 partial tracts)
A) FHA, FSA/RHS & VA Home Purchase Loans
B) Conventional Home Purchase Loans
C) Refinancings
D) Home Improvement Loans
F) Non-occupant Loans on < 5 Family Dwellings (A B C & D)
G) Loans On Manufactured Home Dwelling (A B C & D)
Number
Average Value
Number
Average Value
Number
Average Value
Number
Average Value
Number
Average Value
Number
Average Value
LOANS ORIGINATED
21
$111,666
114
$114,861
96
$115,228
15
$45,219
17
$130,606
121
$79,637
APPLICATIONS APPROVED, NOT ACCEPTED
2
$143,050
23
$79,286
38
$87,649
6
$32,902
3
$62,417
32
$81,995
APPLICATIONS DENIED
7
$110,047
42
$78,677
141
$94,079
30
$33,910
11
$76,939
110
$76,905
APPLICATIONS WITHDRAWN
1
$150,980
29
$142,883
68
$102,954
6
$38,927
4
$112,782
37
$82,935
FILES CLOSED FOR INCOMPLETENESS
2
$98,990
5
$162,408
25
$86,923
2
$79,800
1
$84,790
12
$86,184
Aggregated Statistics For Year 2003 (Based on 4 full and 2 partial tracts)
A) FHA, FSA/RHS & VA Home Purchase Loans
B) Conventional Home Purchase Loans
C) Refinancings
D) Home Improvement Loans
F) Non-occupant Loans on < 5 Family Dwellings (A B C & D)
Number
Average Value
Number
Average Value
Number
Average Value
Number
Average Value
Number
Average Value
LOANS ORIGINATED
19
$118,433
95
$111,532
216
$104,926
12
$25,001
17
$99,748
APPLICATIONS APPROVED, NOT ACCEPTED
4
$89,660
15
$105,098
47
$94,143
4
$26,410
1
$101,560
APPLICATIONS DENIED
6
$115,768
66
$72,292
184
$85,999
21
$26,138
4
$59,055
APPLICATIONS WITHDRAWN
8
$156,876
29
$146,604
87
$101,047
5
$50,146
6
$130,503
FILES CLOSED FOR INCOMPLETENESS
0
$0
5
$175,284
6
$106,548
0
$0
0
$0
Aggregated Statistics For Year 2002 (Based on 2 partial tracts)
A) FHA, FSA/RHS & VA Home Purchase Loans
B) Conventional Home Purchase Loans
C) Refinancings
D) Home Improvement Loans
F) Non-occupant Loans on < 5 Family Dwellings (A B C & D)
Number
Average Value
Number
Average Value
Number
Average Value
Number
Average Value
Number
Average Value
LOANS ORIGINATED
18
$105,441
102
$106,460
158
$94,752
5
$19,496
16
$96,546
APPLICATIONS APPROVED, NOT ACCEPTED
0
$0
15
$79,527
33
$92,851
3
$35,063
2
$46,020
APPLICATIONS DENIED
3
$97,330
37
$92,763
122
$84,180
17
$20,776
6
$62,797
APPLICATIONS WITHDRAWN
2
$119,245
14
$98,194
57
$91,976
4
$23,350
5
$105,642
FILES CLOSED FOR INCOMPLETENESS
1
$67,100
2
$86,145
10
$88,141
0
$0
0
$0
Aggregated Statistics For Year 2001 (Based on 2 partial tracts)
A) FHA, FSA/RHS & VA Home Purchase Loans
B) Conventional Home Purchase Loans
C) Refinancings
D) Home Improvement Loans
F) Non-occupant Loans on < 5 Family Dwellings (A B C & D)
Number
Average Value
Number
Average Value
Number
Average Value
Number
Average Value
Number
Average Value
LOANS ORIGINATED
31
$119,625
98
$90,921
142
$88,039
7
$27,851
24
$107,890
APPLICATIONS APPROVED, NOT ACCEPTED
3
$116,673
20
$73,383
25
$70,241
3
$27,960
5
$59,486
APPLICATIONS DENIED
2
$113,125
35
$66,222
112
$69,969
9
$22,821
5
$58,036
APPLICATIONS WITHDRAWN
1
$125,590
15
$93,038
57
$89,662
5
$21,400
1
$81,160
FILES CLOSED FOR INCOMPLETENESS
2
$87,735
4
$91,812
8
$103,205
0
$0
0
$0
Aggregated Statistics For Year 2000 (Based on 2 partial tracts)
A) FHA, FSA/RHS & VA Home Purchase Loans
B) Conventional Home Purchase Loans
C) Refinancings
D) Home Improvement Loans
F) Non-occupant Loans on < 5 Family Dwellings (A B C & D)
Number
Average Value
Number
Average Value
Number
Average Value
Number
Average Value
Number
Average Value
LOANS ORIGINATED
33
$109,365
126
$84,221
60
$72,884
10
$34,232
12
$73,111
APPLICATIONS APPROVED, NOT ACCEPTED
4
$87,052
30
$72,982
22
$66,320
8
$17,966
2
$58,035
APPLICATIONS DENIED
6
$84,408
77
$58,807
82
$68,839
21
$20,640
6
$49,193
APPLICATIONS WITHDRAWN
7
$104,541
17
$111,003
25
$81,721
2
$29,020
1
$48,970
FILES CLOSED FOR INCOMPLETENESS
1
$76,620
5
$58,670
12
$95,970
0
$0
0
$0
Aggregated Statistics For Year 1999 (Based on 2 partial tracts)
A) FHA, FSA/RHS & VA Home Purchase Loans
B) Conventional Home Purchase Loans
C) Refinancings
D) Home Improvement Loans
F) Non-occupant Loans on < 5 Family Dwellings (A B C & D)


 Nearest zip codes: 85736, 85633, 85735, 85321, 85653, 85123.