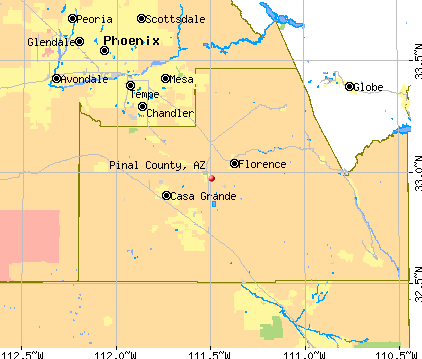
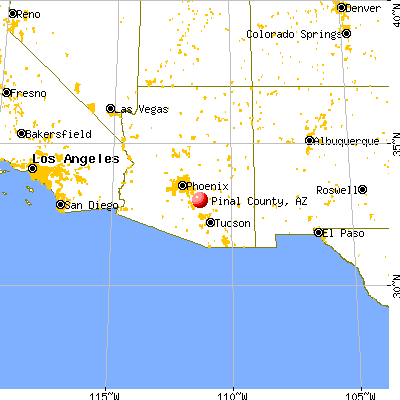
Pinal County, Arizona (AZ)
County owner-occupied free and clear houses and condos in 2010: 27,863
County owner-occupied houses and condos in 2000: 47,522
Renter-occupied apartments: 29,961 (it was 13,842 in 2000)
| % of renters here: | 23% |
| State: | 34% |
Land area: 5370 sq. mi.
Water area: 4.5 sq. mi.
Population density: 86 people per square mile (average).
Industries providing employment: Educational, health and social services (19.7%), Retail trade (12.4%).
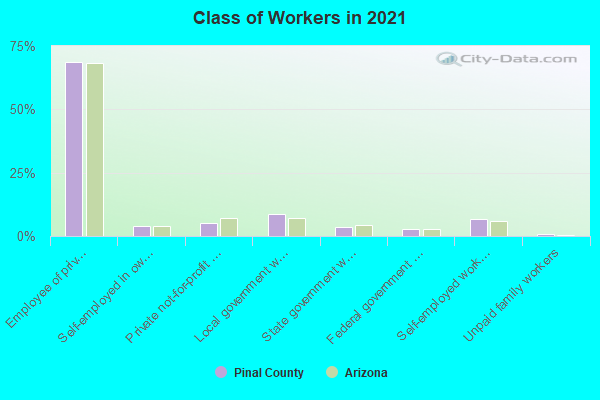
Type of workers:
- Private wage or salary: 80%
- Government: 15%
- Self-employed, not incorporated: 5%
- Unpaid family work: 0%
- OSM Map
- General Map
- Google Map
- MSN Map

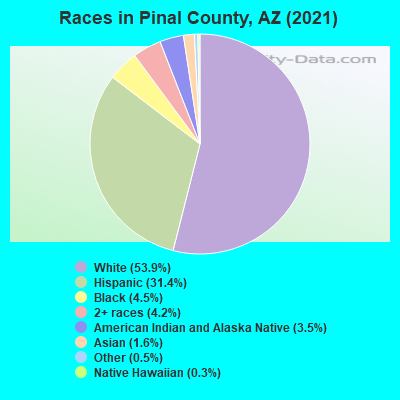
- 249,14353.7%White Non-Hispanic Alone
- 147,27431.7%Hispanic or Latino
- 21,4154.6%Black Non-Hispanic Alone
- 20,7544.5%Two or more races
- 15,1463.3%American Indian and Alaska Native alone
- 7,7431.7%Asian alone
- 1,4850.3%Some other race alone
- 1,1940.3%Native Hawaiian and Other
Pacific Islander alone
| Median resident age: | 39.6 years |
| Arizona median age: | 38.8 years |
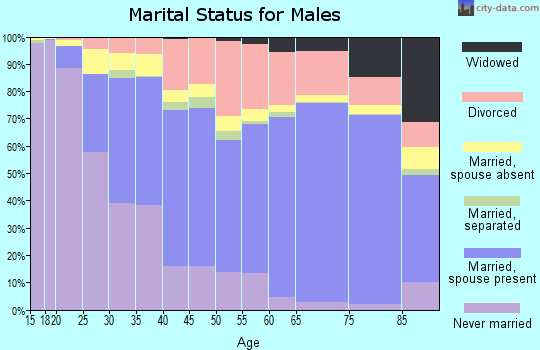
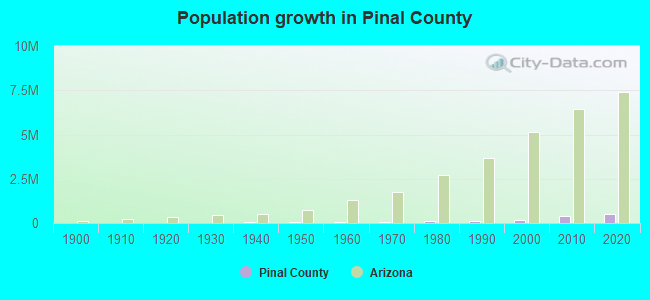
| Males: 240,400 | |
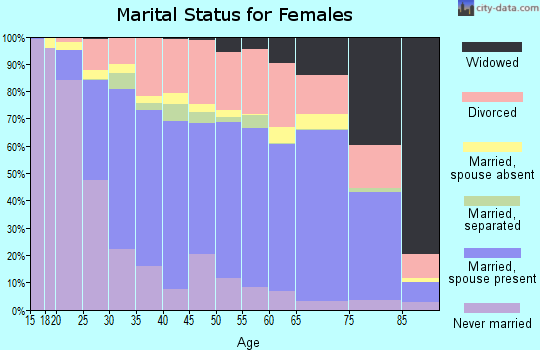
| Females: 223,754 |

 | HB 2787: The bill to split Maricopa County into 4 (130 replies) |
| Nikola Motors Merger Complete! Pinal County Will Benefit (14 replies) |
| Good "must read" article on Arizona's water woes- Pinal County (1 reply) |
| pinal county arizona (4 replies) |
| pinal county (3 replies) |
| Proposed Pinal County Road Tax (19 replies) |
| Pinal County: | 2.0 people |
| Arizona: | 3 people |
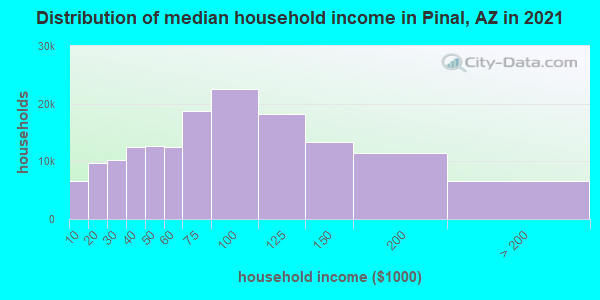
Estimated median household income in 2022: $76,377 ($35,856 in 1999)
| This county: | $76,377 |
| Arizona: | $74,568 |
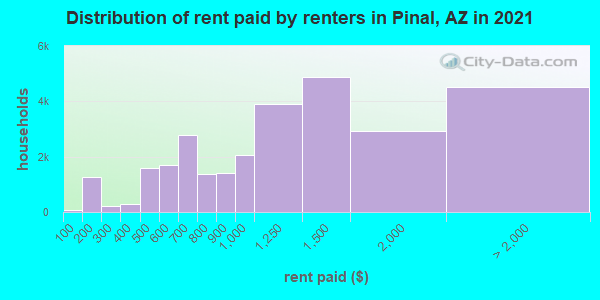
Median contract rent in 2022 for apartments: $1,340 (lower quartile is $799, upper quartile is $1,706)
| This county: | $1340 |
| State: | $1291 |
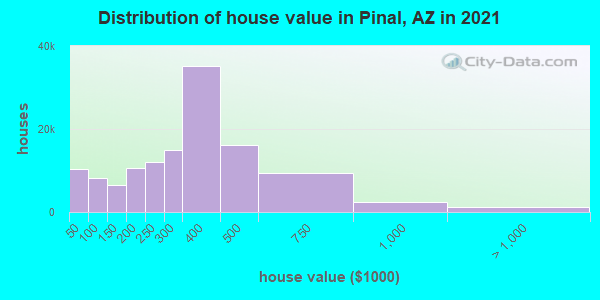
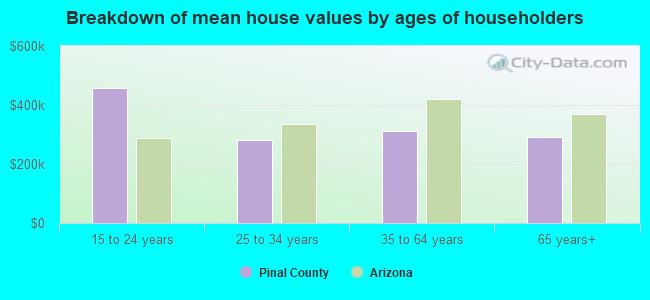
Estimated median house or condo value in 2022: $363,300 (it was $76,300 in 2000)
| Pinal: | $363,300 |
| Arizona: | $402,800 |
Mean price in 2022:
Median monthly housing costs for homes and condos with a mortgage: $1,498Detached houses: $401,295
Here: $401,295 State: $521,408 Townhouses or other attached units: $377,545
Here: $377,545 State: $387,465 In 3-to-4-unit structures: $156,793
Here: $156,793 State: $342,505 In 5-or-more-unit structures: $149,086
Here: $149,086 State: $371,286 Mobile homes: $148,281
Here: $148,281 State: $141,516 Occupied boats, RVs, vans, etc.: $144,602
Here: $144,602 State: $60,504
Median monthly housing costs for units without a mortgage: $450
Institutionalized population: 25,583
Crime in 2021 (reported by the sheriff's office or county police, not the county total):
- Murders: 6
- Rapes: 9
- Robberies: 11
- Assaults: 285
- Burglaries: 299
- Thefts: 1015
- Auto thefts: 217
Crime in 2020 (reported by the sheriff's office or county police, not the county total):
- Murders: 7
- Rapes: 2
- Robberies: 18
- Assaults: 242
- Burglaries: 328
- Thefts: 921
- Auto thefts: 189
Health of residents in Pinal County based on CDC Behavioral Risk Factor Surveillance System Survey Questionnaires from 2013 to 2021:
General health status score of residents in this county from 1 (poor) to 5 (excellent) is 3.5. This is about average.73.9% of residents exercised in the past month. This is about average.
42.8% of residents smoked 100+ cigarettes in their lives. This is about average.
53.6% of adult residents drank alcohol in the past 30 days. This is less than average.
67.3% of residents visited a dentist within the past year. This is about average.
Average weight of males is 198 pounds. This is about average.
Average weight of females is 160 pounds. This is about average.
Health of residents in Pinal County based on CDC Behavioral Risk Factor Surveillance System Survey Questionnaires from 2003 to 2012:
General health status score of residents in this county from 1 (poor) to 5 (excellent) is 3.4. This is about average.72.2% of residents exercised in the past month. This is about average.
52.0% of residents smoked 100+ cigarettes in their lives. This is more than average.
85.3% of adult residents drank alcohol in the past 30 days. This is more than average.
61.5% of residents visited a dentist within the past year. This is less than average.
Average weight of males is 197 pounds. This is about average.
Average weight of females is 160 pounds. This is about average.
43.6% of residents keep firearms around their homes. This is more than average.
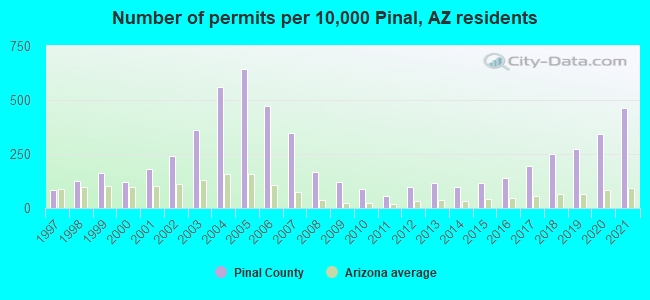
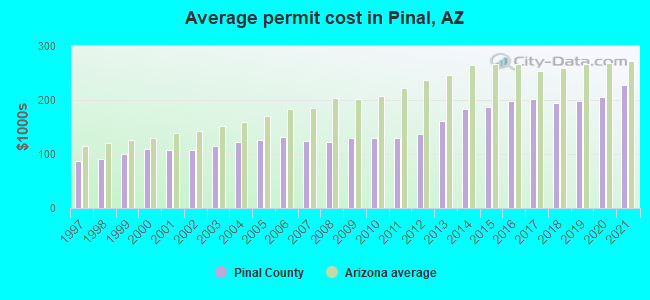
Single-family new house construction building permits:
- 2022: 6249 buildings, average cost: $223,900
- 2021: 8278 buildings, average cost: $227,400
- 2020: 6132 buildings, average cost: $205,200
- 2019: 4951 buildings, average cost: $198,600
- 2018: 4457 buildings, average cost: $193,500
- 2017: 3475 buildings, average cost: $201,300
- 2016: 2543 buildings, average cost: $197,700
- 2015: 2087 buildings, average cost: $186,500
- 2014: 1721 buildings, average cost: $184,000
- 2013: 2124 buildings, average cost: $161,200
- 2012: 1742 buildings, average cost: $136,600
- 2011: 974 buildings, average cost: $129,400
- 2010: 1597 buildings, average cost: $129,500
- 2009: 2182 buildings, average cost: $130,400
- 2008: 3014 buildings, average cost: $122,800
- 2007: 6221 buildings, average cost: $124,200
- 2006: 8470 buildings, average cost: $131,100
- 2005: 11586 buildings, average cost: $126,200
- 2004: 10041 buildings, average cost: $121,900
- 2003: 6516 buildings, average cost: $114,400
- 2002: 4317 buildings, average cost: $107,600
- 2001: 3259 buildings, average cost: $107,400
- 2000: 2183 buildings, average cost: $109,100
- 1999: 2905 buildings, average cost: $99,500
- 1998: 2237 buildings, average cost: $91,100
- 1997: 1471 buildings, average cost: $87,100
Median real estate property taxes paid for housing units with mortgages in 2022: $1,690 (0.4%)
Median real estate property taxes paid for housing units with no mortgage in 2022: $1,250 (0.4%)
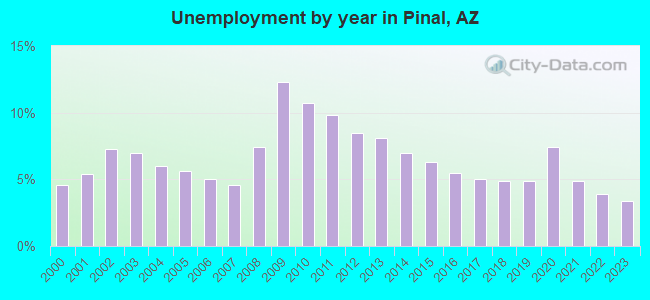
| Pinal County: | 11.0% |
| Arizona: | 12.5% |
Median age of residents in 2022: 39.6 years old
(Males: 37.8 years old, Females: 41.5 years old)
(Median age for: White residents: 50.3 years old, Black residents: 42.4 years old, American Indian residents: 27.6 years old, Asian residents: 38.9 years old, Hispanic or Latino residents: 30.2 years old, Other race residents: 32.1 years old)
Area name: Phoenix-Mesa-Scottsdale, AZ MSA
Fair market rent in 2006 for a 1-bedroom apartment in Pinal County is $638 a month.
Fair market rent for a 2-bedroom apartment is $770 a month.
Fair market rent for a 3-bedroom apartment is $1122 a month.
Cities in this county include: San Tan Valley, North Pinal, Apache Junction, Casa Grande, Florence, Eloy, Saddlebrooke, Gila River, Coolidge, Gold Camp.
2023 air pollution in Pinal County:
Ozone (1-hour): 0.043 ppm (standard limit: 0.12 ppm). Above U.S. average.
Particulate Matter (PM10) Annual: 29.0 µg/m3. Above U.S. average.
Particulate Matter (PM2.5) Annual: 5.2 µg/m3(standard limit: 15.0 µg/m3). Below U.S. average.
Notable locations in this county outside city limits:
Notable locations in Pinal County: Filibusters Camp (A), Adonde (B), Harwood (C), Blalack (D), Gila Center (E), Green Cabin (F), Horn Cotton Gin (G), Radium Hot Springs (H), White Wing Ranch (I), Wilbanks Cabin (J), Redondo Ruins (K), University of Arizona Agricultural Experiment Station (L), Somerton Siding (M), Stone Cabin (N), South Yuma County Landfill (O), Copper Mountain Landfill (P), Cocopah Recreational Vehicle Resort (Q), Terry Ranch (R), Del Pueblo Recreational Vehicle Park (S), The Links at Coyote Wash (T). Display/hide their locations on the map
Churches in Pinal County include: Saint Joseph the Worker Catholic Church (A), Generations Church (B), Calvary Temple of Christ (C), Calvary Chapel of Yuma (D). Display/hide their locations on the map
Cemeteries: Laguna Cemetery (1), O'Neills Grave (2). Display/hide their locations on the map
Lakes and reservoirs: Red Hill Tank (A), Eagle Tank (B), Figueroa Tank (C), Frenchman Tank (D), Gray Tanks (E), Heart Tank (F), Hidden Valley Tanks (G), High Tank (H). Display/hide their locations on the map
Streams, rivers, and creeks: Growler Wash (A), Gravel Wash (B), Muggins Wash (C), Deadman Wash (D), San Cristobal Wash (E), McPherson Wash (F), Red Raven Wash (G), McAllister Wash (H), Fortuna Wash (I). Display/hide their locations on the map
Parks in Pinal County include: Cabeza Prieta Game Range (1), Mittry Lake Wildlife Area (2), Kofa Game Range (3), Fort Horn Monument (4), Virgin Peak (5). Display/hide their locations on the map
Neighboring counties: Callahan County, Texas  , Lamar County, Alabama , Marion County, Alabama , Wise County, Texas .
| Here: | 4.0% |
| Arizona: | 3.8% |
Current college students: 6,840
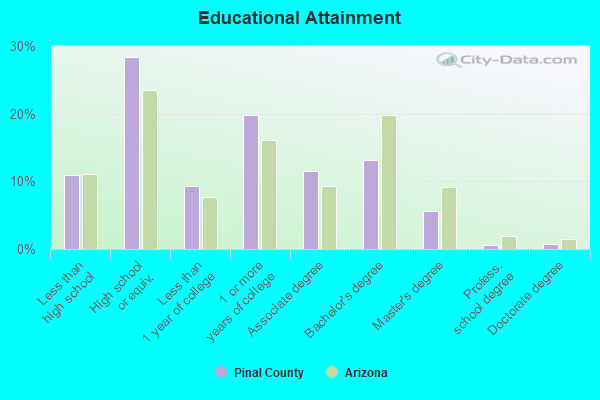
People 25 years of age or older with a high school degree or higher: 88.7%
People 25 years of age or older with a bachelor's degree or higher: 22.9%
Number of foreign born residents: 46,485 (42.4% naturalized citizens)
| Pinal County: | 10.0% |
| Whole state: | 13.1% |
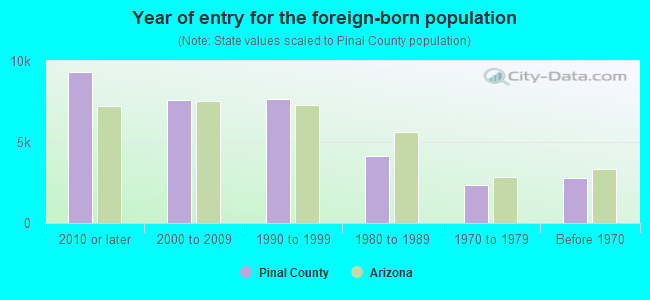
- Year of entry for the foreign-born population
- 11,5952010 or later
- 8,4192000 to 2009
- 7,5451990 to 1999
- 4,1421980 to 1989
- 2,3211970 to 1979
- 2,751Before 1970
Mean travel time to work (commute): minutes
Percentage of county residents living and working in this county: 99.0%
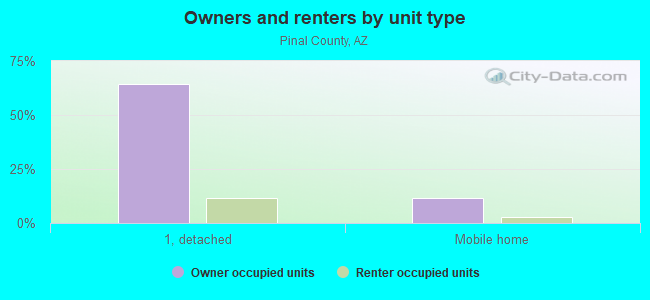
Housing units in structures:
- One, detached: 143,087
- One, attached: 3,747
- Two: 1,108
- 3 or 4: 1,584
- 5 to 9: 1,549
- 10 to 19: 1,129
- 20 to 49: 684
- 50 or more: 588
- Mobile homes: 30,252
- Boats, RVs, vans, etc.: 1,945
Housing units in Pinal County with a mortgage: 83,949 (3,730 second mortgage, 174 home equity loan, 2,966 both second mortgage and home equity loan)
Houses without a mortgage: 1,045
| Here: | 98.8% with mortgage |
| State: | 98.6% with mortgage |
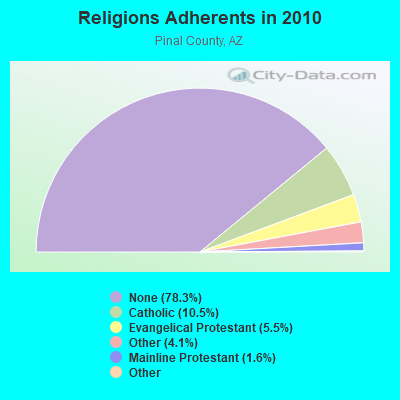
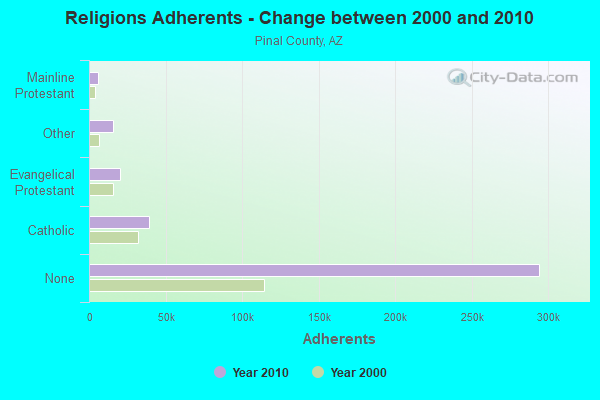
Religion statistics for Pinal County
| Religion | Adherents | Congregations |
|---|---|---|
| Catholic | 39,268 | 20 |
| Evangelical Protestant | 20,514 | 155 |
| Other | 15,394 | 45 |
| Mainline Protestant | 5,869 | 21 |
| Black Protestant | 369 | 3 |
| Orthodox | 200 | 1 |
| None | 294,156 | - |
Source: Clifford Grammich, Kirk Hadaway, Richard Houseal, Dale E.Jones, Alexei Krindatch, Richie Stanley and Richard H.Taylor. 2012. 2010 U.S.Religion Census: Religious Congregations & Membership Study. Association of Statisticians of American Religious Bodies. Jones, Dale E., et al. 2002. Congregations and Membership in the United States 2000. Nashville, TN: Glenmary Research Center.
Food Environment Statistics:
| Pinal County: | 1.13 / 10,000 pop. |
| State: | 1.36 / 10,000 pop. |
| Here: | 0.10 / 10,000 pop. |
| Arizona: | 0.14 / 10,000 pop. |
| This county: | 0.37 / 10,000 pop. |
| Arizona: | 0.55 / 10,000 pop. |
| Pinal County: | 1.99 / 10,000 pop. |
| Arizona: | 2.47 / 10,000 pop. |
| This county: | 3.56 / 10,000 pop. |
| State: | 6.21 / 10,000 pop. |
| Pinal County: | 8.0% |
| Arizona: | 8.0% |
| Pinal County: | 28.1% |
| State: | 22.8% |
| Here: | 12.4% |
| State: | 14.2% |
Agriculture in Pinal County:
Average size of farms: 1691 acresAverage value of agricultural products sold per farm: $618,280
Average value of crops sold per acre for harvested cropland: $856.00
The value of livestock, poultry, and their products as a percentage of the total market value of agricultural products sold: 58.16%
Average total farm production expenses per farm: $544,342
Harvested cropland as a percentage of land in farms: 17.88%
Irrigated harvested cropland as a percentage of land in farms: 100.00%
Average market value of all machinery and equipment per farm: $167,989
The percentage of farms operated by a family or individual: 69.29%
Average age of principal farm operators: 52 years
Average number of cattle and calves per 100 acres of all land in farms: 20.78
Milk cows as a percentage of all cattle and calves: 8.83%
Corn for grain: 617 harvested acres
All wheat for grain: 27508 harvested acres
Upland cotton: 91167 harvested acres
Vegetables: 7,593 harvested acres
Tornado activity:
Pinal County historical area-adjusted tornado activity is significantly below Arizona state average. It is 88705686.6 times below overall U.S. average.Tornadoes in this county have caused one injury recorded between 1950 and 2004.
On 8/17/1959, a category 2 (max. wind speeds 113-157 mph) tornado injured one person and caused between $50,000 and $500,000 in damages.
Earthquake activity:
Pinal County-area historical earthquake activity is significantly above Arizona state average. It is 1978% greater than the overall U.S. average.On 6/28/1992 at 11:57:34, a magnitude 7.6 (6.2 MB, 7.6 MS, 7.3 MW, Depth: 0.7 mi, Class: Major, Intensity: VIII - XII) earthquake occurred 302.0 miles away from Pinal County center, causing 3 deaths (1 shaking deaths, 2 other deaths) and 400 injuries, causing $100,000,000 total damage and $40,000,000 insured losses
On 5/19/1940 at 04:36:40, a magnitude 7.2 (7.2 UK) earthquake occurred 243.9 miles away from the county center, causing $33,000,000 total damage
On 10/16/1999 at 09:46:44, a magnitude 7.4 (6.3 MB, 7.4 MS, 7.2 MW, 7.3 ML) earthquake occurred 303.5 miles away from the county center
On 12/31/1934 at 18:45:56, a magnitude 7.1 (7.1 UK) earthquake occurred 248.5 miles away from the county center
On 10/15/1979 at 23:16:54, a magnitude 7.0 (5.7 MB, 6.9 MS, 7.0 ML, 6.4 MW) earthquake occurred 240.7 miles away from Pinal County center
On 7/21/1952 at 11:52:14, a magnitude 7.7 (7.7 UK) earthquake occurred 452.5 miles away from the county center, causing $50,000,000 total damage
Magnitude types: body-wave magnitude (MB), local magnitude (ML), surface-wave magnitude (MS), moment magnitude (MW)
Most recent natural disasters:
- Arizona Covid-19 Pandemic, Incident Period: January 20, 2020, FEMA Id: 4524, Natural disaster type: Other
- Arizona Severe Storms and Flooding, Incident Period: July 25, 2006 to August 04, 2006, Major Disaster (Presidential) Declared DR-1660: September 07, 2006, FEMA Id: 1660, Natural disaster type: Storm, Flood
- Arizona Hurricane Katrina Evacuation, Incident Period: August 29, 2005 to October 01, 2005, Emergency Declared EM-3241: September 12, 2005, FEMA Id: 3241, Natural disaster type: Hurricane
- Arizona Vekol Fire, Incident Period: May 26, 2005 to May 29, 2005, Fire Management Assistance Declared: May 26, 2005, FEMA Id: 2558, Natural disaster type: Fire
- Arizona Severe Storms and Flooding, Incident Period: February 10, 2005 to February 15, 2005, Major Disaster (Presidential) Declared DR-1586: April 14, 2005, FEMA Id: 1586, Natural disaster type: Storm, Flood
- Arizona Aspen Fire, Incident Period: June 17, 2003 to July 15, 2003, Fire Management Assistance Declared: June 18, 2003, FEMA Id: 2470, Natural disaster type: Fire
- Arizona Oracle Hill Fire, Incident Period: July 12, 2002 to July 17, 2002, Fire Management Assistance Declared: July 14, 2002, FEMA Id: 2439, Natural disaster type: Fire
- Arizona Severe Storms And Flooding, Incident Period: October 21, 2000 to November 08, 2000, Major Disaster (Presidential) Declared DR-1347: October 27, 2000, FEMA Id: 1347, Natural disaster type: Storm, Flood
- Arizona Severe Storms, Tornadoes, Flooding, Incident Period: January 05, 1993 to March 06, 1993, Major Disaster (Presidential) Declared DR-977: January 19, 1993, FEMA Id: 977, Natural disaster type: Storm, Tornado, Flood
- Arizona Flooding, Severe Storm, Incident Period: July 08, 1990 to September 14, 1990, Major Disaster (Presidential) Declared DR-884: December 06, 1990, FEMA Id: 884, Natural disaster type: Storm, Flood
- 5 other natural disasters have been reported since 1953.
The number of natural disasters in Pinal County (15) is near the US average (15).
Major Disasters (Presidential) Declared: 9
Emergencies Declared: 2
Causes of natural disasters: Floods: 9, Storms: 8, Fires: 3, Drought: 1, Hurricane: 1, Tornado: 1, Other: 1 (Note: some incidents may be assigned to more than one category).
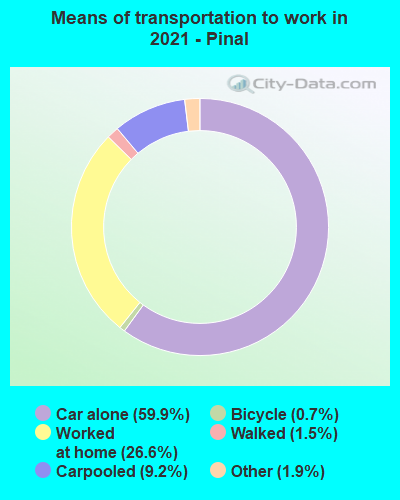
Means of transportation to work:
- Drove a car alone: 72,363 (62.5%)
- Carpooled: 11,752 (10.1%)
- Bus: 154 (0.1%)
- Long-distance train or commuter rail: 4 (0.0%)
- Ferryboat: 13 (0.0%)
- Taxicab, motorcycle, or other means: 2,110 (1.8%)
- Bicycle: 664 (0.6%)
- Walked: 1,896 (1.6%)
- Worked at home: 29,303 (25.3%)

- Health care and social assistance (17%)
- Educational services (10%)
- Retail trade (10%)
- Accommodation and food services (7%)
- Manufacturing (5%)
- Public administration (5%)
- Finance and insurance (4%)
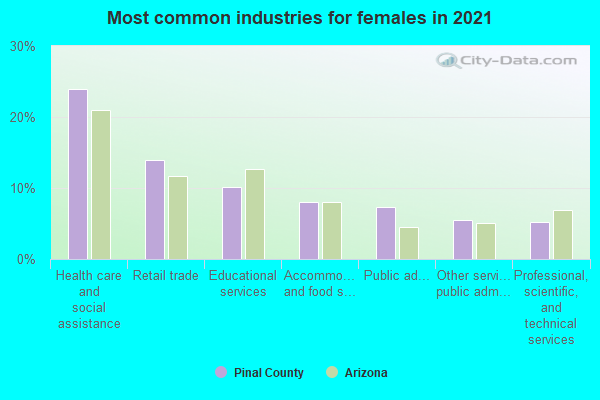
- Health care and social assistance (22%)
- Educational services (13%)
- Retail trade (13%)
- Accommodation and food services (9%)
- Manufacturing (7%)
- Public administration (6%)
- Finance and insurance (5%)
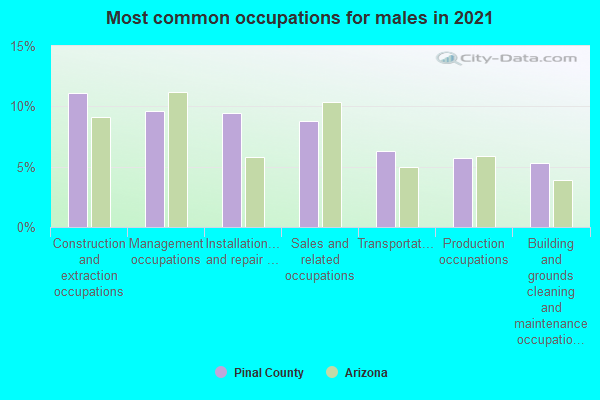
- Construction and extraction occupations (12%)
- Sales and related occupations (11%)
- Management occupations (9%)
- Production occupations (8%)
- Transportation occupations (8%)
- Installation, maintenance, and repair occupations (6%)
- Material moving occupations (5%)
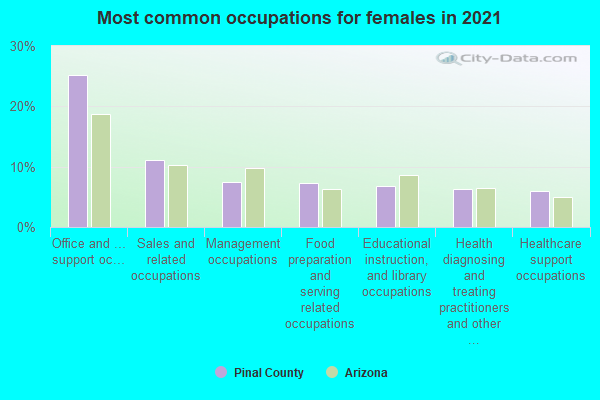
- Office and administrative support occupations (18%)
- Management occupations (11%)
- Sales and related occupations (9%)
- Educational instruction, and library occupations (9%)
- Business and financial operations occupations (7%)
- Health diagnosing and treating practitioners and other technical occupations (6%)
- Food preparation and serving related occupations (6%)
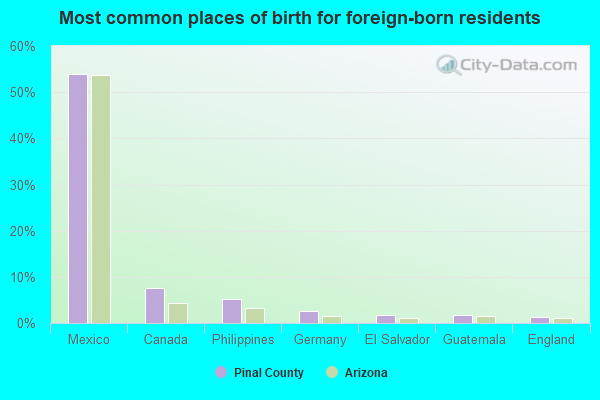
- Mexico (56%)
- Nicaragua (7%)
- Canada (7%)
- Philippines (5%)
- Germany (2%)
- India (2%)
- Cuba (1%)
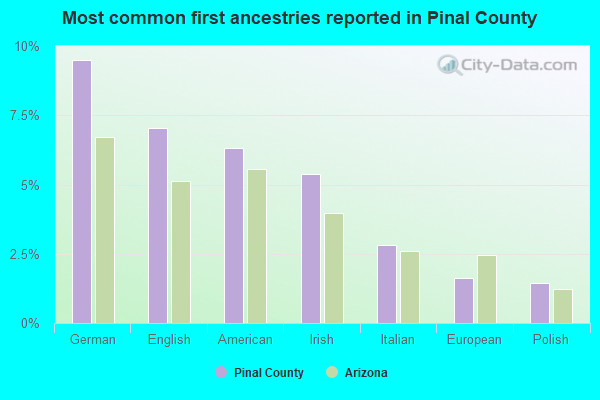
- German (9%)
- American (7%)
- English (6%)
- Irish (6%)
- Italian (3%)
- European (2%)
- Polish (1%)
People in group quarters in Pinal County, Arizona in 2010:
- 12,312 people in federal detention centers
- 11,567 people in state prisons
- 1,288 people in local jails and other municipal confinement facilities
- 315 people in group homes intended for adults
- 205 people in nursing facilities/skilled-nursing facilities
- 144 people in other noninstitutional facilities
- 118 people in correctional facilities intended for juveniles
- 85 people in college/university student housing
- 59 people in residential treatment centers for adults
- 55 people in correctional residential facilities
- 42 people in workers' group living quarters and job corps centers
- 38 people in group homes for juveniles (non-correctional)
- 17 people in emergency and transitional shelters (with sleeping facilities) for people experiencing homelessness
People in group quarters in Pinal County, Arizona in 2000:
- 10,014 people in state prisons
- 1,698 people in federal prisons and detention centers
- 1,453 people in other types of correctional institutions
- 387 people in local jails and other confinement facilities (including police lockups)
- 323 people in college dormitories (includes college quarters off campus)
- 274 people in homes or halfway houses for drug/alcohol abuse
- 218 people in homes for the mentally retarded
- 218 people in other noninstitutional group quarters
- 168 people in homes for the physically handicapped
- 124 people in nursing homes
- 73 people in unknown juvenile institutions
- 73 people in agriculture workers' dormitories on farms
- 61 people in hospitals or wards for drug/alcohol abuse
- 58 people in short-term care, detention or diagnostic centers for delinquent children
- 43 people in other group homes
- 25 people in religious group quarters
- 9 people in homes for the mentally ill
- 8 people in residential treatment centers for emotionally disturbed children
- 3 people in other nonhousehold living situations
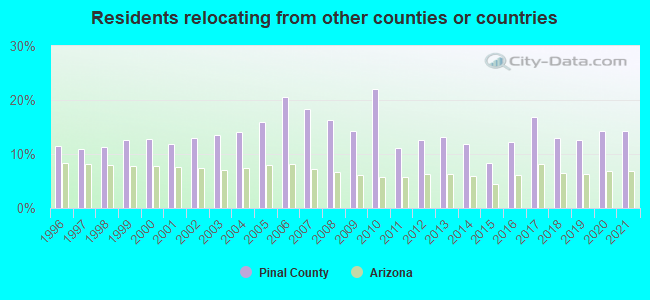
14.18% of this county's 2021 resident taxpayers lived in other counties in 2020 ($62,767 average adjusted gross income)
| Here: | 14.18% |
| Arizona average: | 6.85% |
0.02% of residents moved from foreign countries ($82 average AGI)
Pinal County: 0.02% Arizona average: 0.03%
8.27% relocated from other counties in Arizona ($31,092 average AGI)
5.89% relocated from other states ($31,593 average AGI)
Pinal County: 5.89% Arizona average: 4.90%
Top counties from which taxpayers relocated into this county between 2020 and 2021:
| from Maricopa County, AZ | |
| from Pima County, AZ | |
| from Los Angeles County, CA | |
| from San Diego County, CA | |
| from Riverside County, CA | |
| from Orange County, CA | |
| from San Bernardino County, CA |
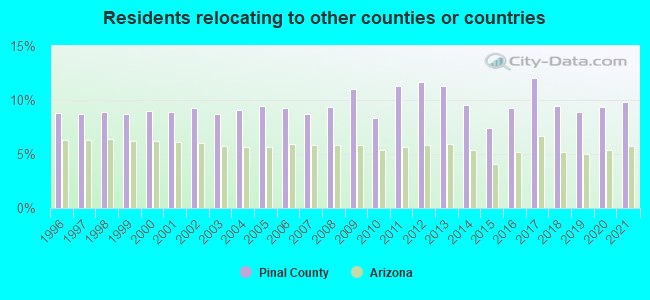
9.81% of this county's 2020 resident taxpayers moved to other counties in 2021 ($54,187 average adjusted gross income)
| Here: | 9.81% |
| Arizona average: | 5.72% |
0.02% of residents moved to foreign countries ($91 average AGI)
Pinal County: 0.02% Arizona average: 0.03%
5.88% relocated to other counties in Arizona ($31,415 average AGI)
3.91% relocated to other states ($22,681 average AGI)
Pinal County: 3.91% Arizona average: 3.76%
Top counties to which taxpayers relocated from this county between 2020 and 2021:
| to Maricopa County, AZ | |
| to Pima County, AZ | |
| to Navajo County, AZ | |
| to Yavapai County, AZ | |
| to Gila County, AZ | |
| to Cochise County, AZ | |
| to Clark County, NV |
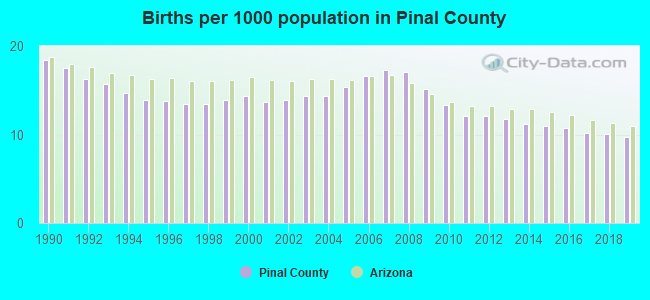
Births per 1000 population from 1990 to 1999: 15.1
Births per 1000 population from 2000 to 2009: 15.2
Births per 1000 population from 2010 to 2022: 9.4
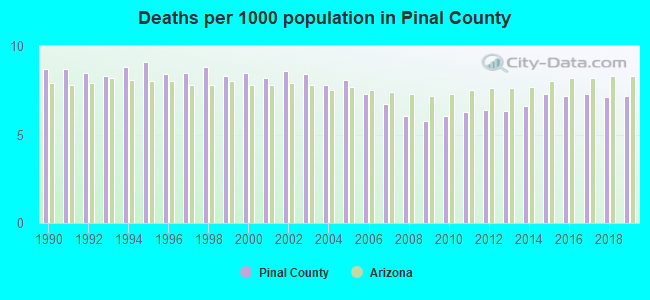
Deaths per 1000 population from 1990 to 1999: 8.6
Deaths per 1000 population from 2000 to 2009: 7.5
Deaths per 1000 population from 2010 to 2020: 7.0
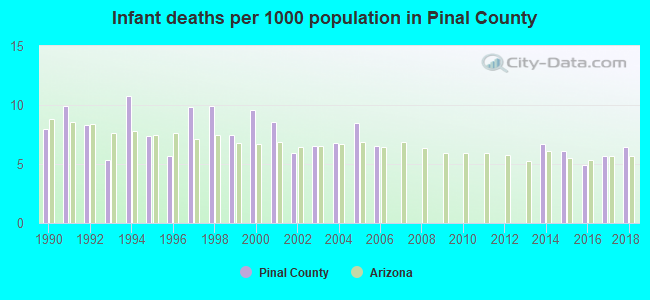
Infant deaths per 1000 live births from 1990 to 1999: 8.3
Infant deaths per 1000 live births from 2000 to 2009: 5.2
Infant deaths per 1000 live births from 2010 to 2021: 3.8
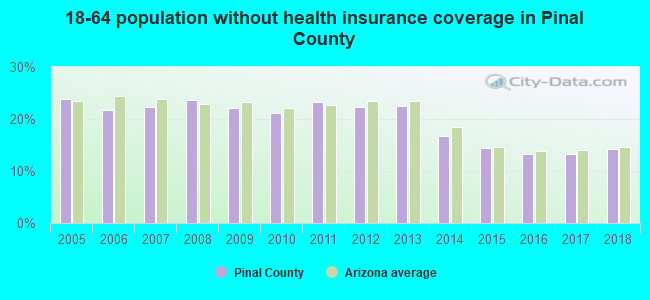
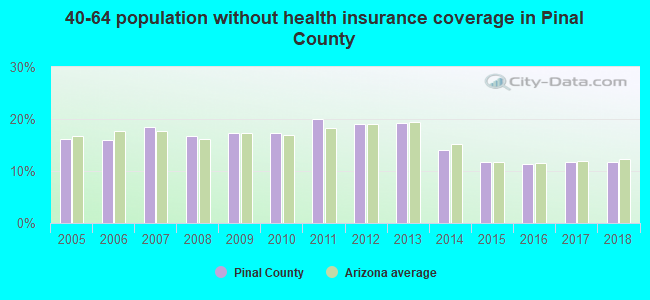
Persons under 19 years old without health insurance coverage in 2018: 8.1%

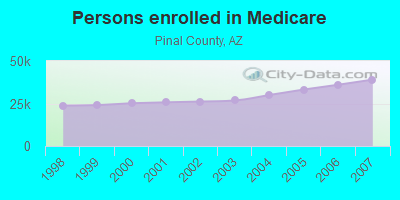
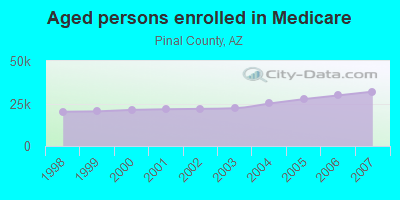
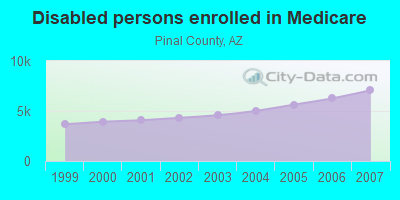
Persons enrolled in hospital insurance and/or supplemental medical insurance (Medicare) in July 1, 2007: 39,051 (31,969 aged, 7,082 disabled)
Children under 18 without health insurance coverage in 2007: 10,572 (12%)
Most common underlying causes of death in Pinal County, Arizona in 1999 - 2019:
- Atherosclerotic heart disease (3,364)
- Bronchus or lung, unspecified - Malignant neoplasms (2,927)
- Chronic obstructive pulmonary disease, unspecified (2,760)
- Acute myocardial infarction, unspecified (1,842)
- Alzheimer disease, unspecified (1,496)
- Atherosclerotic cardiovascular disease, so described (1,468)
- Stroke, not specified as haemorrhage or infarction (976)
- Colon, unspecified - Malignant neoplasms (803)
- Unspecified diabetes mellitus, without complications (788)
- Pancreas, unspecified - Malignant neoplasms (761)
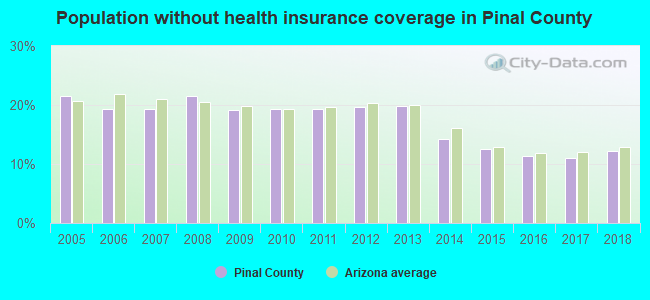
Population without health insurance coverage in 2000: 19%
Children under 18 without health insurance coverage in 2000: 16%
Homicides per 1,000,000 population from 2000 to 2006: 84.5. This is less than state average.
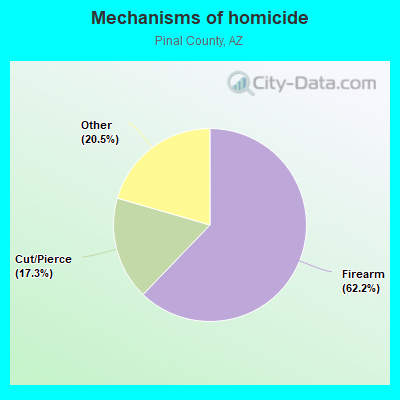
- Firearm - 52.5
- Cut/Pierce - 14.6
- Other - 17.3
Suicides per 1,000,000 population from 2000 to 2006: 166.3. This is less than state average.
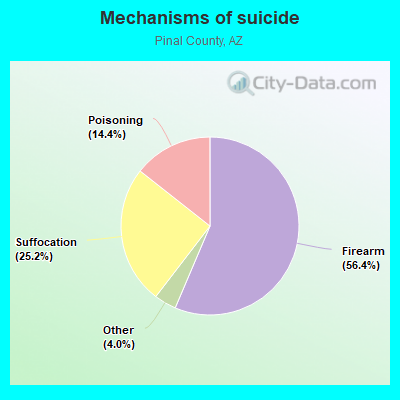
- Firearm - 93.8
- Suffocation - 41.9
- Poisoning - 23.9
- Other - 6.7
Household type by relationship:
Households: 464,154- Male householders: 81,848 (17,814 living alone), Female householders: 82,433 (19,280 living alone)
87,715 spouses (86,852 opposite-sex spouses), 14,698 unmarried partners, (13,987 opposite-sex unmarried partners), 130,780 children (119,540 natural, 4,073 adopted, 7,167 stepchildren), 12,153 grandchildren, 6,496 brothers or sisters, 7,171 parents, 1,487 foster children, 13,194 other relatives, 11,139 non-relatives
- In group quarters: 15,040
Size of family households: 55,504 2-persons, 21,925 3-persons, 16,773 4-persons, 12,161 5-persons, 6,558 6-persons, 4,815 7-or-more-persons.
Size of nonfamily households: 37,094 1-person, 7,998 2-persons, 755 3-persons, 423 4-persons, 275 5-persons.
61,929 married couples with children.
24,481 single-parent households (10,087 men, 14,394 women).
80.4% of residents of Pinal speak English at home.
16.6% of residents speak Spanish at home (70% speak English very well, 14% speak English well, 10% speak English not well, 6% don't speak English at all).
0.9% of residents speak other Indo-European language at home (74% speak English very well, 19% speak English well, 3% speak English not well, 4% don't speak English at all).
1.2% of residents speak Asian or Pacific Island language at home (65% speak English very well, 26% speak English well, 7% speak English not well, 2% don't speak English at all).
1.1% of residents speak other language at home (87% speak English very well, 11% speak English well, 2% speak English not well).
In fiscal year 2004:
Federal Government expenditure: $1,141,253,000 ($5,324 per capita)
Department of Defense expenditure: $28,964,000
Federal direct payments to individuals for retirement and disability: $453,016,000
Federal other direct payments to individuals: $207,704,000
Federal direct payments not to individuals: $38,804,000
Federal grants: $306,823,000
Federal procurement contracts: $81,491,000 ($1,850,000 Department of Defense)
Federal salaries and wages: $53,414,000 ($2,176,000 Department of Defense)
Federal Government direct loans: $5,778,000
Federal guaranteed/insured loans: $293,464,000
Federal Government insurance: $132,768,000
Population change from April 1, 2000 to July 1, 2005:
Births: 14,585| Here: | 64 per 1000 residents |
| State: | 78 per 1000 residents |
Deaths: 8,748
| Here: | 38 per 1000 residents |
| State: | 37 per 1000 residents |
Net international migration: +3,364
| Here: | +15 per 1000 residents |
| State: | +28 per 1000 residents |
Net internal migration: +41,281
| Here: | +180 per 1000 residents |
| State: | +69 per 1000 residents |
Total withdrawal of fresh water for public supply: 34.32 millions of gallons per day (84% from ground, 16% from surface)
| Here: | 5.9 |
| State: | 6.0 |
| Here: | 5.1 |
| State: | 4.1 |
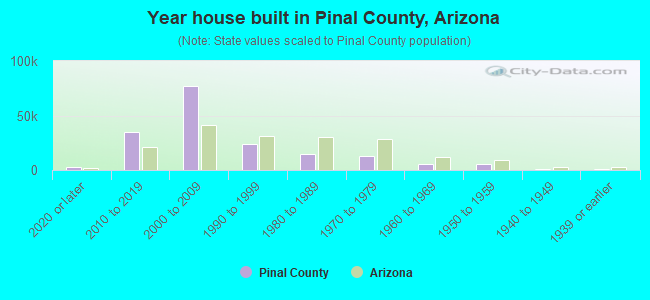
- Year house built in Pinal County, Arizona
- 11,6562020 or later
- 34,1552010 to 2019
- 79,3882000 to 2009
- 21,3831990 to 1999
- 13,9731980 to 1989
- 11,8431970 to 1979
- 5,1891960 to 1969
- 4,6221950 to 1959
- 1,3791940 to 1949
- 2,0851939 or earlier
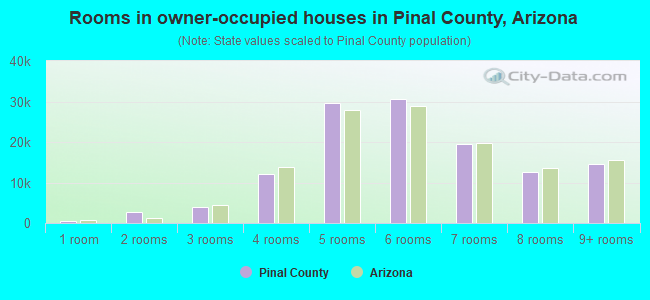
- Rooms in owner-occupied houses in Pinal County, Arizona
- 1,0991 room
- 2,7852 rooms
- 5,1103 rooms
- 14,8824 rooms
- 30,3315 rooms
- 30,5376 rooms
- 21,6527 rooms
- 13,8758 rooms
- 14,9329+ rooms
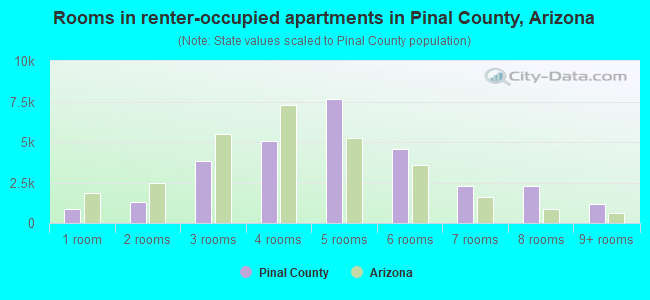
- Rooms in renter-occupied apartments in Pinal County, Arizona
- 4221 room
- 1,0022 rooms
- 3,1183 rooms
- 5,3464 rooms
- 7,8385 rooms
- 5,6956 rooms
- 2,5997 rooms
- 1,4168 rooms
- 1,6429+ rooms
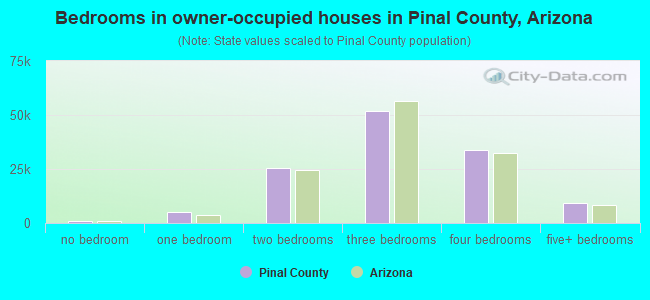
- Bedrooms in owner-occupied houses in Pinal County, Arizona
- 1,197no bedroom
- 6,1381 bedroom
- 26,2742 bedrooms
- 53,5873 bedrooms
- 37,9734 bedrooms
- 10,0345+ bedrooms
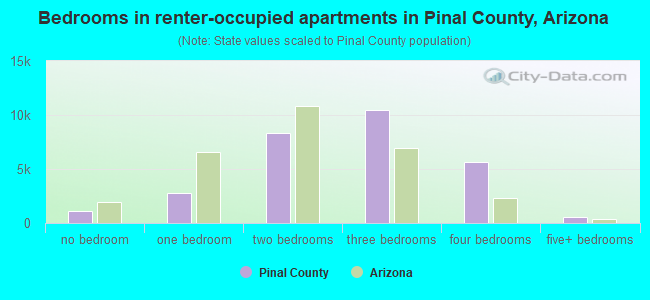
- Bedrooms in renter-occupied apartments in Pinal County, Arizona
- 482no bedroom
- 2,2761 bedroom
- 6,8102 bedrooms
- 12,8003 bedrooms
- 5,8904 bedrooms
- 8205+ bedrooms
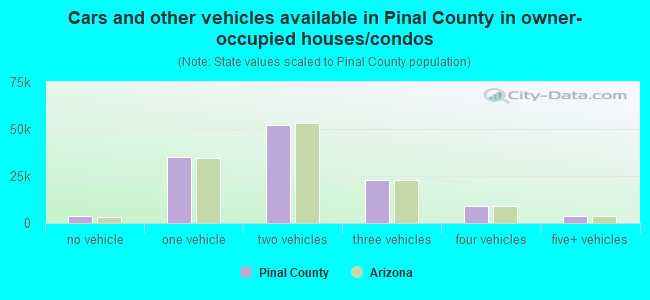
- Cars and other vehicles available in Pinal County in owner-occupied houses/condos
- 2,849no vehicle
- 42,3421 vehicle
- 51,6012 vehicles
- 26,4593 vehicles
- 8,4894 vehicles
- 3,4635+ vehicles
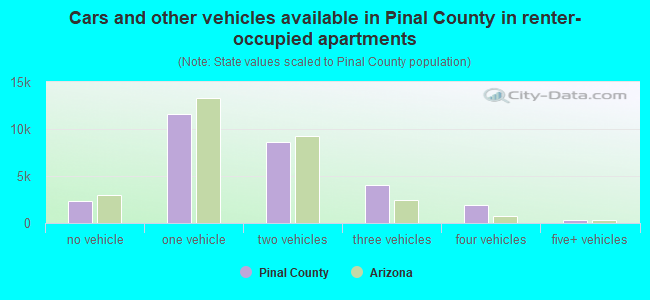
- Cars and other vehicles available in Pinal County in renter-occupied apartments
- 2,171no vehicle
- 10,1901 vehicle
- 10,5532 vehicles
- 5,3793 vehicles
- 5414 vehicles
- 2445+ vehicles
85.8% of Pinal County residents lived in the same house 1 years ago.
Out of people who lived in different houses, 24% lived in this county.
Out of people who lived in different counties, 57% lived in Arizona.
| Pinal County: | 85.8% |
| State average: | 86.0% |
Place of birth for U.S.-born residents:
- This state: 177,904
- Other state: 231,885
- Northeast: 29,814
- Midwest: 81,535
- South: 29,919
- West: 90,617
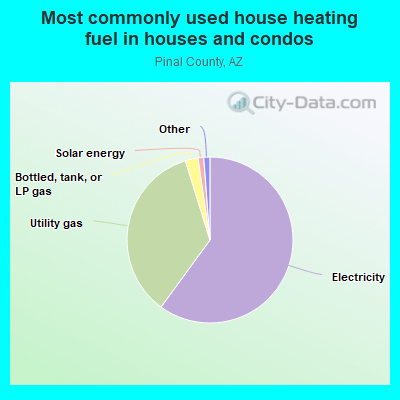
- 59.5%Electricity
- 35.9%Utility gas
- 2.0%Bottled, tank, or LP gas
- 1.5%Solar energy
- 0.5%No fuel used
- 0.3%Wood
- 0.2%Fuel oil, kerosene, etc.
- 0.2%Other fuel
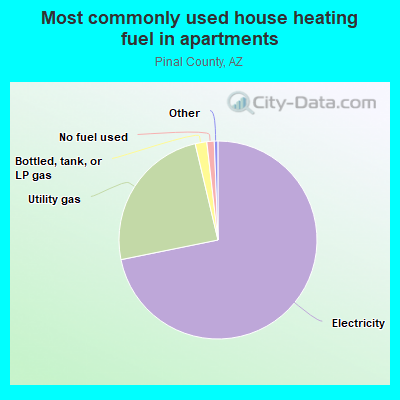
- 69.4%Electricity
- 25.1%Utility gas
- 3.1%No fuel used
- 1.7%Bottled, tank, or LP gas
- 0.6%Fuel oil, kerosene, etc.
- 0.1%Wood
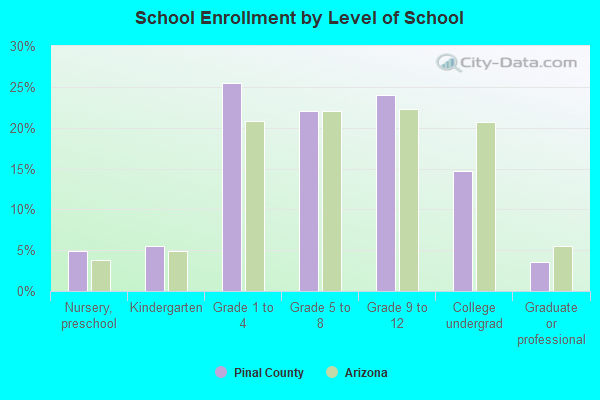
Private vs. public school enrollment:
| Here: | 10.6% |
| Arizona: | 10.4% |
| Here: | 6.6% |
| Arizona: | 8.8% |
| Here: | 16.5% |
| Arizona: | 13.1% |
Pinal County government finances - Expenditure in 2018:
- Bond Funds - Cash and Securities: $60,836,000
Cash and Securities: $56,188,000
- Charges - Other: $19,980,000
Other: $17,171,000
Parks and Recreation: $401,000
Regular Highways: $362,000
Parks and Recreation: $344,000
Regular Highways: $311,000
Air Transportation: $310,000
Air Transportation: $267,000
Solid Waste Management: $30,000
Solid Waste Management: $26,000
Natural Resources - Other: $16,000
Natural Resources - Other: $14,000
Elementary and Secondary Education - Other: $9,000
Elementary and Secondary Education - Other: $7,000
Elementary and Secondary Education School Lunch: $2,000
Elementary and Secondary Education School Lunch: $1,000
- Construction - General - Other: $2,251,000
General - Other: $2,110,000
Regular Highways: $1,073,000
Water Utilities: $1,052,000
Water Utilities: $1,052,000
Regular Highways: $1,006,000
Elementary and Secondary Education: $25,000
Natural Resources - Other: $22,000
Natural Resources - Other: $21,000
- Current Operations - Police Protection: $60,900,000
Police Protection: $55,491,000
Judicial and Legal Services: $50,210,000
Judicial and Legal Services: $45,750,000
Regular Highways: $35,327,000
Health - Other: $34,185,000
Central Staff Services: $33,177,000
Regular Highways: $32,190,000
Health - Other: $31,149,000
Central Staff Services: $30,230,000
Housing and Community Development: $7,669,000
Housing and Community Development: $6,988,000
Corrections - Other: $6,700,000
Corrections - Other: $6,105,000
Elementary and Secondary Education: $5,202,000
Financial Administration: $5,080,000
Elementary and Secondary Education: $4,682,000
Financial Administration: $4,628,000
Natural Resources - Other: $3,993,000
Natural Resources - Other: $3,638,000
Air Transportation: $3,265,000
Air Transportation: $2,975,000
Libraries: $1,733,000
Libraries: $1,579,000
Public Welfare - Other: $1,448,000
Public Welfare - Other: $1,320,000
Water Utilities: $1,268,000
Water Utilities: $1,268,000
General - Other: $484,000
General - Other: $441,000
Parks and Recreation: $108,000
Parks and Recreation: $99,000
Solid Waste Management: $33,000
Solid Waste Management: $30,000
- Federal Intergovernmental - Air Transportation: $7,082,000
Air Transportation: $6,941,000
Water Utilities: $4,172,000
Water Utilities: $4,089,000
- General - Interest on Debt: $6,854,000
Interest on Debt: $4,921,000
- Local Intergovernmental - Education: $4,636,000
Education: $4,636,000
Water Utilities: $203,000
Water Utilities: $203,000
- Long Term Debt - Beginning Outstanding - Unspecified Public Purpose: $163,577,000
Outstanding Unspecified Public Purpose: $159,272,000
Beginning Outstanding - Unspecified Public Purpose: $154,967,000
Outstanding Unspecified Public Purpose: $150,662,000
Retired Unspecified Public Purpose: $4,305,000
Retired Unspecified Public Purpose: $4,305,000
- Miscellaneous - General Revenue - Other: $6,277,000
General Revenue - Other: $5,882,000
Fines and Forfeits: $2,438,000
Fines and Forfeits: $2,285,000
Interest Earnings: $793,000
Interest Earnings: $743,000
Rents: $382,000
Rents: $358,000
Special Assessments: $190,000
Special Assessments: $178,000
Donations From Private Sources: $8,000
Donations From Private Sources: $7,000
Sale of Property: $2,000
Sale of Property: $2,000
- Other Capital Outlay - Elementary and Secondary Education: $224,000
Elementary and Secondary Education: $16,000
- Other Funds - Cash and Securities: $114,656,000
Cash and Securities: $105,896,000
- Revenue - Water Utilities: $840,000
Water Utilities: $840,000
- Sinking Funds - Cash and Securities: $8,973,000
Cash and Securities: $8,288,000
- State Intergovernmental - General Local Government Support: $35,276,000
General Local Government Support: $33,858,000
Highways: $27,776,000
Highways: $26,660,000
Other: $16,807,000
Other: $16,131,000
Housing and Community Development: $6,736,000
Housing and Community Development: $6,465,000
Health and Hospitals: $4,637,000
Health and Hospitals: $4,451,000
Education: $2,406,000
Education: $2,054,000
Water Utilities: $1,548,000
Water Utilities: $1,486,000
- Tax - Property: $113,082,000
Property: $102,706,000
General Sales and Gross Receipts: $22,391,000
General Sales and Gross Receipts: $20,336,000
Other License: $16,294,000
Other License: $14,799,000
Public Utilities Sales: $1,072,000
Public Utilities Sales: $974,000
- Total Salaries and Wages: $8,422,000
: $8,422,000
- Water Utilities - Interest on Debt: $169,000
Interest on Debt: $169,000
Pinal County government finances - Revenue in 2018:
- Bond Funds - Cash and Securities: $60,836,000
Cash and Securities: $56,188,000
- Charges - Other: $19,980,000
Other: $17,171,000
Parks and Recreation: $401,000
Regular Highways: $362,000
Parks and Recreation: $344,000
Regular Highways: $311,000
Air Transportation: $310,000
Air Transportation: $267,000
Solid Waste Management: $30,000
Solid Waste Management: $26,000
Natural Resources - Other: $16,000
Natural Resources - Other: $14,000
Elementary and Secondary Education - Other: $9,000
Elementary and Secondary Education - Other: $7,000
Elementary and Secondary Education School Lunch: $2,000
Elementary and Secondary Education School Lunch: $1,000
- Construction - General - Other: $2,251,000
General - Other: $2,110,000
Regular Highways: $1,073,000
Water Utilities: $1,052,000
Water Utilities: $1,052,000
Regular Highways: $1,006,000
Elementary and Secondary Education: $25,000
Natural Resources - Other: $22,000
Natural Resources - Other: $21,000
- Current Operations - Police Protection: $60,900,000
Police Protection: $55,491,000
Judicial and Legal Services: $50,210,000
Judicial and Legal Services: $45,750,000
Regular Highways: $35,327,000
Health - Other: $34,185,000
Central Staff Services: $33,177,000
Regular Highways: $32,190,000
Health - Other: $31,149,000
Central Staff Services: $30,230,000
Housing and Community Development: $7,669,000
Housing and Community Development: $6,988,000
Corrections - Other: $6,700,000
Corrections - Other: $6,105,000
Elementary and Secondary Education: $5,202,000
Financial Administration: $5,080,000
Elementary and Secondary Education: $4,682,000
Financial Administration: $4,628,000
Natural Resources - Other: $3,993,000
Natural Resources - Other: $3,638,000
Air Transportation: $3,265,000
Air Transportation: $2,975,000
Libraries: $1,733,000
Libraries: $1,579,000
Public Welfare - Other: $1,448,000
Public Welfare - Other: $1,320,000
Water Utilities: $1,268,000
Water Utilities: $1,268,000
General - Other: $484,000
General - Other: $441,000
Parks and Recreation: $108,000
Parks and Recreation: $99,000
Solid Waste Management: $33,000
Solid Waste Management: $30,000
- Federal Intergovernmental - Air Transportation: $7,082,000
Air Transportation: $6,941,000
Water Utilities: $4,172,000
Water Utilities: $4,089,000
- General - Interest on Debt: $6,854,000
Interest on Debt: $4,921,000
- Local Intergovernmental - Education: $4,636,000
Education: $4,636,000
Water Utilities: $203,000
Water Utilities: $203,000
- Long Term Debt - Beginning Outstanding - Unspecified Public Purpose: $163,577,000
Outstanding Unspecified Public Purpose: $159,272,000
Beginning Outstanding - Unspecified Public Purpose: $154,967,000
Outstanding Unspecified Public Purpose: $150,662,000
Retired Unspecified Public Purpose: $4,305,000
Retired Unspecified Public Purpose: $4,305,000
- Miscellaneous - General Revenue - Other: $6,277,000
General Revenue - Other: $5,882,000
Fines and Forfeits: $2,438,000
Fines and Forfeits: $2,285,000
Interest Earnings: $793,000
Interest Earnings: $743,000
Rents: $382,000
Rents: $358,000
Special Assessments: $190,000
Special Assessments: $178,000
Donations From Private Sources: $8,000
Donations From Private Sources: $7,000
Sale of Property: $2,000
Sale of Property: $2,000
- Other Capital Outlay - Elementary and Secondary Education: $224,000
Elementary and Secondary Education: $16,000
- Other Funds - Cash and Securities: $114,656,000
Cash and Securities: $105,896,000
- Revenue - Water Utilities: $840,000
Water Utilities: $840,000
- Sinking Funds - Cash and Securities: $8,973,000
Cash and Securities: $8,288,000
- State Intergovernmental - General Local Government Support: $35,276,000
General Local Government Support: $33,858,000
Highways: $27,776,000
Highways: $26,660,000
Other: $16,807,000
Other: $16,131,000
Housing and Community Development: $6,736,000
Housing and Community Development: $6,465,000
Health and Hospitals: $4,637,000
Health and Hospitals: $4,451,000
Education: $2,406,000
Education: $2,054,000
Water Utilities: $1,548,000
Water Utilities: $1,486,000
- Tax - Property: $113,082,000
Property: $102,706,000
General Sales and Gross Receipts: $22,391,000
General Sales and Gross Receipts: $20,336,000
Other License: $16,294,000
Other License: $14,799,000
Public Utilities Sales: $1,072,000
Public Utilities Sales: $974,000
- Total Salaries and Wages: $8,422,000
: $8,422,000
- Water Utilities - Interest on Debt: $169,000
Interest on Debt: $169,000
Pinal County government finances - Debt in 2018:
- Bond Funds - Cash and Securities: $60,836,000
Cash and Securities: $56,188,000
- Charges - Other: $19,980,000
Other: $17,171,000
Parks and Recreation: $401,000
Regular Highways: $362,000
Parks and Recreation: $344,000
Regular Highways: $311,000
Air Transportation: $310,000
Air Transportation: $267,000
Solid Waste Management: $30,000
Solid Waste Management: $26,000
Natural Resources - Other: $16,000
Natural Resources - Other: $14,000
Elementary and Secondary Education - Other: $9,000
Elementary and Secondary Education - Other: $7,000
Elementary and Secondary Education School Lunch: $2,000
Elementary and Secondary Education School Lunch: $1,000
- Construction - General - Other: $2,251,000
General - Other: $2,110,000
Regular Highways: $1,073,000
Water Utilities: $1,052,000
Water Utilities: $1,052,000
Regular Highways: $1,006,000
Elementary and Secondary Education: $25,000
Natural Resources - Other: $22,000
Natural Resources - Other: $21,000
- Current Operations - Police Protection: $60,900,000
Police Protection: $55,491,000
Judicial and Legal Services: $50,210,000
Judicial and Legal Services: $45,750,000
Regular Highways: $35,327,000
Health - Other: $34,185,000
Central Staff Services: $33,177,000
Regular Highways: $32,190,000
Health - Other: $31,149,000
Central Staff Services: $30,230,000
Housing and Community Development: $7,669,000
Housing and Community Development: $6,988,000
Corrections - Other: $6,700,000
Corrections - Other: $6,105,000
Elementary and Secondary Education: $5,202,000
Financial Administration: $5,080,000
Elementary and Secondary Education: $4,682,000
Financial Administration: $4,628,000
Natural Resources - Other: $3,993,000
Natural Resources - Other: $3,638,000
Air Transportation: $3,265,000
Air Transportation: $2,975,000
Libraries: $1,733,000
Libraries: $1,579,000
Public Welfare - Other: $1,448,000
Public Welfare - Other: $1,320,000
Water Utilities: $1,268,000
Water Utilities: $1,268,000
General - Other: $484,000
General - Other: $441,000
Parks and Recreation: $108,000
Parks and Recreation: $99,000
Solid Waste Management: $33,000
Solid Waste Management: $30,000
- Federal Intergovernmental - Air Transportation: $7,082,000
Air Transportation: $6,941,000
Water Utilities: $4,172,000
Water Utilities: $4,089,000
- General - Interest on Debt: $6,854,000
Interest on Debt: $4,921,000
- Local Intergovernmental - Education: $4,636,000
Education: $4,636,000
Water Utilities: $203,000
Water Utilities: $203,000
- Long Term Debt - Beginning Outstanding - Unspecified Public Purpose: $163,577,000
Outstanding Unspecified Public Purpose: $159,272,000
Beginning Outstanding - Unspecified Public Purpose: $154,967,000
Outstanding Unspecified Public Purpose: $150,662,000
Retired Unspecified Public Purpose: $4,305,000
Retired Unspecified Public Purpose: $4,305,000
- Miscellaneous - General Revenue - Other: $6,277,000
General Revenue - Other: $5,882,000
Fines and Forfeits: $2,438,000
Fines and Forfeits: $2,285,000
Interest Earnings: $793,000
Interest Earnings: $743,000
Rents: $382,000
Rents: $358,000
Special Assessments: $190,000
Special Assessments: $178,000
Donations From Private Sources: $8,000
Donations From Private Sources: $7,000
Sale of Property: $2,000
Sale of Property: $2,000
- Other Capital Outlay - Elementary and Secondary Education: $224,000
Elementary and Secondary Education: $16,000
- Other Funds - Cash and Securities: $114,656,000
Cash and Securities: $105,896,000
- Revenue - Water Utilities: $840,000
Water Utilities: $840,000
- Sinking Funds - Cash and Securities: $8,973,000
Cash and Securities: $8,288,000
- State Intergovernmental - General Local Government Support: $35,276,000
General Local Government Support: $33,858,000
Highways: $27,776,000
Highways: $26,660,000
Other: $16,807,000
Other: $16,131,000
Housing and Community Development: $6,736,000
Housing and Community Development: $6,465,000
Health and Hospitals: $4,637,000
Health and Hospitals: $4,451,000
Education: $2,406,000
Education: $2,054,000
Water Utilities: $1,548,000
Water Utilities: $1,486,000
- Tax - Property: $113,082,000
Property: $102,706,000
General Sales and Gross Receipts: $22,391,000
General Sales and Gross Receipts: $20,336,000
Other License: $16,294,000
Other License: $14,799,000
Public Utilities Sales: $1,072,000
Public Utilities Sales: $974,000
- Total Salaries and Wages: $8,422,000
: $8,422,000
- Water Utilities - Interest on Debt: $169,000
Interest on Debt: $169,000
Pinal County government finances - Cash and Securities in 2018:
- Bond Funds - Cash and Securities: $60,836,000
Cash and Securities: $56,188,000
- Charges - Other: $19,980,000
Other: $17,171,000
Parks and Recreation: $401,000
Regular Highways: $362,000
Parks and Recreation: $344,000
Regular Highways: $311,000
Air Transportation: $310,000
Air Transportation: $267,000
Solid Waste Management: $30,000
Solid Waste Management: $26,000
Natural Resources - Other: $16,000
Natural Resources - Other: $14,000
Elementary and Secondary Education - Other: $9,000
Elementary and Secondary Education - Other: $7,000
Elementary and Secondary Education School Lunch: $2,000
Elementary and Secondary Education School Lunch: $1,000
- Construction - General - Other: $2,251,000
General - Other: $2,110,000
Regular Highways: $1,073,000
Water Utilities: $1,052,000
Water Utilities: $1,052,000
Regular Highways: $1,006,000
Elementary and Secondary Education: $25,000
Natural Resources - Other: $22,000
Natural Resources - Other: $21,000
- Current Operations - Police Protection: $60,900,000
Police Protection: $55,491,000
Judicial and Legal Services: $50,210,000
Judicial and Legal Services: $45,750,000
Regular Highways: $35,327,000
Health - Other: $34,185,000
Central Staff Services: $33,177,000
Regular Highways: $32,190,000
Health - Other: $31,149,000
Central Staff Services: $30,230,000
Housing and Community Development: $7,669,000
Housing and Community Development: $6,988,000
Corrections - Other: $6,700,000
Corrections - Other: $6,105,000
Elementary and Secondary Education: $5,202,000
Financial Administration: $5,080,000
Elementary and Secondary Education: $4,682,000
Financial Administration: $4,628,000
Natural Resources - Other: $3,993,000
Natural Resources - Other: $3,638,000
Air Transportation: $3,265,000
Air Transportation: $2,975,000
Libraries: $1,733,000
Libraries: $1,579,000
Public Welfare - Other: $1,448,000
Public Welfare - Other: $1,320,000
Water Utilities: $1,268,000
Water Utilities: $1,268,000
General - Other: $484,000
General - Other: $441,000
Parks and Recreation: $108,000
Parks and Recreation: $99,000
Solid Waste Management: $33,000
Solid Waste Management: $30,000
- Federal Intergovernmental - Air Transportation: $7,082,000
Air Transportation: $6,941,000
Water Utilities: $4,172,000
Water Utilities: $4,089,000
- General - Interest on Debt: $6,854,000
Interest on Debt: $4,921,000
- Local Intergovernmental - Education: $4,636,000
Education: $4,636,000
Water Utilities: $203,000
Water Utilities: $203,000
- Long Term Debt - Beginning Outstanding - Unspecified Public Purpose: $163,577,000
Outstanding Unspecified Public Purpose: $159,272,000
Beginning Outstanding - Unspecified Public Purpose: $154,967,000
Outstanding Unspecified Public Purpose: $150,662,000
Retired Unspecified Public Purpose: $4,305,000
Retired Unspecified Public Purpose: $4,305,000
- Miscellaneous - General Revenue - Other: $6,277,000
General Revenue - Other: $5,882,000
Fines and Forfeits: $2,438,000
Fines and Forfeits: $2,285,000
Interest Earnings: $793,000
Interest Earnings: $743,000
Rents: $382,000
Rents: $358,000
Special Assessments: $190,000
Special Assessments: $178,000
Donations From Private Sources: $8,000
Donations From Private Sources: $7,000
Sale of Property: $2,000
Sale of Property: $2,000
- Other Capital Outlay - Elementary and Secondary Education: $224,000
Elementary and Secondary Education: $16,000
- Other Funds - Cash and Securities: $114,656,000
Cash and Securities: $105,896,000
- Revenue - Water Utilities: $840,000
Water Utilities: $840,000
- Sinking Funds - Cash and Securities: $8,973,000
Cash and Securities: $8,288,000
- State Intergovernmental - General Local Government Support: $35,276,000
General Local Government Support: $33,858,000
Highways: $27,776,000
Highways: $26,660,000
Other: $16,807,000
Other: $16,131,000
Housing and Community Development: $6,736,000
Housing and Community Development: $6,465,000
Health and Hospitals: $4,637,000
Health and Hospitals: $4,451,000
Education: $2,406,000
Education: $2,054,000
Water Utilities: $1,548,000
Water Utilities: $1,486,000
- Tax - Property: $113,082,000
Property: $102,706,000
General Sales and Gross Receipts: $22,391,000
General Sales and Gross Receipts: $20,336,000
Other License: $16,294,000
Other License: $14,799,000
Public Utilities Sales: $1,072,000
Public Utilities Sales: $974,000
- Total Salaries and Wages: $8,422,000
: $8,422,000
- Water Utilities - Interest on Debt: $169,000
Interest on Debt: $169,000
Supplemental Security Income (SSI) in 2006:
- Total number of recipients: 4,503
- Number of aged recipients: 417
- Number of blind and disabled recipients: 4,086
- Number of recipients under 18: 848
- Number of recipients between 18 and 64: 2,807
- Number of recipients older than 64: 848
- Number of recipients also receiving OASDI: 1,472
- Amount of payments (thousands of dollars): 2,030
| Home Mortgage Disclosure Act Aggregated Statistics For Year 2009 (Based on 32 full tracts) | ||||||||||||||
| A) FHA, FSA/RHS & VA Home Purchase Loans | B) Conventional Home Purchase Loans | C) Refinancings | D) Home Improvement Loans | E) Loans on Dwellings For 5+ Families | F) Non-occupant Loans on < 5 Family Dwellings (A B C & D) | G) Loans On Manufactured Home Dwelling (A B C & D) | ||||||||
|---|---|---|---|---|---|---|---|---|---|---|---|---|---|---|
| Number | Average Value | Number | Average Value | Number | Average Value | Number | Average Value | Number | Average Value | Number | Average Value | Number | Average Value | |
| LOANS ORIGINATED | 4,647 | $121,464 | 2,955 | $118,689 | 4,263 | $173,449 | 97 | $57,938 | 2 | $11,215,000 | 1,956 | $122,414 | 316 | $110,801 |
| APPLICATIONS APPROVED, NOT ACCEPTED | 217 | $126,567 | 232 | $115,500 | 604 | $171,911 | 42 | $49,190 | 0 | $0 | 161 | $113,696 | 77 | $84,922 |
| APPLICATIONS DENIED | 1,141 | $125,890 | 550 | $126,449 | 2,348 | $170,852 | 300 | $42,520 | 3 | $239,000 | 459 | $134,658 | 301 | $87,588 |
| APPLICATIONS WITHDRAWN | 502 | $127,510 | 372 | $130,680 | 1,205 | $167,946 | 95 | $78,358 | 0 | $0 | 307 | $137,251 | 86 | $93,698 |
| FILES CLOSED FOR INCOMPLETENESS | 128 | $120,133 | 79 | $119,759 | 303 | $163,743 | 32 | $67,656 | 0 | $0 | 54 | $123,407 | 30 | $83,433 |
| Private Mortgage Insurance Companies Aggregated Statistics For Year 2009 (Based on 27 full tracts) | ||||||||
| A) Conventional Home Purchase Loans | B) Refinancings | C) Non-occupant Loans on < 5 Family Dwellings (A & B) | D) Loans On Manufactured Home Dwelling (A & B) | |||||
|---|---|---|---|---|---|---|---|---|
| Number | Average Value | Number | Average Value | Number | Average Value | Number | Average Value | |
| LOANS ORIGINATED | 196 | $124,811 | 41 | $192,707 | 61 | $116,262 | 0 | $0 |
| APPLICATIONS APPROVED, NOT ACCEPTED | 111 | $172,144 | 25 | $193,560 | 37 | $160,730 | 4 | $146,000 |
| APPLICATIONS DENIED | 43 | $122,884 | 25 | $183,200 | 20 | $117,150 | 1 | $54,000 |
| APPLICATIONS WITHDRAWN | 18 | $145,778 | 3 | $187,000 | 7 | $90,143 | 0 | $0 |
| FILES CLOSED FOR INCOMPLETENESS | 17 | $138,824 | 3 | $126,667 | 4 | $107,000 | 0 | $0 |
| Most common first names in Pinal County, AZ among deceased individuals | ||
| Name | Count | Lived (average) |
|---|---|---|
| Robert | 732 | 70.6 years |
| John | 724 | 72.8 years |
| William | 679 | 72.6 years |
| James | 618 | 72.2 years |
| Mary | 551 | 76.1 years |
| Charles | 437 | 73.2 years |
| George | 433 | 74.9 years |
| Richard | 315 | 66.8 years |
| Donald | 307 | 70.4 years |
| Frank | 301 | 75.0 years |
| Most common last names in Pinal County, AZ among deceased individuals | ||
| Last name | Count | Lived (average) |
|---|---|---|
| Smith | 303 | 72.1 years |
| Johnson | 243 | 72.4 years |
| Jones | 177 | 73.3 years |
| Garcia | 160 | 70.0 years |
| Miller | 158 | 74.8 years |
| Davis | 157 | 74.9 years |
| Williams | 154 | 71.3 years |
| Brown | 140 | 72.4 years |
| Jackson | 117 | 67.3 years |
| Anderson | 117 | 73.7 years |
| Businesses in Pinal County, AZ | ||||
| Name | Count | Name | Count | |
|---|---|---|---|---|
| 7-Eleven | 1 | Lane Bryant | 1 | |
| 99 Cents Only Stores | 2 | Lane Furniture | 3 | |
| AT&T | 1 | Levi Strauss & Co. | 1 | |
| Ace Hardware | 4 | Little Caesars Pizza | 2 | |
| Albertsons | 1 | Long John Silver's | 1 | |
| Arby's | 2 | Lowe's | 1 | |
| Ashley Furniture | 1 | MainStay | 1 | |
| AutoZone | 4 | Marshalls | 1 | |
| Baskin-Robbins | 1 | MasterBrand Cabinets | 2 | |
| Bed Bath & Beyond | 1 | Maurices | 1 | |
| Best Western | 2 | McDonald's | 7 | |
| Big O Tires | 1 | Motel 6 | 1 | |
| Blockbuster | 4 | Nike | 3 | |
| Burger King | 4 | OfficeMax | 1 | |
| CVS | 1 | Old Navy | 1 | |
| Carl\s Jr. | 4 | Olive Garden | 1 | |
| Chevrolet | 2 | Panda Express | 1 | |
| Chick-Fil-A | 1 | Papa John's Pizza | 1 | |
| Church's Chicken | 1 | Penske | 2 | |
| Cold Stone Creamery | 1 | PetSmart | 1 | |
| Comfort Inn | 1 | Pizza Hut | 2 | |
| Cracker Barrel | 1 | Quiznos | 2 | |
| Cricket Wireless | 1 | RadioShack | 3 | |
| Curves | 2 | Rue21 | 1 | |
| Dairy Queen | 2 | SONIC Drive-In | 3 | |
| Days Inn | 1 | Safeway | 1 | |
| Dennys | 1 | Sears | 1 | |
| Famous Footwear | 1 | Sephora | 1 | |
| FedEx | 13 | Sprint Nextel | 1 | |
| Ford | 2 | Starbucks | 6 | |
| GNC | 1 | Subway | 7 | |
| GameStop | 1 | Super 8 | 1 | |
| Gap | 1 | T-Mobile | 5 | |
| Goodwill | 3 | Taco Bell | 2 | |
| H&R Block | 8 | True Value | 1 | |
| Holiday Inn | 3 | U-Haul | 21 | |
| Home Depot | 1 | UPS | 16 | |
| IHOP | 1 | Vans | 1 | |
| IZOD | 1 | Verizon Wireless | 2 | |
| Jack In The Box | 1 | Victoria's Secret | 1 | |
| KFC | 2 | Vons | 3 | |
| Kmart | 1 | Waffle House | 1 | |
| Kohl's | 1 | Walmart | 5 | |
| Kroger | 4 | Wendy's | 2 | |
| LA Fitness | 1 | YMCA | 1 | |
Pinal County on our top lists:
- #2 on the list of "Top 101 counties with the largest decrease in the number of deaths per 1000 residents 2000-2006 to 2007-2013 (pop. 50,000+)"
- #3 on the list of "Top 101 counties with the highest Particulate Matter (PM10) Annual air pollution readings in 2012 (µg/m3)"
- #15 on the list of "Top 101 counties with the lowest percentage of residents that visited a dentist within the past year"
- #28 on the list of "Top 101 counties with the highest percentage of residents relocating to other counties in 2011 (pop. 50,000+)"
- #31 on the list of "Top 101 counties with the highest Ozone (1-hour) air pollution readings in 2012 (ppm)"
- #32 on the list of "Top 101 counties with the highest percentage of residents that keep firearms around their homes"
- #45 on the list of "Top 101 counties with the highest percentage of residents relocating from other counties between 2010 and 2011 (pop. 50,000+)"
- #61 on the list of "Top 101 counties with the highest percentage of residents that smoked 100+ cigarettes in their lives"
- #78 on the list of "Top 101 counties with the highest percentage of residents relocating to other counties in 2011"
- #85 on the list of "Top 101 counties with the highest ground withdrawal of fresh water for public supply (pop. 50,000+)"
- #86 on the list of "Top 101 counties with the highest ground withdrawal of fresh water for public supply"
- #97 on the list of "Top 101 counties with the worst general health status score of residents (1-5), 3 years of data"
- #98 on the list of "Top 101 counties with the highest percentage of residents relocating from other counties between 2010 and 2011"