Estimated zip code population in 2022: 4,450 Zip code population in 2010: 4,975 Zip code population in 2000: 4,713
Houses and condos: 2,035 Renter-occupied apartments: 241
% of renters here:
13%
State:
33%
March 2022 cost of living index in zip code 85736: 84.1 (less than average, U.S. average is 100)
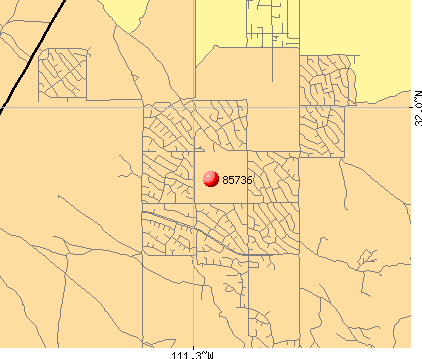
Land area: 352.6 sq. mi. Water area: 0.0 sq. mi.
Population density: 13 people per square mile
(very low).
OSM Map
General Map
Google Map
MSN Map
OSM Map
General Map
Google Map
MSN Map
OSM Map
General Map
Google Map
MSN Map
OSM Map
General Map
Google Map
MSN Map
Please wait while loading the map...
Real estate property taxes paid for housing units in 2022:
This zip code:
0.6% ($918)
Arizona:
0.4% ($1,786)
Median real estate property taxes paid for housing units with mortgages in 2022: $1,154 (0.6%) Median real estate property taxes paid for housing units with no mortgage in 2022: $880 (0.7%)
Business Search- 14 Million verified businesses
Males: 2,526
(56.8%)
Females: 1,922
(43.2%)
For population 25 years and over in 85736:
High school or higher: 79.8%
Bachelor's degree or higher: 12.9%
Graduate or professional degree: 5.5%
Unemployed: 2.9%
Mean travel time to work (commute): 34.2 minutes
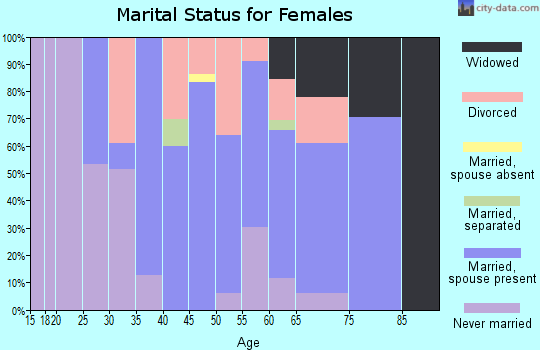
For population 15 years and over in 85736:
Never married: 28.1%
Now married: 44.4%
Separated: 2.7%
Widowed: 5.0%
Divorced: 19.7%
Zip code 85736 compared to state average:
Median house value significantly below state average.
Black race population percentage significantly below state average.
Median age above state average.
Foreign-born population percentage significantly below state average.
Renting percentage significantly below state average.
Length of stay since moving in significantly above state average.
Number of college students below state average.
Percentage of population with a bachelor's degree or higher significantly below state average.
Averages for the 2020 tax year for zip code 85736, filed in 2021:
Average Adjusted Gross Income (AGI) in 2020: $39,324 (Individual Income Tax Returns)
Here:
$39,324
State:
$73,499
Salary/wage: $37,053 (reported on 76.2% of returns)
Here:
$37,053
State:
$59,499
(% of AGI for various income ranges: 948.0% for AGIs below $25k, 3533.2% for AGIs $25k-50k, 6335.0% for AGIs $50k-75k, 9048.8% for AGIs $75k-100k, 15560.0% for AGIs $100k-200k)
Taxable interest for individuals: $1,077 (reported on 13.4% of returns)
This zip code:
$1,077
Arizona:
$2,325
(% of AGI for various income ranges: 15.6% for AGIs below $25k, 22.4% for AGIs $25k-50k, 10.0% for AGIs $50k-75k, 10.0% for AGIs $75k-100k, 61.7% for AGIs $100k-200k)
Ordinary dividends: $2,886 (reported on 8.5% of returns)
Here:
$2,886
State:
$8,711
(% of AGI for various income ranges: 10.7% for AGIs below $25k, 15.6% for AGIs $25k-50k, 25.6% for AGIs $50k-75k, 401.7% for AGIs $100k-200k)
Net capital gain/loss in AGI: +$7,620 (reported on 6.1% of returns)
Here:
+$7,620
State:
+$31,332
(% of AGI for various income ranges: 10.9% for AGIs below $25k, 18.0% for AGIs $25k-50k, 28.7% for AGIs $50k-75k, 971.7% for AGIs $100k-200k)
Profit/loss from business: +$6,853 (reported on 11.6% of returns)
Here:
+$6,853
State:
+$13,214
(% of AGI for various income ranges: 136.3% for AGIs below $25k, 81.2% for AGIs $25k-50k, 291.2% for AGIs $75k-100k)
Taxable individual retirement arrangement distribution: $15,278 (reported on 5.5% of returns)
85736:
$15,278
Arizona:
$23,364
(% of AGI for various income ranges: 28.3% for AGIs below $25k, 107.8% for AGIs $25k-50k, 975.0% for AGIs $75k-100k)
Total itemized deductions: $22,325 (reported on 2.4% of returns)
Here:
$22,325
State:
$36,308
(% of AGI for various income ranges: 558.1% for AGIs $50k-75k)
Charity contributions: $3,700 (reported on 1.2% of returns)
Here:
$3,700
State:
$11,955
(% of AGI for various income ranges: 18.0% for AGIs $25k-50k)
Taxes paid: $4,500 (reported on 2.4% of returns)
85736:
$4,500
State:
$6,820
(% of AGI for various income ranges: 112.5% for AGIs $50k-75k)
Earned income credit: $2,570 (reported on 26.8% of returns)
Here:
$2,570
State:
$2,383
(% of AGI for various income ranges: 138.9% for AGIs below $25k, 92.9% for AGIs $25k-50k)
Percentage of individuals using paid preparers for their 2020 taxes: 92.1%
Here:
92%
State:
93%
(% for various income ranges: 91.4% for AGIs below $25k, 95.9% for AGIs $25k-50k, 86.4% for AGIs $50k-75k, 91.7% for AGIs $75k-100k, 90.9% for AGIs $100k-200k)
Averages for the 2012 tax year for zip code 85736, filed in 2013:
Average Adjusted Gross Income (AGI) in 2012: $36,305 (Individual Income Tax Returns)
Here:
$36,305
State:
$57,644
Salary/wage: $32,775 (reported on 84.1% of returns)
Here:
$32,775
State:
$47,932
(% of AGI for various income ranges: 74.7% for AGIs below $25k, 82.6% for AGIs $25k-50k, 76.1% for AGIs $50k-75k, 78.4% for AGIs $75k-100k, 66.4% for AGIs $100k-200k)
Taxable interest for individuals: $600 (reported on 16.7% of returns)
This zip code:
$600
Arizona:
$2,064
(% of AGI for various income ranges: 0.5% for AGIs below $25k, 0.2% for AGIs $25k-50k, 0.3% for AGIs $50k-75k, 0.2% for AGIs $100k-200k)
Ordinary dividends: $1,671 (reported on 10.1% of returns)
Here:
$1,671
State:
$7,268
(% of AGI for various income ranges: 0.7% for AGIs below $25k, 0.5% for AGIs $25k-50k, 0.3% for AGIs $50k-75k, 1.2% for AGIs $75k-100k)
Net capital gain/loss in AGI: +$400 (reported on 5.1% of returns)
Here:
+$400
State:
+$15,530
(% of AGI for various income ranges: 0.6% for AGIs $75k-100k)
Profit/loss from business: +$5,283 (reported on 13.0% of returns)
Here:
+$5,283
State:
+$12,323
(% of AGI for various income ranges: 9.6% for AGIs below $25k, 0.5% for AGIs $25k-50k, 0.4% for AGIs $50k-75k)
Taxable individual retirement arrangement distribution: $14,220 (reported on 7.2% of returns)
85736:
$14,220
Arizona:
$18,280
(% of AGI for various income ranges: 2.4% for AGIs below $25k, 2.3% for AGIs $25k-50k, 2.7% for AGIs $50k-75k, 8.9% for AGIs $75k-100k)
Total itemized deductions: $16,741 (27% of AGI, reported on 21.0% of returns)
Here:
$16,741
State:
$23,651
Here:
27.0% of AGI
State:
20.6% of AGI
(% of AGI for various income ranges: 8.2% for AGIs below $25k, 9.9% for AGIs $25k-50k, 9.2% for AGIs $50k-75k, 10.9% for AGIs $75k-100k, 10.5% for AGIs $100k-200k)
Charity contributions: $1,730 (reported on 14.5% of returns)
Here:
$1,730
State:
$4,114
(% of AGI for various income ranges: 0.3% for AGIs below $25k, 0.7% for AGIs $25k-50k, 0.5% for AGIs $50k-75k, 0.9% for AGIs $75k-100k, 1.2% for AGIs $100k-200k)
Taxes paid: $3,972 (reported on 21.0% of returns)
85736:
$3,972
State:
$6,509
(% of AGI for various income ranges: 1.4% for AGIs below $25k, 1.7% for AGIs $25k-50k, 2.2% for AGIs $50k-75k, 3.4% for AGIs $75k-100k, 3.3% for AGIs $100k-200k)
Earned income credit: $2,447 (reported on 34.1% of returns)
Here:
$2,447
State:
$2,432
(% of AGI for various income ranges: 10.6% for AGIs below $25k, 1.7% for AGIs $25k-50k)
Percentage of individuals using paid preparers for their 2012 taxes: 45.7%
Here:
46%
State:
52%
(% for various income ranges: 44.1% for AGIs below $25k, 44.4% for AGIs $25k-50k, 47.4% for AGIs $50k-75k, 50.0% for AGIs $75k-100k, 57.1% for AGIs $100k-200k)
Averages for the 2004 tax year for zip code 85736, filed in 2005:
Average Adjusted Gross Income (AGI) in 2004: $32,455 (Individual Income Tax Returns)
Here:
$32,455
State:
$50,097
Salary/wage: $31,482 (reported on 86.8% of returns)
Here:
$31,482
State:
$42,146
(% of AGI for various income ranges: 83.0% for AGIs below $10k, 79.6% for AGIs $10k-25k, 89.5% for AGIs $25k-50k, 83.8% for AGIs $50k-75k, 83.2% for AGIs $75k-100k, 76.8% for AGIs over 100k)
Taxable interest for individuals: $810 (reported on 26.5% of returns)
This zip code:
$810
Arizona:
$2,374
(% of AGI for various income ranges: 1.3% for AGIs below $10k, 0.7% for AGIs $10k-25k, 0.3% for AGIs $25k-50k, 1.1% for AGIs $50k-75k, 0.1% for AGIs $75k-100k, 0.9% for AGIs over 100k)
Taxable dividends: $1,111 (reported on 11.7% of returns)
Here:
$1,111
State:
$3,888
(% of AGI for various income ranges: 0.3% for AGIs below $10k, 0.2% for AGIs $10k-25k, 0.3% for AGIs $25k-50k, 0.4% for AGIs $50k-75k, 1.3% for AGIs over 100k)
Net capital gain/loss: +$3,429 (reported on 9.1% of returns)
Here:
+$3,429
State:
+$17,569
(% of AGI for various income ranges: -0.9% for AGIs below $10k, -0.3% for AGIs $10k-25k, 0.0% for AGIs $25k-50k, 1.1% for AGIs $50k-75k, 7.2% for AGIs over 100k)
Profit/loss from business: +$3,976 (reported on 13.6% of returns)
Here:
+$3,976
State:
+$11,088
(% of AGI for various income ranges: 8.2% for AGIs below $10k, 5.7% for AGIs $10k-25k, 1.9% for AGIs $25k-50k, -0.6% for AGIs $50k-75k, 0.4% for AGIs $75k-100k)
IRA payment deduction: $3,500 (reported on 1.9% of returns)
85736:
$3,500
Arizona:
$3,023
Total itemized deductions: $13,818 (26% of AGI, reported on 27.6% of returns)
Here:
$13,818
State:
$19,781
Here:
26.0% of AGI
State:
21.8% of AGI
(% of AGI for various income ranges: 10.7% for AGIs below $10k, 10.4% for AGIs $10k-25k, 10.9% for AGIs $25k-50k, 12.2% for AGIs $50k-75k, 13.8% for AGIs $75k-100k, 13.6% for AGIs over 100k)
Charity contributions deductions: $1,552 (3% of AGI, reported on 22.7% of returns)
Here:
$1,552
State:
$3,389
Here:
2.9% of AGI
State:
3.5% of AGI
(% of AGI for various income ranges: 0.8% for AGIs $10k-25k, 0.8% for AGIs $25k-50k, 1.4% for AGIs $50k-75k, 1.6% for AGIs $75k-100k, 1.3% for AGIs over 100k)
Total tax: $3,555 (reported on 67.6% of returns)
85736:
$3,555
State:
$8,323
(% of AGI for various income ranges: 2.6% for AGIs below $10k, 3.5% for AGIs $10k-25k, 5.4% for AGIs $25k-50k, 8.7% for AGIs $50k-75k, 10.1% for AGIs $75k-100k, 14.5% for AGIs over 100k)
Earned income credit: $2,025 (reported on 26.1% of returns)
Here:
$2,025
State:
$1,786
Percentage of individuals using paid preparers for their 2004 taxes: 57.4%
Here:
57%
State:
60%
(% for various income ranges: 51.0% for AGIs below $10k, 62.4% for AGIs $10k-25k, 58.7% for AGIs $25k-50k, 56.5% for AGIs $50k-75k, 45.6% for AGIs $75k-100k, 56.2% for AGIs over 100k)
Household received Food Stamps/SNAP in the past 12 months: 297 Household did not receive Food Stamps/SNAP in the past 12 months: 1,538
Women who had a birth in the past 12 months: 102 (82 now married, 21 unmarried) Women who did not have a birth in the past 12 months: 693 (250 now married, 444 unmarried)
Housing units in zip code 85736 with a mortgage: 764 (44 second mortgage, 46 both second mortgage and home equity loan) Median monthly owner costs for units with a mortgage: $1,102 Median monthly owner costs for units without a mortgage: $301
Residents with income below the poverty level in 2022:
This zip code:
8.5%
Whole state:
12.5%
Residents with income below 50% of the poverty level in 2022:
This zip code:
2.0%
Whole state:
6.0%
Median number of rooms in houses and condos:
Here:
5.5
State:
6.0
Median number of rooms in apartments:
Here:
4.6
State:
4.1
Notable locations in this zip code not listed on our city pages
Notable locations in zip code 85736: Palo Alto Ranch (A), Anvil Ranch (B), Peyron Ranch (C), Gunsight Ranch (D), Pozo Nuevo Ranch (E), West Side Windmill (F), Redondo Ranch (G), Britten Ranch (H), San Juan Ranch (I), Las Delicias Ranch (J), Stevens Ranch (K), El Cazador Ranch (L), Elkhorn Ranch (M), Three Points Fire Station 91 (N). Display/hide their locations on the map
Reservoirs: Diablo Tank (A), East Tank (B), Espinosa Tank (C), Garambolo Tank (D), Hall Tank (E), Javelina Tank (F), La Cholla Tank (G), La Jolla Tank (H). Display/hide their locations on the map
Streams, rivers, and creeks: Saucito Wash (A), Bolas Blancas Wash (B), San Miguel Wash (C), San Juan Wash (D), Brown Wash (E), Contreras Wash (F), Sabino Wash (G), Fresno Wash (H), Fresnal Wash (I). Display/hide their locations on the map
Size of family households: 322 2-persons, 261 3-persons, 268 4-persons, 117 5-persons, 61 6-persons, 24 7-or-more-persons
Size of nonfamily households: 711 1-person, 61 2-persons
514 married couples with children.
266 single-parent households (151 men, 115 women).
83.8% of residents of 85736 zip code speak English at home.
16.1% of residents speak Spanish at home (71% very well, 15% well, 8% not well, 6% not at all).
0.6% of residents speak other Indo-European language at home (100% very well).
Foreign born population: 226 (5.1%) (65.1% of them are naturalized citizens)
Facilities with environmental interests located in this zip code:
ALTAR VALLEY MIDDLE SCHOOL (16350 W. AJO RD. in TUCSON, AZ)
(National Center for Education Statistics) - STATE ID-103 Organizations: ALTAR VALLEY ELEMENTARY DISTRICT (SCHOOL DISTRICT)
DESERT MOSAIC SCHOOL (5757 W. AJO WAY in TUCSON, AZ)
(National Center for Education Statistics) - STATE ID-001 Organizations: MULTIDIMENSIONAL LITERACY CORP. (SCHOOL DISTRICT)
DESERT WATER WELL (11200 SOUTH SIERRITA MOUNTAIN ROAD in TUCSON, AZ)
(Integrated Compliance Information System) - ICIS-09-2000-0207, FORMAL ENFORCEMENT ACTION COMMUNITY WATER SYSTEM (SDWIS) Business SIC classification: WATER SUPPLY Alternative names: WELLS FARGO WELL ASSOC
Housing units lacking complete plumbing facilities: 4.9% Housing units lacking complete kitchen facilities: 3.4%
62.9%Electricity
21.9%Bottled, tank, or LP gas
8.7%Utility gas
3.0%Wood
2.2%Other fuel
1.4%Solar energy
Population in 1990: 1,130. Population change in the 1990s: +3,583 (+317.1%).
Place of birth for U.S.-born residents:
This state: 1,990
Northeast: 225
Midwest: 707
South: 355
West: 809
52% of the 85736 zip code residents lived in the same house 5 years ago. Out of people who lived in different houses, 66% lived in this county. Out of people who lived in different counties, 50% lived in Arizona.
92% of the 85736 zip code residents lived in the same house 1 year ago. Out of people who lived in different houses, 60% moved from this county. Out of people who lived in different houses, 20% moved from different county within same state. Out of people who lived in different houses, 24% moved from different state.
Private vs. public school enrollment:
Students in private schools in grades 1 to 8 (elementary and middle school): 53
Here:
14.7%
Arizona:
10.4%
Students in private schools in grades 9 to 12 (high school): 39
Here:
16.7%
Arizona:
8.8%
Students in private undergraduate colleges:
Here:
0.0%
Arizona:
13.1%
Occupation by median earnings in the past 12 months ($)
75,875Management occupations
62,420Installation, maintenance, and repair occupations
48,932Computer and mathematical occupations
48,467Education, training, and library occupations
47,125Business and financial operations occupations
42,586Production occupations
Companies with federal contracts located in this zip code:
DAREN LONGFELLOW (136520 W YANKEE ROAD in TUCSON, AZ; small business)
$6,000 with Army for Live Animals, Not Raised for Food. Signed on 2003-08-27. Completion date: 2003-09-26.
Top industries in this zip code by the number of employees in 2005:
Accommodation and Food Services: Recreational and Vacation Camps (except Campgrounds) (20-49 employees: 1 establishment, 1-4 employees: 1 establishment)
Construction: New Single-Family Housing Construction (except Operative Builders) (10-19: 1, 1-4: 1)
Accommodation and Food Services: Full-Service Restaurants (5-9: 2, 1-4: 1)
Administrative and Support and Waste Management and Remediation Services: Janitorial Services (10-19: 1)
Accommodation and Food Services: Food Service Contractors (10-19: 1)
Construction: Roofing Contractors (5-9: 1)
Finance and Insurance: Miscellaneous Intermediation (1-4: 1)
Administrative and Support and Waste Management and Remediation Services: Landscaping Services (1-4: 1)
Construction: Residential Remodelers (1-4: 1)
Fatal accident statistics in 2013:
Fatal accident count: 1
Vehicles involved in fatal accidents: 1
Fatal accidents caused by drunken drivers: 0
Fatalities: 1
Persons involved in fatal accidents: 1
Pedestrians involved in fatal accidents: 0
Home Mortgage Disclosure Act Aggregated Statistics For Year 2009 (Based on 2 full and 2 partial tracts)
A) FHA, FSA/RHS & VA Home Purchase Loans
B) Conventional Home Purchase Loans
C) Refinancings
D) Home Improvement Loans
F) Non-occupant Loans on < 5 Family Dwellings (A B C & D)
G) Loans On Manufactured Home Dwelling (A B C & D)
Number
Average Value
Number
Average Value
Number
Average Value
Number
Average Value
Number
Average Value
Number
Average Value
LOANS ORIGINATED
35
$95,352
17
$101,118
74
$133,411
11
$18,494
10
$102,297
53
$92,440
APPLICATIONS APPROVED, NOT ACCEPTED
0
$0
2
$188,085
16
$110,034
0
$0
0
$0
7
$67,689
APPLICATIONS DENIED
4
$119,220
21
$112,394
77
$124,135
24
$34,023
9
$119,079
56
$70,211
APPLICATIONS WITHDRAWN
4
$93,552
5
$101,360
21
$135,648
0
$0
0
$0
4
$126,690
FILES CLOSED FOR INCOMPLETENESS
4
$98,675
2
$69,550
6
$180,247
0
$0
0
$0
8
$103,461
Aggregated Statistics For Year 2008 (Based on 2 full and 2 partial tracts)
A) FHA, FSA/RHS & VA Home Purchase Loans
B) Conventional Home Purchase Loans
C) Refinancings
D) Home Improvement Loans
F) Non-occupant Loans on < 5 Family Dwellings (A B C & D)
G) Loans On Manufactured Home Dwelling (A B C & D)
Number
Average Value
Number
Average Value
Number
Average Value
Number
Average Value
Number
Average Value
Number
Average Value
LOANS ORIGINATED
39
$120,169
32
$131,619
106
$125,523
11
$43,467
4
$123,842
95
$107,476
APPLICATIONS APPROVED, NOT ACCEPTED
2
$278,205
5
$173,794
16
$131,588
0
$0
6
$174,092
9
$89,499
APPLICATIONS DENIED
24
$119,266
26
$113,912
163
$105,331
49
$74,230
4
$214,468
164
$90,664
APPLICATIONS WITHDRAWN
6
$124,387
3
$234,510
51
$121,274
5
$59,762
4
$98,450
34
$106,636
FILES CLOSED FOR INCOMPLETENESS
6
$143,022
4
$131,755
10
$157,031
4
$22,040
2
$246,860
4
$57,812
Aggregated Statistics For Year 2007 (Based on 2 full and 2 partial tracts)
A) FHA, FSA/RHS & VA Home Purchase Loans
B) Conventional Home Purchase Loans
C) Refinancings
D) Home Improvement Loans
F) Non-occupant Loans on < 5 Family Dwellings (A B C & D)
G) Loans On Manufactured Home Dwelling (A B C & D)
Number
Average Value
Number
Average Value
Number
Average Value
Number
Average Value
Number
Average Value
Number
Average Value
LOANS ORIGINATED
58
$109,913
85
$160,926
152
$119,910
26
$103,297
19
$145,099
138
$99,167
APPLICATIONS APPROVED, NOT ACCEPTED
4
$116,572
24
$146,502
24
$156,197
11
$39,745
2
$220,450
21
$93,576
APPLICATIONS DENIED
5
$99,206
37
$120,737
255
$127,123
57
$57,391
16
$167,936
176
$84,327
APPLICATIONS WITHDRAWN
2
$97,960
11
$125,005
50
$149,002
8
$82,219
8
$141,679
15
$82,873
FILES CLOSED FOR INCOMPLETENESS
0
$0
0
$0
15
$132,251
0
$0
2
$98,075
9
$94,527
Aggregated Statistics For Year 2006 (Based on 2 full and 2 partial tracts)
A) FHA, FSA/RHS & VA Home Purchase Loans
B) Conventional Home Purchase Loans
C) Refinancings
D) Home Improvement Loans
F) Non-occupant Loans on < 5 Family Dwellings (A B C & D)
G) Loans On Manufactured Home Dwelling (A B C & D)
Number
Average Value
Number
Average Value
Number
Average Value
Number
Average Value
Number
Average Value
Number
Average Value
LOANS ORIGINATED
52
$127,311
107
$112,513
146
$130,064
34
$58,012
31
$177,086
125
$91,251
APPLICATIONS APPROVED, NOT ACCEPTED
2
$96,980
31
$103,565
27
$114,920
19
$58,479
2
$229,085
29
$83,741
APPLICATIONS DENIED
8
$107,969
42
$75,705
254
$102,150
82
$52,508
11
$80,012
168
$66,379
APPLICATIONS WITHDRAWN
4
$115,592
29
$149,527
129
$126,480
18
$74,724
0
$0
41
$98,757
FILES CLOSED FOR INCOMPLETENESS
2
$107,755
10
$124,090
23
$123,173
2
$71,950
0
$0
0
$0
Aggregated Statistics For Year 2005 (Based on 2 full and 2 partial tracts)
A) FHA, FSA/RHS & VA Home Purchase Loans
B) Conventional Home Purchase Loans
C) Refinancings
D) Home Improvement Loans
F) Non-occupant Loans on < 5 Family Dwellings (A B C & D)
G) Loans On Manufactured Home Dwelling (A B C & D)
Number
Average Value
Number
Average Value
Number
Average Value
Number
Average Value
Number
Average Value
Number
Average Value
LOANS ORIGINATED
30
$105,408
162
$92,380
160
$121,687
28
$47,496
31
$78,144
126
$81,723
APPLICATIONS APPROVED, NOT ACCEPTED
4
$160,655
23
$96,774
59
$102,375
2
$19,590
2
$286,265
23
$80,034
APPLICATIONS DENIED
9
$99,409
56
$89,955
228
$92,163
59
$34,534
11
$116,761
167
$73,715
APPLICATIONS WITHDRAWN
2
$70,570
29
$118,257
123
$104,378
17
$106,471
4
$73,558
53
$76,595
FILES CLOSED FOR INCOMPLETENESS
2
$156,735
4
$96,490
71
$104,335
0
$0
4
$96,490
32
$89,800
Aggregated Statistics For Year 2004 (Based on 2 full and 2 partial tracts)
A) FHA, FSA/RHS & VA Home Purchase Loans
B) Conventional Home Purchase Loans
C) Refinancings
D) Home Improvement Loans
F) Non-occupant Loans on < 5 Family Dwellings (A B C & D)
G) Loans On Manufactured Home Dwelling (A B C & D)
Number
Average Value
Number
Average Value
Number
Average Value
Number
Average Value
Number
Average Value
Number
Average Value
LOANS ORIGINATED
23
$97,620
110
$89,917
166
$99,511
25
$42,452
9
$93,827
103
$76,062
APPLICATIONS APPROVED, NOT ACCEPTED
0
$0
25
$84,163
76
$107,831
7
$45,996
0
$0
52
$75,702
APPLICATIONS DENIED
5
$97,908
53
$68,619
262
$86,566
47
$25,017
11
$84,465
162
$71,678
APPLICATIONS WITHDRAWN
4
$164,082
21
$79,172
147
$95,848
13
$55,784
1
$77,180
68
$78,527
FILES CLOSED FOR INCOMPLETENESS
2
$80,325
2
$48,000
61
$96,141
6
$99,930
2
$48,980
26
$71,562
Aggregated Statistics For Year 2003 (Based on 2 full and 2 partial tracts)
A) FHA, FSA/RHS & VA Home Purchase Loans
B) Conventional Home Purchase Loans
C) Refinancings
D) Home Improvement Loans
F) Non-occupant Loans on < 5 Family Dwellings (A B C & D)
Number
Average Value
Number
Average Value
Number
Average Value
Number
Average Value
Number
Average Value
LOANS ORIGINATED
28
$115,939
96
$87,476
284
$87,153
15
$25,889
18
$91,252
APPLICATIONS APPROVED, NOT ACCEPTED
5
$54,288
24
$66,722
82
$90,314
2
$52,195
4
$80,328
APPLICATIONS DENIED
6
$95,022
60
$79,221
316
$83,732
29
$28,731
18
$80,945
APPLICATIONS WITHDRAWN
6
$110,270
12
$105,143
125
$88,722
2
$14,695
2
$83,265
FILES CLOSED FOR INCOMPLETENESS
0
$0
2
$27,430
12
$108,736
0
$0
0
$0
Aggregated Statistics For Year 1999 (Based on 1 partial tract)
A) FHA, FSA/RHS & VA Home Purchase Loans
B) Conventional Home Purchase Loans
C) Refinancings
D) Home Improvement Loans
F) Non-occupant Loans on < 5 Family Dwellings (A B C & D)

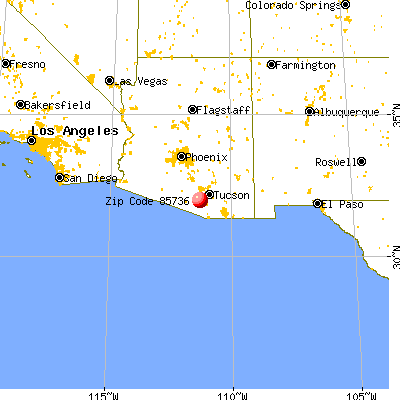


 Nearest zip codes: 85735, 85622, 85645, 85601, 85757, 85633.