Estimated zip code population in 2022: 1,226 Zip code population in 2010: 1,297 Zip code population in 2000: 1,294
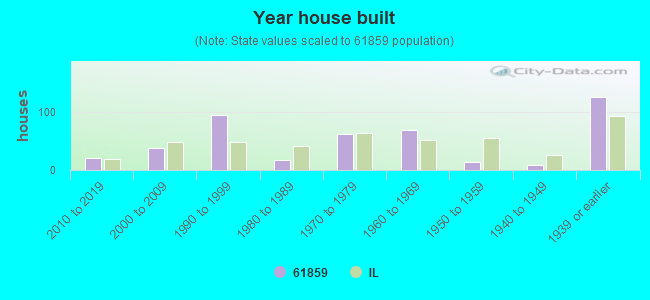
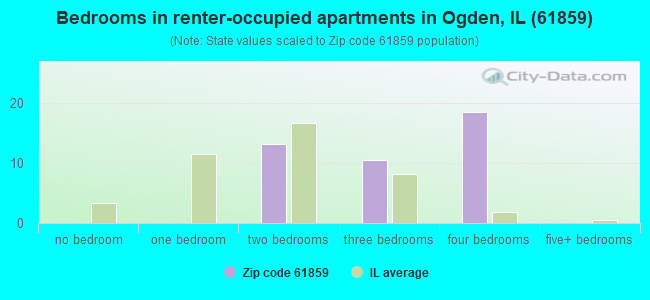
Houses and condos: 459 Renter-occupied apartments: 44
% of renters here:
10%
State:
33%
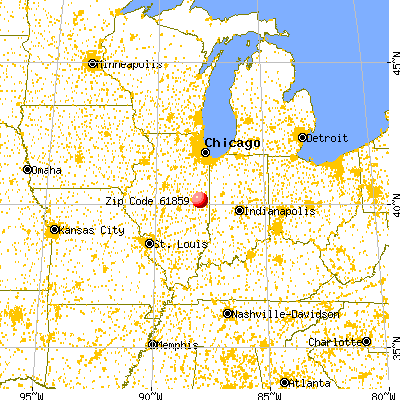
March 2022 cost of living index in zip code 61859: 85.7 (less than average, U.S. average is 100)
Land area: 31.3 sq. mi. Water area: 0.0 sq. mi.
Population density: 39 people per square mile
(very low).
OSM Map
General Map
Google Map
MSN Map
OSM Map
General Map
Google Map
MSN Map
OSM Map
General Map
Google Map
MSN Map
OSM Map
General Map
Google Map
MSN Map
Please wait while loading the map...
Real estate property taxes paid for housing units in 2022:
This zip code:
1.9% ($3,328)
Illinois:
2.0% ($4,912)
Median real estate property taxes paid for housing units with mortgages in 2022: $3,439 (2.0%) Median real estate property taxes paid for housing units with no mortgage in 2022: $3,115 (1.9%)
Business Search- 14 Million verified businesses
Males: 638
(52.0%)
Females: 588
(48.0%)
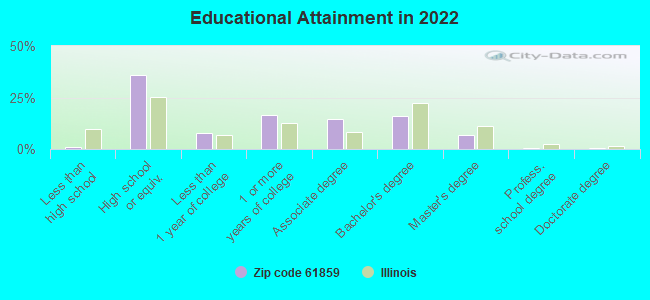
For population 25 years and over in 61859:
High school or higher: 98.6%
Bachelor's degree or higher: 24.0%
Graduate or professional degree: 8.0%
Unemployed: 4.9%
Mean travel time to work (commute): 21.9 minutes
For population 15 years and over in 61859:
Never married: 28.3%
Now married: 56.9%
Separated: 1.1%
Widowed: 5.0%
Divorced: 8.7%
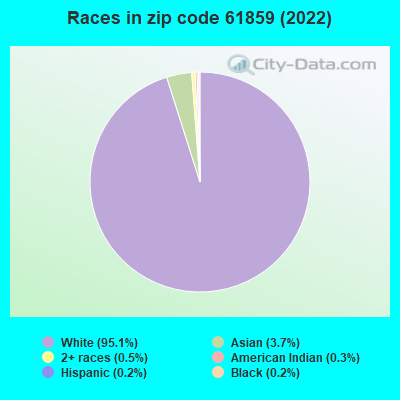
Zip code 61859 compared to state average:
Black race population percentage significantly below state average.
Hispanic race population percentage significantly below state average.
Foreign-born population percentage significantly below state average.
Renting percentage significantly below state average.
Length of stay since moving in significantly above state average.
Percentage of population with a bachelor's degree or higher below state average.
Averages for the 2020 tax year for zip code 61859, filed in 2021:
Average Adjusted Gross Income (AGI) in 2020: $73,331 (Individual Income Tax Returns)
Here:
$73,331
State:
$82,626
Salary/wage: $58,841 (reported on 84.5% of returns)
Here:
$58,841
State:
$66,640
(% of AGI for various income ranges: 1165.0% for AGIs below $25k, 3446.9% for AGIs $25k-50k, 7444.0% for AGIs $50k-75k, 8213.3% for AGIs $75k-100k, 18461.2% for AGIs $100k-200k)
Taxable interest for individuals: $538 (reported on 41.4% of returns)
This zip code:
$538
Illinois:
$2,376
(% of AGI for various income ranges: 17.5% for AGIs below $25k, 10.0% for AGIs $25k-50k, 54.0% for AGIs $50k-75k, 21.7% for AGIs $75k-100k, 77.5% for AGIs $100k-200k)
Ordinary dividends: $2,777 (reported on 22.4% of returns)
Here:
$2,777
State:
$9,061
(% of AGI for various income ranges: 86.2% for AGIs $25k-50k, 66.7% for AGIs $75k-100k, 261.2% for AGIs $100k-200k)
Net capital gain/loss in AGI: +$5,725 (reported on 20.7% of returns)
Here:
+$5,725
State:
+$31,684
(% of AGI for various income ranges: 39.2% for AGIs $25k-50k, 231.7% for AGIs $75k-100k, 621.2% for AGIs $100k-200k)
Profit/loss from business: +$5,914 (reported on 12.1% of returns)
Here:
+$5,914
State:
+$12,175
(% of AGI for various income ranges: 191.2% for AGIs below $25k, 208.0% for AGIs $50k-75k, 196.2% for AGIs $100k-200k)
Taxable individual retirement arrangement distribution: $17,017 (reported on 10.3% of returns)
61859:
$17,017
Illinois:
$21,613
(% of AGI for various income ranges: 248.5% for AGIs $25k-50k, 872.5% for AGIs $100k-200k)
Total itemized deductions: $29,150 (reported on 3.4% of returns)
Here:
$29,150
State:
$34,948
(% of AGI for various income ranges: 1166.0% for AGIs $50k-75k)
Taxes paid: $6,950 (reported on 3.4% of returns)
61859:
$6,950
State:
$8,563
(% of AGI for various income ranges: 106.9% for AGIs $25k-50k)
Earned income credit: $2,860 (reported on 8.6% of returns)
Here:
$2,860
State:
$2,311
(% of AGI for various income ranges: 91.2% for AGIs below $25k, 53.8% for AGIs $25k-50k)
Percentage of individuals using paid preparers for their 2020 taxes: 96.6%
Here:
97%
State:
93%
(% for various income ranges: 91.7% for AGIs below $25k, 93.8% for AGIs $25k-50k, 100.0% for AGIs $50k-75k, 100.0% for AGIs $75k-100k, 116.7% for AGIs $100k-200k, 0.0% for AGIs over 200k)
Averages for the 2012 tax year for zip code 61859, filed in 2013:
Average Adjusted Gross Income (AGI) in 2012: $59,693 (Individual Income Tax Returns)
Here:
$59,693
State:
$68,058
Salary/wage: $46,725 (reported on 85.0% of returns)
Here:
$46,725
State:
$55,396
(% of AGI for various income ranges: 75.9% for AGIs below $25k, 76.4% for AGIs $25k-50k, 72.6% for AGIs $50k-75k, 78.0% for AGIs $75k-100k, 53.1% for AGIs $100k-200k)
Taxable interest for individuals: $508 (reported on 41.7% of returns)
This zip code:
$508
Illinois:
$1,969
(% of AGI for various income ranges: 0.8% for AGIs below $25k, 0.4% for AGIs $25k-50k, 0.2% for AGIs $50k-75k, 0.2% for AGIs $75k-100k, 0.4% for AGIs $100k-200k)
Ordinary dividends: $830 (reported on 16.7% of returns)
Here:
$830
State:
$7,786
(% of AGI for various income ranges: 0.6% for AGIs $25k-50k, 0.2% for AGIs $75k-100k, 0.2% for AGIs $100k-200k)
Net capital gain/loss in AGI: +$1,175 (reported on 13.3% of returns)
Here:
+$1,175
State:
+$22,183
Profit/loss from business: +$3,978 (reported on 15.0% of returns)
Here:
+$3,978
State:
+$12,903
(% of AGI for various income ranges: 5.1% for AGIs below $25k, 2.9% for AGIs $50k-75k, 1.1% for AGIs $75k-100k)
Taxable individual retirement arrangement distribution: $9,943 (reported on 11.7% of returns)
61859:
$9,943
Illinois:
$17,929
Total itemized deductions: $17,055 (18% of AGI, reported on 33.3% of returns)
Here:
$17,055
State:
$26,433
Here:
18.0% of AGI
State:
19.2% of AGI
(% of AGI for various income ranges: 10.5% for AGIs $25k-50k, 10.1% for AGIs $50k-75k, 10.4% for AGIs $75k-100k, 9.8% for AGIs $100k-200k)
Charity contributions: $3,092 (reported on 21.7% of returns)
Here:
$3,092
State:
$4,525
(% of AGI for various income ranges: 1.9% for AGIs $50k-75k, 1.3% for AGIs $75k-100k, 1.3% for AGIs $100k-200k)
Taxes paid: $7,558 (reported on 31.7% of returns)
61859:
$7,558
State:
$11,968
(% of AGI for various income ranges: 2.9% for AGIs $25k-50k, 3.2% for AGIs $50k-75k, 4.3% for AGIs $75k-100k, 5.2% for AGIs $100k-200k)
Earned income credit: $2,029 (reported on 11.7% of returns)
Here:
$2,029
State:
$2,349
(% of AGI for various income ranges: 4.0% for AGIs below $25k, 1.1% for AGIs $25k-50k)
Percentage of individuals using paid preparers for their 2012 taxes: 55.0%
Here:
55%
State:
57%
(% for various income ranges: 44.4% for AGIs below $25k, 53.3% for AGIs $25k-50k, 66.7% for AGIs $50k-75k, 55.6% for AGIs $75k-100k, 66.7% for AGIs $100k-200k)
Averages for the 2004 tax year for zip code 61859, filed in 2005:
Average Adjusted Gross Income (AGI) in 2004: $42,438 (Individual Income Tax Returns)
Here:
$42,438
State:
$54,625
Salary/wage: $37,798 (reported on 87.5% of returns)
Here:
$37,798
State:
$46,811
(% of AGI for various income ranges: 86.2% for AGIs below $10k, 69.7% for AGIs $10k-25k, 73.2% for AGIs $25k-50k, 83.6% for AGIs $50k-75k, 84.1% for AGIs $75k-100k, 70.4% for AGIs over 100k)
Taxable interest for individuals: $815 (reported on 49.4% of returns)
This zip code:
$815
Illinois:
$2,101
(% of AGI for various income ranges: 2.0% for AGIs below $10k, 2.5% for AGIs $10k-25k, 1.5% for AGIs $25k-50k, 0.6% for AGIs $50k-75k, 0.7% for AGIs $75k-100k, 0.5% for AGIs over 100k)
Taxable dividends: $698 (reported on 23.9% of returns)
Here:
$698
State:
$4,306
(% of AGI for various income ranges: 3.6% for AGIs below $10k, 0.6% for AGIs $10k-25k, 0.7% for AGIs $25k-50k, 0.3% for AGIs $50k-75k, 0.1% for AGIs $75k-100k, 0.1% for AGIs over 100k)
Net capital gain/loss: +$3,069 (reported on 14.0% of returns)
Here:
+$3,069
State:
+$17,321
(% of AGI for various income ranges: -1.2% for AGIs below $10k, -0.1% for AGIs $10k-25k, 0.2% for AGIs $25k-50k, 0.2% for AGIs $50k-75k, 0.3% for AGIs $75k-100k, 4.5% for AGIs over 100k)
Profit/loss from business: +$4,680 (reported on 16.1% of returns)
Here:
+$4,680
State:
+$11,771
(% of AGI for various income ranges: 2.7% for AGIs below $10k, 6.7% for AGIs $10k-25k, 1.6% for AGIs $25k-50k, 2.2% for AGIs $50k-75k, 0.8% for AGIs $75k-100k)
Profit/loss from farming: +$12,361 (reported on 5.8% of returns)
Here:
+$12,361
State:
+$2,327
Total itemized deductions: $13,815 (20% of AGI, reported on 26.0% of returns)
Here:
$13,815
State:
$20,239
Here:
20.2% of AGI
State:
19.5% of AGI
(% of AGI for various income ranges: 7.3% for AGIs $10k-25k, 8.5% for AGIs $25k-50k, 8.6% for AGIs $50k-75k, 10.2% for AGIs $75k-100k, 8.0% for AGIs over 100k)
Charity contributions deductions: $2,047 (3% of AGI, reported on 20.4% of returns)
Here:
$2,047
State:
$3,719
Here:
2.8% of AGI
State:
3.4% of AGI
(% of AGI for various income ranges: 1.1% for AGIs $25k-50k, 1.2% for AGIs $50k-75k, 1.1% for AGIs $75k-100k, 0.9% for AGIs over 100k)
Total tax: $5,054 (reported on 80.6% of returns)
61859:
$5,054
State:
$9,882
(% of AGI for various income ranges: 2.3% for AGIs below $10k, 4.9% for AGIs $10k-25k, 6.7% for AGIs $25k-50k, 8.5% for AGIs $50k-75k, 10.8% for AGIs $75k-100k, 16.1% for AGIs over 100k)
Earned income credit: $1,159 (reported on 10.1% of returns)
Here:
$1,159
State:
$1,788
Percentage of individuals using paid preparers for their 2004 taxes: 57.8%
Here:
58%
State:
61%
(% for various income ranges: 42.4% for AGIs below $10k, 62.9% for AGIs $10k-25k, 59.2% for AGIs $25k-50k, 58.6% for AGIs $50k-75k, 65.5% for AGIs $75k-100k, 71.8% for AGIs over 100k)
Household received Food Stamps/SNAP in the past 12 months: 9 Household did not receive Food Stamps/SNAP in the past 12 months: 433
Women who had a birth in the past 12 months: 9 (9 now married, 0 unmarried) Women who did not have a birth in the past 12 months: 240 (131 now married, 107 unmarried)
Housing units in zip code 61859 with a mortgage: 239 (6 second mortgage, 6 both second mortgage and home equity loan) Houses without a mortgage: 17
Median monthly owner costs for units with a mortgage: $1,262 Median monthly owner costs for units without a mortgage: $601
Residents with income below the poverty level in 2022:
This zip code:
4.3%
Whole state:
11.9%
Residents with income below 50% of the poverty level in 2022:
This zip code:
2.2%
Whole state:
5.7%
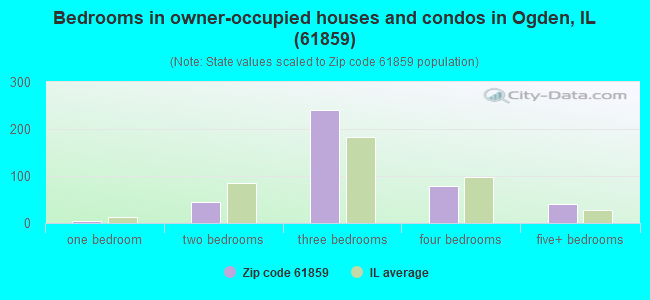
Median number of rooms in houses and condos:
Here:
6.5
State:
6.4
Median number of rooms in apartments:
Here:
5.7
State:
4.1
Notable locations in this zip code not listed on our city pages
Size of family households: 131 2-persons, 67 3-persons, 84 4-persons, 35 5-persons, 1 6-persons, 5 7-or-more-persons
Size of nonfamily households: 77 1-person, 45 2-persons
195 married couples with children.
35 single-parent households (22 men, 13 women).
95.2% of residents of 61859 zip code speak English at home.
0.3% of residents speak Spanish at home (100% not well).
3.7% of residents speak other Indo-European language at home (100% very well).
0.2% of residents speak other language at home (100% very well).
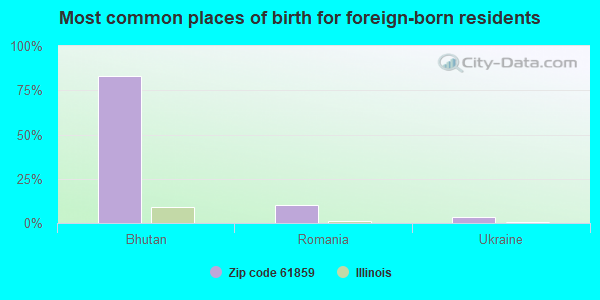
Foreign born population: 30 (2.5%) (100.0% of them are naturalized citizens)
This zip code:
2.5%
Whole state:
14.4%
83%Bhutan
10%Romania
3%Ukraine
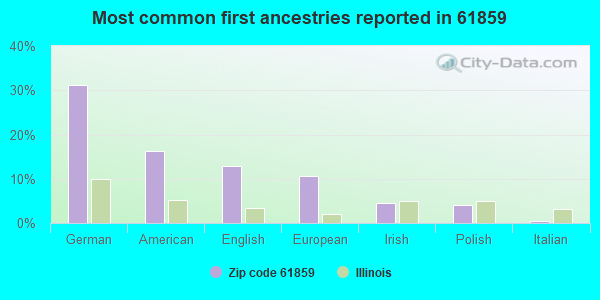
31%German
16%American
13%English
11%European
4%Irish
4%Polish
1%Italian
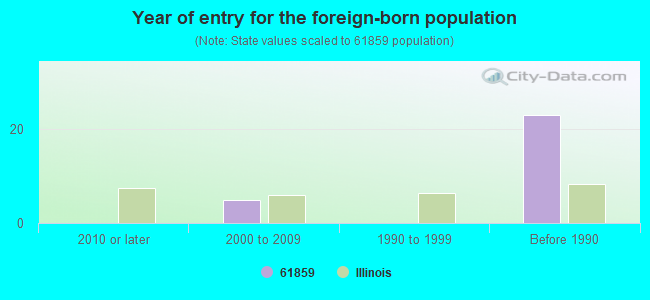
Year of entry for the foreign-born population
02010 or later
52000 to 2009
01990 to 1999
23Before 1990
Facilities with environmental interests located in this zip code:
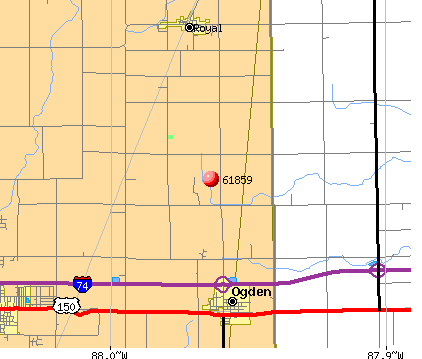
HOMER GRAIN CO (202 E BROADWAY in OGDEN, IL)
STATE MASTER (Illinois EPA Project) - AIR PROGRAM AIR MINOR (AIRS/AFS) Business SIC classification: GRAIN AND FIELD BEANS Alternative names: HOMER GRAIN CO.
OGDEN STP (ILLINOIS ROUTE 49 in OGDEN, IL)
STATE MASTER (Illinois EPA Project) - National Pollutant Discharge Elimination System Permit National Pollutant Discharge Elimination System NON-MAJOR (Tracking pollutant discharge elimination systems) - permit Business SIC classification: SEWERAGE SYSTEMS Alternative names: OGDEN STP, VILLAGE OF
OGDEN METALWORKS INC (301 N MARILYN AVE in OGDEN, IL)
STATE MASTER (Illinois EPA Project) - SOLID WASTE PROGRAM, HAZARDOUS WASTE PROGRAM Conditionally Exempt Small Quantity Generators, less than 100 kg/month of hazardous waste (Resource Conservation and Recovery Act (tracking hazardous waste)) Organizations: WRIGHT MIKE & MOHR JEFF (CONTACT/OWNER)
SADLER FEED MILL (107 E BROADWAY in OGDEN, IL)
STATE MASTER (Illinois EPA Project) - HAZARDOUS WASTE PROGRAM Small Quantity Generators, between 100 kg and 1000 kg of hazardous waste/month (Resource Conservation and Recovery Act (tracking hazardous waste)) - notification Organizations: FEGETT JERRY AND TRACY (CONTACT/OWNER)
OGDEN ELEM SCHOOL (PO BOX 99 in OGDEN, IL)
(National Center for Education Statistics) - STATE ID-0901021202001 Organizations: OGDEN COMM CONS SCH DIST 212 (SCHOOL DISTRICT)
COLONIAL PANTRY (I74 & RTE 49 in OGDEN, IL)
Small Quantity Generators, between 100 kg and 1000 kg of hazardous waste/month (Resource Conservation and Recovery Act (tracking hazardous waste)) - notification
Housing units lacking complete plumbing facilities: 1.1% Housing units lacking complete kitchen facilities: 1.1%
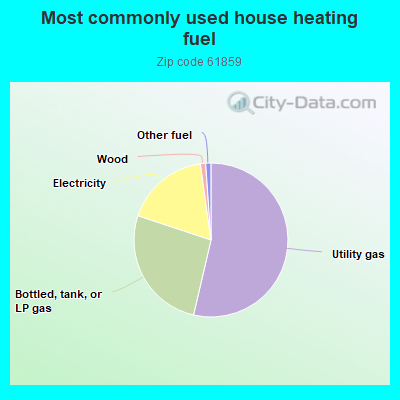
53.7%Utility gas
26.5%Bottled, tank, or LP gas
17.7%Electricity
1.1%Wood
1.1%Other fuel
Population in 1990: 1,397.
Place of birth for U.S.-born residents:
This state: 1,060
Northeast: 15
Midwest: 50
South: 48
West: 16
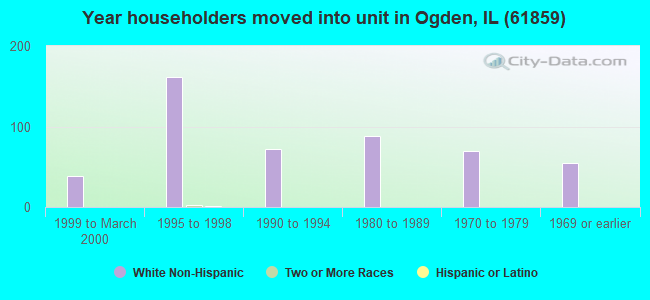
60% of the 61859 zip code residents lived in the same house 5 years ago. Out of people who lived in different houses, 78% lived in this county. Out of people who lived in different counties, 50% lived in Illinois.
96% of the 61859 zip code residents lived in the same house 1 year ago. Out of people who lived in different houses, 47% moved from this county. Out of people who lived in different houses, 50% moved from different county within same state.
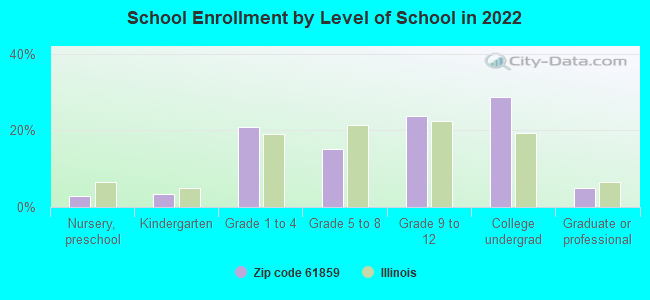
Private vs. public school enrollment:
Students in private schools in grades 1 to 8 (elementary and middle school): 6
Here:
5.4%
Illinois:
13.3%
Students in private schools in grades 9 to 12 (high school): 4
Here:
6.3%
Illinois:
9.9%
Students in private undergraduate colleges: 7
Here:
8.3%
Illinois:
27.4%
Occupation by median earnings in the past 12 months ($)
102,369Business and financial operations occupations
77,487Transportation occupations
69,024Construction and extraction occupations
66,976Production occupations
63,006Sales and related occupations
56,646Management occupations
Top industries in this zip code by the number of employees in 2005:
Construction: Plumbing, Heating, and Air-Conditioning Contractors (20-49 employees: 1 establishment)
Finance and Insurance: Commercial Banking (20-49: 1)
Real Estate and Rental and Leasing: Video Tape and Disc Rental (10-19: 1)
Accommodation and Food Services: Drinking Places (Alcoholic Beverages) (5-9: 1)
Construction: Power and Communication Line and Related Structures Construction (5-9: 1)
Fatal accident statistics in 2010:
Fatal accident count: 1
Vehicles involved in fatal accidents: 4
Fatal accidents caused by drunken drivers: 0
Fatalities: 1
Persons involved in fatal accidents: 3
Pedestrians involved in fatal accidents: 0
Home Mortgage Disclosure Act Aggregated Statistics For Year 2009 (Based on 2 partial tracts)
A) FHA, FSA/RHS & VA Home Purchase Loans
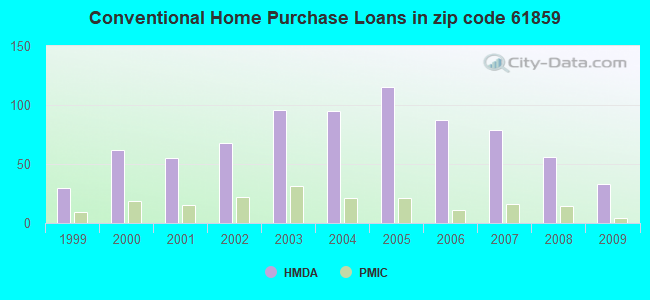
B) Conventional Home Purchase Loans
C) Refinancings
D) Home Improvement Loans
E) Loans on Dwellings For 5+ Families
F) Non-occupant Loans on < 5 Family Dwellings (A B C & D)
G) Loans On Manufactured Home Dwelling (A B C & D)
Number
Average Value
Number
Average Value
Number
Average Value
Number
Average Value
Number
Average Value
Number
Average Value
Number
Average Value
LOANS ORIGINATED
28
$131,841
33
$122,423
189
$138,156
14
$56,672
1
$91,660
8
$82,359
2
$109,650
APPLICATIONS APPROVED, NOT ACCEPTED
1
$102,010
2
$191,455
14
$128,199
0
$0
0
$0
0
$0
0
$0
APPLICATIONS DENIED
4
$124,310
3
$131,907
21
$142,443
3
$57,000
0
$0
1
$88,700
1
$88,210
APPLICATIONS WITHDRAWN
1
$182,340
0
$0
18
$134,891
0
$0
0
$0
0
$0
0
$0
FILES CLOSED FOR INCOMPLETENESS
0
$0
1
$251,820
6
$143,323
1
$83,780
0
$0
0
$0
0
$0
Aggregated Statistics For Year 2008 (Based on 2 partial tracts)
A) FHA, FSA/RHS & VA Home Purchase Loans
B) Conventional Home Purchase Loans
C) Refinancings
D) Home Improvement Loans
F) Non-occupant Loans on < 5 Family Dwellings (A B C & D)
G) Loans On Manufactured Home Dwelling (A B C & D)
Number
Average Value
Number
Average Value
Number
Average Value
Number
Average Value
Number
Average Value
Number
Average Value
LOANS ORIGINATED
16
$151,968
56
$117,621
85
$127,890
15
$36,533
11
$79,072
1
$118,760
APPLICATIONS APPROVED, NOT ACCEPTED
0
$0
2
$291,000
11
$103,667
1
$8,380
1
$35,480
0
$0
APPLICATIONS DENIED
1
$139,460
3
$91,333
21
$121,088
7
$102,854
0
$0
0
$0
APPLICATIONS WITHDRAWN
1
$203,530
4
$130,222
14
$130,169
2
$73,180
0
$0
0
$0
FILES CLOSED FOR INCOMPLETENESS
0
$0
0
$0
1
$211,900
0
$0
0
$0
0
$0
Aggregated Statistics For Year 2007 (Based on 2 partial tracts)
A) FHA, FSA/RHS & VA Home Purchase Loans
B) Conventional Home Purchase Loans
C) Refinancings
D) Home Improvement Loans
E) Loans on Dwellings For 5+ Families
F) Non-occupant Loans on < 5 Family Dwellings (A B C & D)
G) Loans On Manufactured Home Dwelling (A B C & D)
Number
Average Value
Number
Average Value
Number
Average Value
Number
Average Value
Number
Average Value
Number
Average Value
Number
Average Value
LOANS ORIGINATED
12
$152,398
79
$117,692
66
$118,578
25
$40,449
1
$293,710
8
$92,585
0
$0
APPLICATIONS APPROVED, NOT ACCEPTED
0
$0
5
$92,942
6
$93,550
2
$45,830
0
$0
1
$89,200
0
$0
APPLICATIONS DENIED
0
$0
6
$117,450
28
$122,338
11
$52,371
0
$0
1
$128,130
1
$86,240
APPLICATIONS WITHDRAWN
0
$0
3
$150,140
10
$124,925
2
$100,530
0
$0
0
$0
0
$0
FILES CLOSED FOR INCOMPLETENESS
0
$0
0
$0
7
$100,813
0
$0
0
$0
0
$0
0
$0
Aggregated Statistics For Year 2006 (Based on 2 partial tracts)
A) FHA, FSA/RHS & VA Home Purchase Loans
B) Conventional Home Purchase Loans
C) Refinancings
D) Home Improvement Loans
F) Non-occupant Loans on < 5 Family Dwellings (A B C & D)
G) Loans On Manufactured Home Dwelling (A B C & D)
Number
Average Value
Number
Average Value
Number
Average Value
Number
Average Value
Number
Average Value
Number
Average Value
LOANS ORIGINATED
10
$119,405
87
$112,392
67
$100,428
23
$38,888
12
$92,852
4
$61,600
APPLICATIONS APPROVED, NOT ACCEPTED
0
$0
5
$101,222
7
$99,123
2
$42,625
1
$54,700
1
$51,740
APPLICATIONS DENIED
1
$136,010
7
$92,083
24
$102,153
6
$93,140
1
$128,620
2
$69,240
APPLICATIONS WITHDRAWN
0
$0
5
$100,826
23
$133,184
2
$96,095
1
$88,210
0
$0
FILES CLOSED FOR INCOMPLETENESS
0
$0
2
$137,245
3
$139,627
0
$0
0
$0
0
$0
Aggregated Statistics For Year 2005 (Based on 2 partial tracts)
A) FHA, FSA/RHS & VA Home Purchase Loans
B) Conventional Home Purchase Loans
C) Refinancings
D) Home Improvement Loans
F) Non-occupant Loans on < 5 Family Dwellings (A B C & D)
G) Loans On Manufactured Home Dwelling (A B C & D)
Number
Average Value
Number
Average Value
Number
Average Value
Number
Average Value
Number
Average Value
Number
Average Value
LOANS ORIGINATED
10
$136,161
115
$109,217
88
$114,072
15
$36,697
12
$72,237
3
$117,450
APPLICATIONS APPROVED, NOT ACCEPTED
0
$0
7
$94,829
11
$97,126
3
$91,497
0
$0
0
$0
APPLICATIONS DENIED
0
$0
7
$100,954
35
$112,626
8
$50,512
0
$0
0
$0
APPLICATIONS WITHDRAWN
0
$0
5
$93,830
21
$131,272
3
$113,673
0
$0
0
$0
FILES CLOSED FOR INCOMPLETENESS
0
$0
1
$189,730
2
$129,605
1
$50,760
0
$0
0
$0
Aggregated Statistics For Year 2004 (Based on 2 partial tracts)
A) FHA, FSA/RHS & VA Home Purchase Loans
B) Conventional Home Purchase Loans
C) Refinancings
D) Home Improvement Loans
F) Non-occupant Loans on < 5 Family Dwellings (A B C & D)
G) Loans On Manufactured Home Dwelling (A B C & D)
Number
Average Value
Number
Average Value
Number
Average Value
Number
Average Value
Number
Average Value
Number
Average Value
LOANS ORIGINATED
12
$120,038
95
$107,420
109
$110,075
23
$38,031
14
$92,999
1
$29,570
APPLICATIONS APPROVED, NOT ACCEPTED
1
$155,230
3
$124,680
6
$130,838
2
$63,080
0
$0
0
$0
APPLICATIONS DENIED
0
$0
5
$105,164
28
$115,315
6
$25,708
1
$88,210
1
$45,340
APPLICATIONS WITHDRAWN
0
$0
5
$129,508
27
$109,329
2
$52,485
1
$107,430
0
$0
FILES CLOSED FOR INCOMPLETENESS
0
$0
0
$0
7
$124,186
0
$0
1
$111,370
0
$0
Aggregated Statistics For Year 2003 (Based on 2 partial tracts)
A) FHA, FSA/RHS & VA Home Purchase Loans
B) Conventional Home Purchase Loans
C) Refinancings
D) Home Improvement Loans
F) Non-occupant Loans on < 5 Family Dwellings (A B C & D)
Number
Average Value
Number
Average Value
Number
Average Value
Number
Average Value
Number
Average Value
LOANS ORIGINATED
12
$118,107
96
$99,951
246
$98,328
22
$21,347
18
$70,498
APPLICATIONS APPROVED, NOT ACCEPTED
0
$0
2
$130,345
23
$83,862
2
$21,435
3
$54,700
APPLICATIONS DENIED
0
$0
5
$116,202
36
$104,227
4
$48,910
2
$67,020
APPLICATIONS WITHDRAWN
1
$119,260
4
$107,308
17
$103,343
1
$26,120
0
$0
FILES CLOSED FOR INCOMPLETENESS
0
$0
1
$118,270
5
$88,310
1
$48,290
0
$0
Aggregated Statistics For Year 2002 (Based on 2 partial tracts)
A) FHA, FSA/RHS & VA Home Purchase Loans
B) Conventional Home Purchase Loans
C) Refinancings
D) Home Improvement Loans
F) Non-occupant Loans on < 5 Family Dwellings (A B C & D)
Number
Average Value
Number
Average Value
Number
Average Value
Number
Average Value
Number
Average Value
LOANS ORIGINATED
12
$109,032
68
$101,604
170
$95,232
21
$23,115
11
$74,144
APPLICATIONS APPROVED, NOT ACCEPTED
1
$60,120
3
$145,047
11
$78,937
0
$0
0
$0
APPLICATIONS DENIED
0
$0
2
$111,125
26
$92,135
3
$18,233
1
$38,440
APPLICATIONS WITHDRAWN
0
$0
4
$136,630
13
$105,422
1
$65,050
0
$0
FILES CLOSED FOR INCOMPLETENESS
0
$0
0
$0
4
$95,850
0
$0
0
$0
Aggregated Statistics For Year 2001 (Based on 2 partial tracts)
A) FHA, FSA/RHS & VA Home Purchase Loans
B) Conventional Home Purchase Loans
C) Refinancings
D) Home Improvement Loans
F) Non-occupant Loans on < 5 Family Dwellings (A B C & D)
Number
Average Value
Number
Average Value
Number
Average Value
Number
Average Value
Number
Average Value
LOANS ORIGINATED
11
$99,276
55
$99,107
120
$90,429
24
$24,291
8
$81,435
APPLICATIONS APPROVED, NOT ACCEPTED
0
$0
2
$94,620
8
$64,804
2
$23,900
0
$0
APPLICATIONS DENIED
1
$150,300
1
$108,420
24
$65,029
4
$17,370
1
$38,930
APPLICATIONS WITHDRAWN
0
$0
3
$107,267
16
$81,866
1
$13,310
0
$0
FILES CLOSED FOR INCOMPLETENESS
0
$0
1
$42,380
2
$121,230
0
$0
0
$0
Aggregated Statistics For Year 2000 (Based on 2 partial tracts)
A) FHA, FSA/RHS & VA Home Purchase Loans
B) Conventional Home Purchase Loans
C) Refinancings
D) Home Improvement Loans
F) Non-occupant Loans on < 5 Family Dwellings (A B C & D)
Number
Average Value
Number
Average Value
Number
Average Value
Number
Average Value
Number
Average Value
LOANS ORIGINATED
5
$89,394
62
$86,280
36
$70,320
22
$13,821
8
$68,068
APPLICATIONS APPROVED, NOT ACCEPTED
0
$0
0
$0
3
$62,913
1
$37,450
0
$0
APPLICATIONS DENIED
0
$0
7
$51,674
15
$42,217
4
$35,235
0
$0
APPLICATIONS WITHDRAWN
0
$0
3
$74,577
6
$75,233
2
$32,525
0
$0
FILES CLOSED FOR INCOMPLETENESS
0
$0
0
$0
0
$0
0
$0
0
$0
Aggregated Statistics For Year 1999 (Based on 1 partial tract)
A) FHA, FSA/RHS & VA Home Purchase Loans
B) Conventional Home Purchase Loans
C) Refinancings
D) Home Improvement Loans
F) Non-occupant Loans on < 5 Family Dwellings (A B C & D)


 Nearest zip codes: 61871, 61873, 61812, 61844, 61857, 61849.