Estimated zip code population in 2022: 1,928 Zip code population in 2010: 1,842 Zip code population in 2000: 1,754
Houses and condos: 829 Renter-occupied apartments: 84
% of renters here:
11%
State:
33%
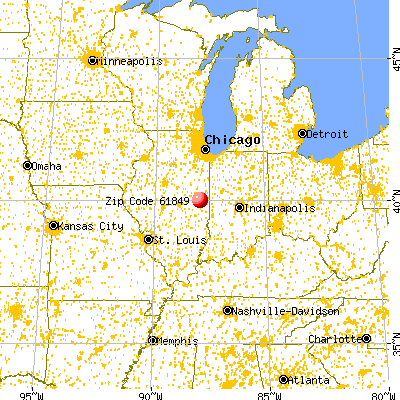
March 2022 cost of living index in zip code 61849: 84.7 (less than average, U.S. average is 100)
Land area: 57.5 sq. mi. Water area: 0.2 sq. mi.
Population density: 34 people per square mile
(very low).
OSM Map
General Map
Google Map
MSN Map
OSM Map
General Map
Google Map
MSN Map
OSM Map
General Map
Google Map
MSN Map
OSM Map
General Map
Google Map
MSN Map
Please wait while loading the map...
Real estate property taxes paid for housing units in 2022:
This zip code:
1.6% ($2,785)
Illinois:
2.0% ($4,912)
Median real estate property taxes paid for housing units with mortgages in 2022: $2,519 (1.4%) Median real estate property taxes paid for housing units with no mortgage in 2022: $3,371 (2.3%)
Business Search- 14 Million verified businesses
Males: 1,000
(51.9%)
Females: 927
(48.1%)
For population 25 years and over in 61849:
High school or higher: 95.7%
Bachelor's degree or higher: 19.4%
Graduate or professional degree: 5.3%
Unemployed: 1.7%
Mean travel time to work (commute): 26.9 minutes
For population 15 years and over in 61849:
Never married: 26.1%
Now married: 56.7%
Separated: 0.5%
Widowed: 4.5%
Divorced: 12.2%
Zip code 61849 compared to state average:
Unemployed percentage below state average.
Black race population percentage significantly below state average.
Hispanic race population percentage significantly below state average.
Foreign-born population percentage significantly below state average.
Renting percentage significantly below state average.
Length of stay since moving in significantly above state average.
Percentage of population with a bachelor's degree or higher below state average.
Estimated median house/condo value in 2022: $169,312
61849:
$169,312
Illinois:
$251,600
Median resident age:
This zip code:
42.3 years
Illinois median age:
39.1 years
Average household size:
This zip code:
2.5 people
Illinois:
2.4 people
Averages for the 2020 tax year for zip code 61849, filed in 2021:
Average Adjusted Gross Income (AGI) in 2020: $69,045 (Individual Income Tax Returns)
Here:
$69,045
State:
$82,626
Salary/wage: $52,987 (reported on 82.4% of returns)
Here:
$52,987
State:
$66,640
(% of AGI for various income ranges: 1268.8% for AGIs below $25k, 3464.7% for AGIs $25k-50k, 5431.8% for AGIs $50k-75k, 9551.4% for AGIs $75k-100k, 13522.2% for AGIs $100k-200k)
Taxable interest for individuals: $1,591 (reported on 37.6% of returns)
This zip code:
$1,591
Illinois:
$2,376
(% of AGI for various income ranges: 56.2% for AGIs below $25k, 25.3% for AGIs $25k-50k, 12.7% for AGIs $50k-75k, 140.0% for AGIs $75k-100k, 134.4% for AGIs $100k-200k)
Ordinary dividends: $4,180 (reported on 17.6% of returns)
Here:
$4,180
State:
$9,061
(% of AGI for various income ranges: 29.4% for AGIs below $25k, 25.9% for AGIs $25k-50k, 164.3% for AGIs $75k-100k, 467.8% for AGIs $100k-200k)
Net capital gain/loss in AGI: +$7,677 (reported on 15.3% of returns)
Here:
+$7,677
State:
+$31,684
(% of AGI for various income ranges: 15.3% for AGIs $25k-50k, 35.7% for AGIs $75k-100k, 1052.2% for AGIs $100k-200k)
Profit/loss from business: +$10,591 (reported on 12.9% of returns)
Here:
+$10,591
State:
+$12,175
(% of AGI for various income ranges: 151.2% for AGIs below $25k, 331.8% for AGIs $50k-75k, 620.0% for AGIs $100k-200k)
Taxable individual retirement arrangement distribution: $13,010 (reported on 11.8% of returns)
61849:
$13,010
Illinois:
$21,613
(% of AGI for various income ranges: 227.1% for AGIs $25k-50k, 425.7% for AGIs $75k-100k, 685.6% for AGIs $100k-200k)
Total itemized deductions: $26,833 (reported on 3.5% of returns)
Here:
$26,833
State:
$34,948
(% of AGI for various income ranges: 1150.0% for AGIs $75k-100k)
Charity contributions: $6,350 (reported on 2.4% of returns)
Here:
$6,350
State:
$13,122
(% of AGI for various income ranges: 115.5% for AGIs $50k-75k)
Taxes paid: $8,467 (reported on 3.5% of returns)
61849:
$8,467
State:
$8,563
(% of AGI for various income ranges: 362.9% for AGIs $75k-100k)
Earned income credit: $2,212 (reported on 9.4% of returns)
Here:
$2,212
State:
$2,311
(% of AGI for various income ranges: 55.6% for AGIs below $25k, 51.8% for AGIs $25k-50k)
Percentage of individuals using paid preparers for their 2020 taxes: 95.3%
Here:
95%
State:
93%
(% for various income ranges: 90.9% for AGIs below $25k, 95.0% for AGIs $25k-50k, 100.0% for AGIs $50k-75k, 90.9% for AGIs $75k-100k, 100.0% for AGIs $100k-200k, 100.0% for AGIs over 200k)
Averages for the 2012 tax year for zip code 61849, filed in 2013:
Average Adjusted Gross Income (AGI) in 2012: $56,526 (Individual Income Tax Returns)
Here:
$56,526
State:
$68,058
Salary/wage: $41,436 (reported on 83.3% of returns)
Here:
$41,436
State:
$55,396
(% of AGI for various income ranges: 74.4% for AGIs below $25k, 76.0% for AGIs $25k-50k, 72.9% for AGIs $50k-75k, 67.0% for AGIs $75k-100k, 69.3% for AGIs $100k-200k)
Taxable interest for individuals: $1,412 (reported on 36.7% of returns)
This zip code:
$1,412
Illinois:
$1,969
(% of AGI for various income ranges: 0.9% for AGIs below $25k, 0.5% for AGIs $25k-50k, 0.8% for AGIs $50k-75k, 0.4% for AGIs $75k-100k, 1.0% for AGIs $100k-200k, 2.1% for AGIs over 200k)
Ordinary dividends: $3,473 (reported on 16.7% of returns)
Here:
$3,473
State:
$7,786
(% of AGI for various income ranges: 1.1% for AGIs $25k-50k, 1.4% for AGIs $50k-75k, 1.1% for AGIs $75k-100k, 1.5% for AGIs $100k-200k)
Net capital gain/loss in AGI: +$3,446 (reported on 14.4% of returns)
Here:
+$3,446
State:
+$22,183
(% of AGI for various income ranges: 3.7% for AGIs $100k-200k)
Profit/loss from business: +$11,677 (reported on 14.4% of returns)
Here:
+$11,677
State:
+$12,903
(% of AGI for various income ranges: 5.9% for AGIs below $25k, 2.9% for AGIs $25k-50k, 3.6% for AGIs $50k-75k, 5.5% for AGIs $100k-200k)
Taxable individual retirement arrangement distribution: $9,090 (reported on 11.1% of returns)
61849:
$9,090
Illinois:
$17,929
(% of AGI for various income ranges: 3.6% for AGIs $25k-50k, 4.3% for AGIs $50k-75k, 1.3% for AGIs $100k-200k)
Total itemized deductions: $19,624 (19% of AGI, reported on 27.8% of returns)
Here:
$19,624
State:
$26,433
Here:
19.4% of AGI
State:
19.2% of AGI
(% of AGI for various income ranges: 9.9% for AGIs $25k-50k, 9.2% for AGIs $50k-75k, 9.9% for AGIs $75k-100k, 17.5% for AGIs $100k-200k)
Charity contributions: $3,322 (reported on 20.0% of returns)
Here:
$3,322
State:
$4,525
(% of AGI for various income ranges: 0.8% for AGIs $25k-50k, 1.4% for AGIs $50k-75k, 1.4% for AGIs $75k-100k, 2.1% for AGIs $100k-200k)
Taxes paid: $8,332 (reported on 27.8% of returns)
61849:
$8,332
State:
$11,968
(% of AGI for various income ranges: 2.6% for AGIs $25k-50k, 3.3% for AGIs $50k-75k, 3.6% for AGIs $75k-100k, 9.3% for AGIs $100k-200k)
Earned income credit: $2,167 (reported on 13.3% of returns)
Here:
$2,167
State:
$2,349
(% of AGI for various income ranges: 5.5% for AGIs below $25k, 1.0% for AGIs $25k-50k)
Percentage of individuals using paid preparers for their 2012 taxes: 55.6%
Here:
56%
State:
57%
(% for various income ranges: 42.9% for AGIs below $25k, 56.5% for AGIs $25k-50k, 58.8% for AGIs $50k-75k, 60.0% for AGIs $75k-100k, 90.0% for AGIs $100k-200k)
Averages for the 2004 tax year for zip code 61849, filed in 2005:
Average Adjusted Gross Income (AGI) in 2004: $41,778 (Individual Income Tax Returns)
Here:
$41,778
State:
$54,625
Salary/wage: $35,077 (reported on 83.7% of returns)
Here:
$35,077
State:
$46,811
(% of AGI for various income ranges: 109.0% for AGIs below $10k, 71.0% for AGIs $10k-25k, 72.0% for AGIs $25k-50k, 74.7% for AGIs $50k-75k, 76.6% for AGIs $75k-100k, 51.2% for AGIs over 100k)
Taxable interest for individuals: $1,269 (reported on 48.8% of returns)
This zip code:
$1,269
Illinois:
$2,101
(% of AGI for various income ranges: 4.3% for AGIs below $10k, 2.6% for AGIs $10k-25k, 1.6% for AGIs $25k-50k, 0.8% for AGIs $50k-75k, 0.7% for AGIs $75k-100k, 2.3% for AGIs over 100k)
Taxable dividends: $1,395 (reported on 23.5% of returns)
Here:
$1,395
State:
$4,306
(% of AGI for various income ranges: 1.3% for AGIs below $10k, 1.1% for AGIs $10k-25k, 0.8% for AGIs $25k-50k, 0.8% for AGIs $50k-75k, 0.3% for AGIs $75k-100k, 1.0% for AGIs over 100k)
Net capital gain/loss: +$1,732 (reported on 15.5% of returns)
Here:
+$1,732
State:
+$17,321
(% of AGI for various income ranges: -2.0% for AGIs below $10k, -0.0% for AGIs $10k-25k, 0.1% for AGIs $25k-50k, 0.2% for AGIs $50k-75k, 0.6% for AGIs $75k-100k, 2.6% for AGIs over 100k)
Profit/loss from business: +$6,815 (reported on 17.7% of returns)
Here:
+$6,815
State:
+$11,771
(% of AGI for various income ranges: 7.3% for AGIs below $10k, 6.5% for AGIs $10k-25k, 3.4% for AGIs $25k-50k, 2.7% for AGIs $50k-75k, 0.6% for AGIs $75k-100k, 2.7% for AGIs over 100k)
Profit/loss from farming: +$25,450 (reported on 6.6% of returns)
Here:
+$25,450
State:
+$2,327
IRA payment deduction: $2,500 (reported on 2.6% of returns)
61849:
$2,500
Illinois:
$3,087
Total itemized deductions: $14,143 (20% of AGI, reported on 25.9% of returns)
Here:
$14,143
State:
$20,239
Here:
20.2% of AGI
State:
19.5% of AGI
(% of AGI for various income ranges: 7.2% for AGIs $10k-25k, 8.0% for AGIs $25k-50k, 8.3% for AGIs $50k-75k, 10.5% for AGIs $75k-100k, 10.5% for AGIs over 100k)
Charity contributions deductions: $3,119 (4% of AGI, reported on 19.3% of returns)
Here:
$3,119
State:
$3,719
Here:
4.1% of AGI
State:
3.4% of AGI
(% of AGI for various income ranges: 1.0% for AGIs $10k-25k, 1.0% for AGIs $25k-50k, 1.6% for AGIs $50k-75k, 1.2% for AGIs $75k-100k, 2.3% for AGIs over 100k)
Total tax: $5,515 (reported on 79.2% of returns)
61849:
$5,515
State:
$9,882
(% of AGI for various income ranges: 2.8% for AGIs below $10k, 5.0% for AGIs $10k-25k, 6.8% for AGIs $25k-50k, 9.6% for AGIs $50k-75k, 11.6% for AGIs $75k-100k, 18.9% for AGIs over 100k)
Earned income credit: $1,565 (reported on 10.1% of returns)
Here:
$1,565
State:
$1,788
Percentage of individuals using paid preparers for their 2004 taxes: 59.4%
Here:
59%
State:
61%
(% for various income ranges: 41.4% for AGIs below $10k, 61.8% for AGIs $10k-25k, 63.5% for AGIs $25k-50k, 60.3% for AGIs $50k-75k, 62.3% for AGIs $75k-100k, 82.2% for AGIs over 100k)
Household received Food Stamps/SNAP in the past 12 months: 74 Household did not receive Food Stamps/SNAP in the past 12 months: 691
Women who had a birth in the past 12 months: 17 (10 now married, 6 unmarried) Women who did not have a birth in the past 12 months: 448 (213 now married, 233 unmarried)
Housing units in zip code 61849 with a mortgage: 425 (30 second mortgage, 30 both second mortgage and home equity loan) Houses without a mortgage: 1
Median monthly owner costs for units with a mortgage: $1,397 Median monthly owner costs for units without a mortgage: $687
Residents with income below the poverty level in 2022:
This zip code:
9.3%
Whole state:
11.9%
Residents with income below 50% of the poverty level in 2022:
This zip code:
1.5%
Whole state:
5.7%
Median number of rooms in houses and condos:
Here:
6.7
State:
6.4
Median number of rooms in apartments:
Here:
4.4
State:
4.1
Notable locations in this zip code not listed on our city pages
Notable locations in zip code 61849: Homer Park (A), Topline Farm (B), Homer Fire Protection District Station 1 (C), Homer Fire Protection District Station 2 (D). Display/hide their locations on the map
Size of family households: 333 2-persons, 76 3-persons, 65 4-persons, 45 5-persons, 18 6-persons, 10 7-or-more-persons
Size of nonfamily households: 193 1-person, 26 2-persons
269 married couples with children.
168 single-parent households (24 men, 144 women).
99.1% of residents of 61849 zip code speak English at home.
0.2% of residents speak Spanish at home (100% very well).
Foreign born population: 0 (0.0%)
:
0.0%
Whole state:
14.4%
32%German
18%American
16%English
5%Irish
3%Scandinavian
2%French
1%Dutch
Year of entry for the foreign-born population
02010 or later
02000 to 2009
01990 to 1999
10Before 1990
Facilities with environmental interests located in this zip code:
HOMER WTP (WEST CRITTENDEN STREET in HOMER, IL)
STATE MASTER (Illinois EPA Project) - National Pollutant Discharge Elimination System Permit National Pollutant Discharge Elimination System NON-MAJOR (Tracking pollutant discharge elimination systems) - permit Business SIC classification: WATER SUPPLY Alternative names: HOMER WTP, VILLAGE OF
HERITAGE ELEMENTARY SCHOOL -HOMER (512 W 1ST ST in HOMER, IL)
(Geographic Names Information System) (National Center for Education Statistics) - STATE ID-0901000802001 Organizations: HERITAGE COMM UNIT SCH DIST 8 (SCHOOL DISTRICT)
HERITAGE JR HIGH SCHOOL (512 W 1ST ST in HOMER, IL)
(National Center for Education Statistics) - STATE ID-0901000801001 Organizations: HERITAGE COMM UNIT SCH DIST 8 (SCHOOL DISTRICT)
7 ELEVEN #32875 (12108 W 159TH ST in HOMER, IL)
Small Quantity Generators, between 100 kg and 1000 kg of hazardous waste/month (Resource Conservation and Recovery Act (tracking hazardous waste)) - notification Organizations: 7 ELEVEN INC (CONTACT/OWNER)
AMOCO 3786 (151ST AND BELL SW CORNER in HOMER, IL)
Small Quantity Generators, between 100 kg and 1000 kg of hazardous waste/month (Resource Conservation and Recovery Act (tracking hazardous waste)) - notification Organizations: AMOCO OIL CO (CONTACT/OWNER)
ALLERTON SUPPLY COMPANY INCORPORATED HOMER LOCATION (1050 N 2600 E COUNTY ROAD in HOMER, IL)
ENFORCEMENT/COMPLIANCE ACTIVITY (Integrated Compliance Information System)
HOMER AIRPORT (STATE ROUTE 49 in HOMER, IL)
CRITERIA AND HAZARDOUS AIR POLLUTANT INVENTORY (Inventory of air pollution sources) Business SIC classification: AIRPORTS, FLYING FIELDS, AND AIRPORT TERMINAL SERVICES
Housing units lacking complete plumbing facilities: 1.5% Housing units lacking complete kitchen facilities: 1.3%
53.4%Utility gas
30.7%Bottled, tank, or LP gas
15.1%Electricity
0.9%Other fuel
Population in 1990: 1,624. Population change in the 1990s: +130 (+8.0%).
Place of birth for U.S.-born residents:
This state: 1,670
Northeast: 10
Midwest: 83
South: 65
West: 79
64% of the 61849 zip code residents lived in the same house 5 years ago. Out of people who lived in different houses, 65% lived in this county. Out of people who lived in different counties, 50% lived in Illinois.
97% of the 61849 zip code residents lived in the same house 1 year ago. Out of people who lived in different houses, 66% moved from this county. Out of people who lived in different houses, 25% moved from different county within same state. Out of people who lived in different houses, 6% moved from different state.
Private vs. public school enrollment:
Students in private schools in grades 1 to 8 (elementary and middle school): 17
Here:
7.3%
Illinois:
13.3%
Students in private schools in grades 9 to 12 (high school): 28
Here:
21.8%
Illinois:
9.9%
Students in private undergraduate colleges: 7
Here:
16.1%
Illinois:
27.4%
Occupation by median earnings in the past 12 months ($)
78,462Health diagnosing and treating practitioners and other technical occupations
77,442Management occupations
70,637Construction and extraction occupations
70,391Building and grounds cleaning and maintenance occupations
56,472Installation, maintenance, and repair occupations
53,437Production occupations
Top industries in this zip code by the number of employees in 2005:
Wholesale Trade: Grain and Field Bean Merchant Wholesalers (10-19 employees: 1 establishment)
Other Services (except Public Administration): Religious Organizations (5-9: 1, 1-4: 1)
Utilities: Electric Power Distribution (5-9: 1)
Administrative and Support and Waste Management and Remediation Services: Landscaping Services (5-9: 1)
Health Care and Social Assistance: Offices of Physicians (except Mental Health Specialists) (5-9: 1)
Finance and Insurance: Commercial Banking (5-9: 1)
Fatal accident statistics in 2014:
Fatal accident count: 1
Vehicles involved in fatal accidents: 2
Fatal accidents caused by drunken drivers: 0
Fatalities: 3
Persons involved in fatal accidents: 5
Pedestrians involved in fatal accidents: 0
Fatal accident statistics in 2012:
Fatal accident count: 2
Vehicles involved in fatal accidents: 3
Fatal accidents caused by drunken drivers: 1
Fatalities: 2
Persons involved in fatal accidents: 3
Pedestrians involved in fatal accidents: 0
Home Mortgage Disclosure Act Aggregated Statistics For Year 2009 (Based on 4 partial tracts)
A) FHA, FSA/RHS & VA Home Purchase Loans
B) Conventional Home Purchase Loans
C) Refinancings
D) Home Improvement Loans
F) Non-occupant Loans on < 5 Family Dwellings (A B C & D)
G) Loans On Manufactured Home Dwelling (A B C & D)
Number
Average Value
Number
Average Value
Number
Average Value
Number
Average Value
Number
Average Value
Number
Average Value
LOANS ORIGINATED
12
$106,349
17
$111,819
74
$118,250
5
$44,006
5
$93,010
3
$50,083
APPLICATIONS APPROVED, NOT ACCEPTED
0
$0
2
$154,185
6
$140,588
0
$0
0
$0
0
$0
APPLICATIONS DENIED
2
$105,670
3
$69,997
22
$95,398
2
$89,145
0
$0
0
$0
APPLICATIONS WITHDRAWN
1
$61,630
1
$141,930
10
$101,378
1
$170,380
0
$0
0
$0
FILES CLOSED FOR INCOMPLETENESS
0
$0
1
$78,240
2
$100,850
0
$0
0
$0
0
$0
Aggregated Statistics For Year 2008 (Based on 4 partial tracts)
A) FHA, FSA/RHS & VA Home Purchase Loans
B) Conventional Home Purchase Loans
C) Refinancings
D) Home Improvement Loans
F) Non-occupant Loans on < 5 Family Dwellings (A B C & D)
G) Loans On Manufactured Home Dwelling (A B C & D)
Number
Average Value
Number
Average Value
Number
Average Value
Number
Average Value
Number
Average Value
Number
Average Value
LOANS ORIGINATED
9
$110,330
20
$117,246
40
$103,010
7
$33,670
5
$54,364
1
$85,070
APPLICATIONS APPROVED, NOT ACCEPTED
0
$0
0
$0
6
$94,418
2
$39,220
0
$0
0
$0
APPLICATIONS DENIED
1
$78,440
2
$73,005
21
$108,972
7
$64,553
0
$0
0
$0
APPLICATIONS WITHDRAWN
1
$80,710
1
$113,610
10
$118,495
1
$65,120
0
$0
0
$0
FILES CLOSED FOR INCOMPLETENESS
0
$0
1
$156,600
1
$167,330
0
$0
0
$0
0
$0
Aggregated Statistics For Year 2007 (Based on 4 partial tracts)
A) FHA, FSA/RHS & VA Home Purchase Loans
B) Conventional Home Purchase Loans
C) Refinancings
D) Home Improvement Loans
F) Non-occupant Loans on < 5 Family Dwellings (A B C & D)
G) Loans On Manufactured Home Dwelling (A B C & D)
Number
Average Value
Number
Average Value
Number
Average Value
Number
Average Value
Number
Average Value
Number
Average Value
LOANS ORIGINATED
7
$87,619
27
$88,484
50
$87,295
16
$34,498
8
$56,280
2
$79,980
APPLICATIONS APPROVED, NOT ACCEPTED
0
$0
2
$45,980
8
$118,904
2
$50,230
1
$39,500
1
$79,340
APPLICATIONS DENIED
2
$53,300
9
$93,330
24
$120,596
10
$43,608
0
$0
2
$63,715
APPLICATIONS WITHDRAWN
0
$0
1
$146,260
9
$121,863
1
$46,700
0
$0
0
$0
FILES CLOSED FOR INCOMPLETENESS
0
$0
2
$107,910
4
$123,205
0
$0
0
$0
0
$0
Aggregated Statistics For Year 2006 (Based on 4 partial tracts)
A) FHA, FSA/RHS & VA Home Purchase Loans
B) Conventional Home Purchase Loans
C) Refinancings
D) Home Improvement Loans
F) Non-occupant Loans on < 5 Family Dwellings (A B C & D)
G) Loans On Manufactured Home Dwelling (A B C & D)
Number
Average Value
Number
Average Value
Number
Average Value
Number
Average Value
Number
Average Value
Number
Average Value
LOANS ORIGINATED
5
$69,798
40
$83,170
47
$97,864
18
$40,986
8
$56,616
1
$62,390
APPLICATIONS APPROVED, NOT ACCEPTED
1
$84,330
3
$83,063
6
$103,320
0
$0
0
$0
0
$0
APPLICATIONS DENIED
0
$0
11
$68,019
32
$102,422
11
$67,641
1
$23,630
0
$0
APPLICATIONS WITHDRAWN
0
$0
2
$135,475
22
$109,975
0
$0
0
$0
0
$0
FILES CLOSED FOR INCOMPLETENESS
1
$58,040
1
$65,140
4
$100,735
0
$0
0
$0
0
$0
Aggregated Statistics For Year 2005 (Based on 4 partial tracts)
A) FHA, FSA/RHS & VA Home Purchase Loans
B) Conventional Home Purchase Loans
C) Refinancings
D) Home Improvement Loans
F) Non-occupant Loans on < 5 Family Dwellings (A B C & D)
G) Loans On Manufactured Home Dwelling (A B C & D)
Number
Average Value
Number
Average Value
Number
Average Value
Number
Average Value
Number
Average Value
Number
Average Value
LOANS ORIGINATED
4
$89,760
37
$85,113
55
$103,961
12
$41,649
8
$59,318
3
$64,760
APPLICATIONS APPROVED, NOT ACCEPTED
1
$105,510
3
$98,200
8
$99,040
2
$1,915
0
$0
0
$0
APPLICATIONS DENIED
1
$62,120
8
$63,130
37
$100,036
8
$52,945
1
$21,310
2
$29,885
APPLICATIONS WITHDRAWN
0
$0
3
$90,810
14
$102,621
2
$67,645
1
$82,520
0
$0
FILES CLOSED FOR INCOMPLETENESS
0
$0
0
$0
4
$109,920
0
$0
0
$0
0
$0
Aggregated Statistics For Year 2004 (Based on 4 partial tracts)
A) FHA, FSA/RHS & VA Home Purchase Loans
B) Conventional Home Purchase Loans
C) Refinancings
D) Home Improvement Loans
F) Non-occupant Loans on < 5 Family Dwellings (A B C & D)
G) Loans On Manufactured Home Dwelling (A B C & D)
Number
Average Value
Number
Average Value
Number
Average Value
Number
Average Value
Number
Average Value
Number
Average Value
LOANS ORIGINATED
7
$84,766
47
$78,673
63
$103,022
10
$25,686
5
$45,688
3
$80,883
APPLICATIONS APPROVED, NOT ACCEPTED
1
$66,200
4
$61,525
8
$89,701
1
$41,260
1
$54,620
1
$31,040
APPLICATIONS DENIED
0
$0
7
$60,264
36
$88,751
7
$35,864
2
$70,335
2
$69,885
APPLICATIONS WITHDRAWN
0
$0
3
$96,773
23
$105,683
1
$30,940
0
$0
0
$0
FILES CLOSED FOR INCOMPLETENESS
0
$0
1
$51,090
6
$104,752
0
$0
0
$0
0
$0
Aggregated Statistics For Year 2003 (Based on 2 partial tracts)
A) FHA, FSA/RHS & VA Home Purchase Loans
B) Conventional Home Purchase Loans
C) Refinancings
D) Home Improvement Loans
F) Non-occupant Loans on < 5 Family Dwellings (A B C & D)
Number
Average Value
Number
Average Value
Number
Average Value
Number
Average Value
Number
Average Value
LOANS ORIGINATED
6
$96,802
29
$81,893
120
$88,738
10
$32,146
9
$45,088
APPLICATIONS APPROVED, NOT ACCEPTED
1
$99,290
3
$69,370
10
$91,587
1
$34,010
0
$0
APPLICATIONS DENIED
0
$0
4
$58,942
31
$81,349
6
$25,542
2
$65,290
APPLICATIONS WITHDRAWN
0
$0
3
$65,140
15
$91,647
1
$57,130
0
$0
FILES CLOSED FOR INCOMPLETENESS
0
$0
0
$0
1
$121,510
0
$0
0
$0
Aggregated Statistics For Year 2002 (Based on 2 partial tracts)
A) FHA, FSA/RHS & VA Home Purchase Loans
B) Conventional Home Purchase Loans
C) Refinancings
D) Home Improvement Loans
F) Non-occupant Loans on < 5 Family Dwellings (A B C & D)
Number
Average Value
Number
Average Value
Number
Average Value
Number
Average Value
Number
Average Value
LOANS ORIGINATED
6
$82,595
31
$77,722
83
$93,357
10
$25,889
4
$62,230
APPLICATIONS APPROVED, NOT ACCEPTED
0
$0
1
$89,770
8
$94,194
1
$16,780
1
$49,870
APPLICATIONS DENIED
0
$0
3
$61,813
20
$87,370
3
$5,743
0
$0
APPLICATIONS WITHDRAWN
0
$0
3
$143,880
8
$93,684
1
$12,700
0
$0
FILES CLOSED FOR INCOMPLETENESS
0
$0
0
$0
4
$66,082
0
$0
0
$0
Aggregated Statistics For Year 2001 (Based on 2 partial tracts)
A) FHA, FSA/RHS & VA Home Purchase Loans
B) Conventional Home Purchase Loans
C) Refinancings
D) Home Improvement Loans
F) Non-occupant Loans on < 5 Family Dwellings (A B C & D)
Number
Average Value
Number
Average Value
Number
Average Value
Number
Average Value
Number
Average Value
LOANS ORIGINATED
4
$60,755
24
$88,791
57
$85,804
15
$21,219
4
$56,675
APPLICATIONS APPROVED, NOT ACCEPTED
0
$0
1
$327,350
9
$64,634
2
$14,510
0
$0
APPLICATIONS DENIED
1
$68,460
5
$176,644
20
$58,398
8
$21,706
0
$0
APPLICATIONS WITHDRAWN
2
$66,425
3
$71,333
12
$74,698
2
$27,885
1
$45,790
FILES CLOSED FOR INCOMPLETENESS
0
$0
0
$0
2
$63,025
0
$0
0
$0
Aggregated Statistics For Year 2000 (Based on 2 partial tracts)
A) FHA, FSA/RHS & VA Home Purchase Loans
B) Conventional Home Purchase Loans
C) Refinancings
D) Home Improvement Loans
F) Non-occupant Loans on < 5 Family Dwellings (A B C & D)
Number
Average Value
Number
Average Value
Number
Average Value
Number
Average Value
Number
Average Value
LOANS ORIGINATED
6
$78,967
24
$79,005
14
$78,244
15
$16,897
1
$56,220
APPLICATIONS APPROVED, NOT ACCEPTED
0
$0
1
$50,780
5
$63,838
3
$11,790
0
$0
APPLICATIONS DENIED
1
$87,510
3
$48,060
12
$42,318
5
$24,846
0
$0
APPLICATIONS WITHDRAWN
1
$65,740
3
$57,130
9
$61,058
1
$6,350
1
$53,500
FILES CLOSED FOR INCOMPLETENESS
0
$0
0
$0
3
$57,883
0
$0
0
$0
Aggregated Statistics For Year 1999 (Based on 1 partial tract)
A) FHA, FSA/RHS & VA Home Purchase Loans
B) Conventional Home Purchase Loans
C) Refinancings
D) Home Improvement Loans
F) Non-occupant Loans on < 5 Family Dwellings (A B C & D)
Detailed PMIC statistics for the following Tracts:0108.00
, 0109.00
2002 - 2018 National Fire Incident Reporting System (NFIRS) incidents
Based on the data from the years 2002 - 2018 the average number of fires per year is 8. The highest number of reported fires - 17 took place in 2009, and the least - 2 in 2013. The data has a decreasing trend.
When looking into fire subcategories, the most incidents belonged to: Structure Fires (65.2%), and Outside Fires (19.1%).
Fire incident types reported to NFIRS in Zip Code 61849


 Nearest zip codes: 61816, 61810, 61877, 61859, 61873, 61841.


 Based on the data from the years 2002 - 2018 the average number of fires per year is 8. The highest number of reported fires - 17 took place in 2009, and the least - 2 in 2013. The data has a decreasing trend.
 When looking into fire subcategories, the most incidents belonged to: Structure Fires (65.2%), and Outside Fires (19.1%).