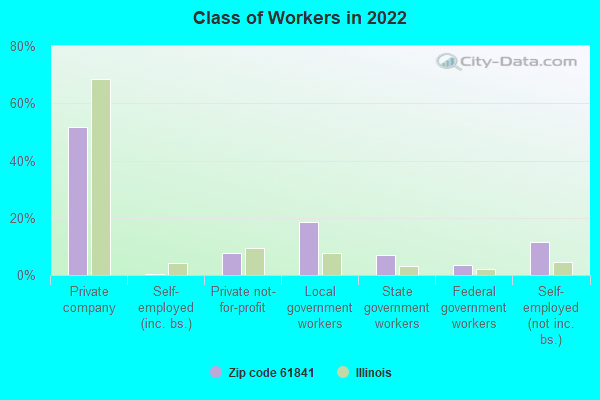
Estimated zip code population in 2022: 1,042 Zip code population in 2010: 1,386 Zip code population in 2000: 1,352
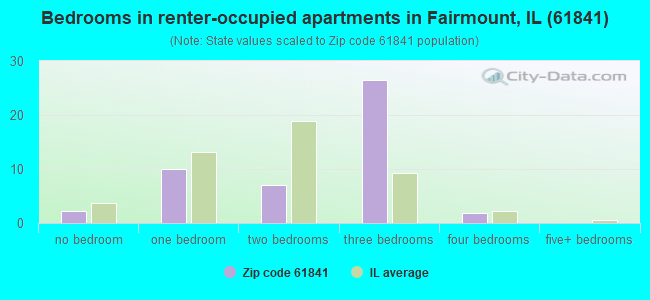
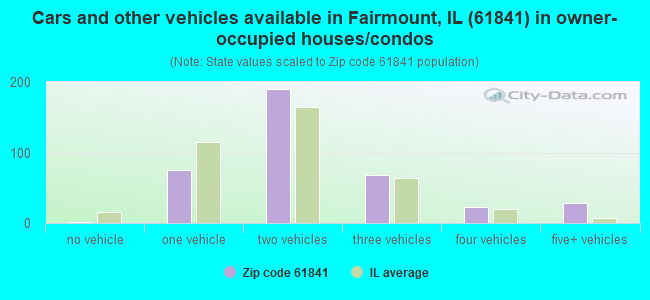
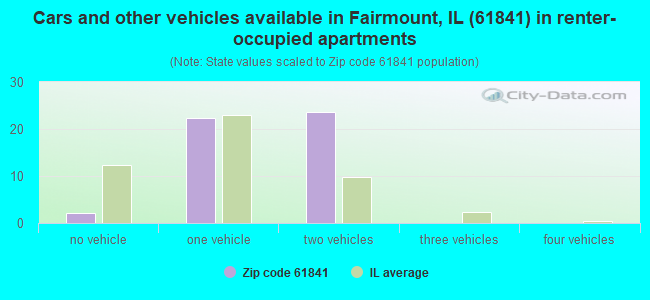
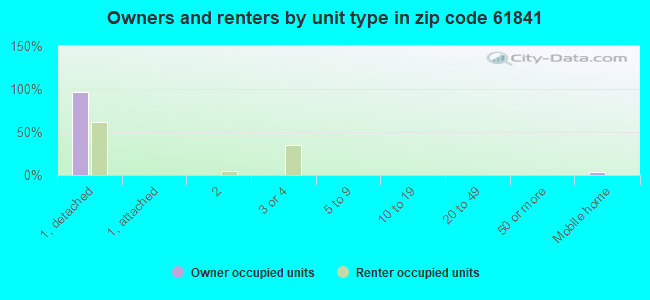
Houses and condos: 471 Renter-occupied apartments: 49
% of renters here:
11%
State:
33%
March 2022 cost of living index in zip code 61841: 84.1 (less than average, U.S. average is 100)
Land area: 57.8 sq. mi. Water area: 0.3 sq. mi.
Population density: 18 people per square mile
(very low).
OSM Map
General Map
Google Map
MSN Map
OSM Map
General Map
Google Map
MSN Map
OSM Map
General Map
Google Map
MSN Map
OSM Map
General Map
Google Map
MSN Map
Please wait while loading the map...
Real estate property taxes paid for housing units in 2022:
This zip code:
1.9% ($2,598)
Illinois:
2.0% ($4,912)
Median real estate property taxes paid for housing units with mortgages in 2022: $2,526 (2.1%) Median real estate property taxes paid for housing units with no mortgage in 2022: $2,693 (1.8%)
Business Search- 14 Million verified businesses
Males: 466
(44.8%)
Females: 575
(55.2%)
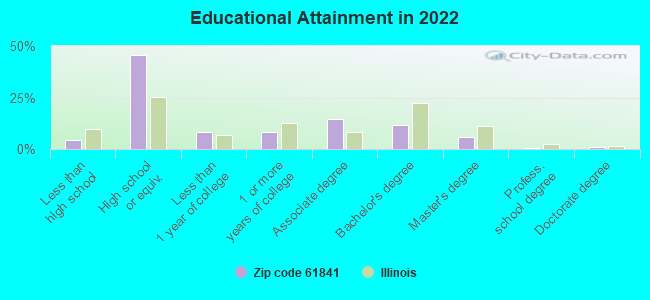
For population 25 years and over in 61841:
High school or higher: 94.6%
Bachelor's degree or higher: 18.8%
Graduate or professional degree: 7.3%
Unemployed: 2.9%
Mean travel time to work (commute): 23.0 minutes
For population 15 years and over in 61841:
Never married: 20.1%
Now married: 65.0%
Separated: 0.2%
Widowed: 4.5%
Divorced: 10.2%
Zip code 61841 compared to state average:
Median house value below state average.
Black race population percentage significantly below state average.
Hispanic race population percentage significantly below state average.
Median age above state average.
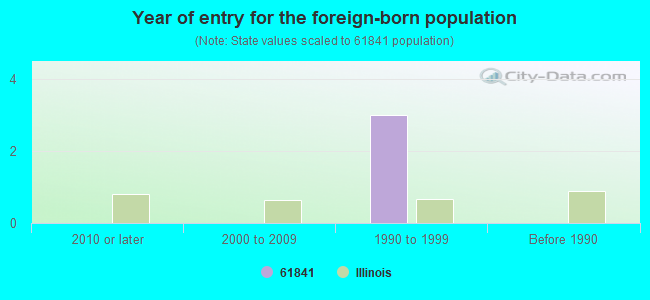
Foreign-born population percentage significantly below state average.
Renting percentage significantly below state average.
Length of stay since moving in significantly above state average.
Number of college students significantly below state average.
Percentage of population with a bachelor's degree or higher below state average.
Estimated median house/condo value in 2022: $133,324
61841:
$133,324
Illinois:
$251,600
According to our research of Illinois and other state lists, there were 2 registered sex offenders living in 61841 zip code as of May 29, 2024. The ratio of all residents to sex offenders in zip code 61841 is 697 to 1. The ratio of registered sex offenders to all residents in this zip code is near the state average.
Median resident age:
This zip code:
43.7 years
Illinois median age:
39.1 years
Average household size:
This zip code:
2.4 people
Illinois:
2.4 people
Averages for the 2020 tax year for zip code 61841, filed in 2021:
Average Adjusted Gross Income (AGI) in 2020: $63,192 (Individual Income Tax Returns)
Here:
$63,192
State:
$82,626
Salary/wage: $53,373 (reported on 79.7% of returns)
Here:
$53,373
State:
$66,640
(% of AGI for various income ranges: 1063.6% for AGIs below $25k, 2993.1% for AGIs $25k-50k, 5831.2% for AGIs $50k-75k, 7593.3% for AGIs $75k-100k, 15773.8% for AGIs $100k-200k)
Taxable interest for individuals: $600 (reported on 34.4% of returns)
This zip code:
$600
Illinois:
$2,376
(% of AGI for various income ranges: 9.3% for AGIs below $25k, 10.0% for AGIs $25k-50k, 47.5% for AGIs $50k-75k, 48.3% for AGIs $75k-100k, 48.8% for AGIs $100k-200k)
Ordinary dividends: $1,660 (reported on 15.6% of returns)
Here:
$1,660
State:
$9,061
(% of AGI for various income ranges: 30.0% for AGIs below $25k, 67.5% for AGIs $50k-75k, 87.5% for AGIs $100k-200k)
Net capital gain/loss in AGI: +$2,289 (reported on 14.1% of returns)
Here:
+$2,289
State:
+$31,684
(% of AGI for various income ranges: 17.9% for AGIs below $25k, 8.8% for AGIs $50k-75k, 217.5% for AGIs $100k-200k)
Profit/loss from business: +$18,100 (reported on 12.5% of returns)
Here:
+$18,100
State:
+$12,175
(% of AGI for various income ranges: 203.6% for AGIs below $25k, 341.2% for AGIs $50k-75k, 1112.5% for AGIs $100k-200k)
Taxable individual retirement arrangement distribution: $15,800 (reported on 7.8% of returns)
61841:
$15,800
Illinois:
$21,613
(% of AGI for various income ranges: 254.6% for AGIs $25k-50k, 765.0% for AGIs $75k-100k)
Earned income credit: $2,150 (reported on 12.5% of returns)
Here:
$2,150
State:
$2,311
(% of AGI for various income ranges: 75.7% for AGIs below $25k, 50.8% for AGIs $25k-50k)
Percentage of individuals using paid preparers for their 2020 taxes: 95.3%
Here:
95%
State:
93%
(% for various income ranges: 94.4% for AGIs below $25k, 93.3% for AGIs $25k-50k, 90.9% for AGIs $50k-75k, 100.0% for AGIs $75k-100k, 118.2% for AGIs $100k-200k, 0.0% for AGIs over 200k)
Averages for the 2012 tax year for zip code 61841, filed in 2013:
Average Adjusted Gross Income (AGI) in 2012: $56,390 (Individual Income Tax Returns)
Here:
$56,390
State:
$68,058
Salary/wage: $40,509 (reported on 83.8% of returns)
Here:
$40,509
State:
$55,396
(% of AGI for various income ranges: 67.1% for AGIs below $25k, 74.7% for AGIs $25k-50k, 77.3% for AGIs $50k-75k, 68.5% for AGIs $75k-100k, 42.6% for AGIs $100k-200k)
Taxable interest for individuals: $1,005 (reported on 29.4% of returns)
This zip code:
$1,005
Illinois:
$1,969
(% of AGI for various income ranges: 0.8% for AGIs below $25k, 0.4% for AGIs $25k-50k, 0.3% for AGIs $50k-75k, 0.4% for AGIs $75k-100k, 0.7% for AGIs $100k-200k)
Ordinary dividends: $1,045 (reported on 16.2% of returns)
Here:
$1,045
State:
$7,786
(% of AGI for various income ranges: 0.9% for AGIs below $25k, 0.3% for AGIs $50k-75k, 0.4% for AGIs $100k-200k)
Net capital gain/loss in AGI: +$15,212 (reported on 11.8% of returns)
Here:
+$15,212
State:
+$22,183
(% of AGI for various income ranges: 7.8% for AGIs $100k-200k)
Profit/loss from business: +$5,590 (reported on 14.7% of returns)
Here:
+$5,590
State:
+$12,903
(% of AGI for various income ranges: 5.4% for AGIs below $25k, 2.9% for AGIs $25k-50k, 3.3% for AGIs $75k-100k)
Taxable individual retirement arrangement distribution: $11,286 (reported on 10.3% of returns)
61841:
$11,286
Illinois:
$17,929
Total itemized deductions: $19,488 (18% of AGI, reported on 23.5% of returns)
Here:
$19,488
State:
$26,433
Here:
17.6% of AGI
State:
19.2% of AGI
(% of AGI for various income ranges: 9.1% for AGIs $25k-50k, 7.0% for AGIs $50k-75k, 11.7% for AGIs $75k-100k, 8.2% for AGIs $100k-200k)
Charity contributions: $3,055 (reported on 16.2% of returns)
Here:
$3,055
State:
$4,525
(% of AGI for various income ranges: 1.7% for AGIs $25k-50k, 1.2% for AGIs $75k-100k, 1.0% for AGIs $100k-200k)
Taxes paid: $7,162 (reported on 23.5% of returns)
61841:
$7,162
State:
$11,968
(% of AGI for various income ranges: 2.1% for AGIs $25k-50k, 2.8% for AGIs $50k-75k, 3.9% for AGIs $75k-100k, 3.6% for AGIs $100k-200k)
Earned income credit: $2,218 (reported on 16.2% of returns)
Here:
$2,218
State:
$2,349
(% of AGI for various income ranges: 5.4% for AGIs below $25k, 1.4% for AGIs $25k-50k)
Percentage of individuals using paid preparers for their 2012 taxes: 58.8%
Here:
59%
State:
57%
(% for various income ranges: 50.0% for AGIs below $25k, 62.5% for AGIs $25k-50k, 63.6% for AGIs $50k-75k, 62.5% for AGIs $75k-100k, 66.7% for AGIs $100k-200k)
Averages for the 2004 tax year for zip code 61841, filed in 2005:
Average Adjusted Gross Income (AGI) in 2004: $42,951 (Individual Income Tax Returns)
Here:
$42,951
State:
$54,625
Salary/wage: $36,272 (reported on 84.8% of returns)
Here:
$36,272
State:
$46,811
(% of AGI for various income ranges: 137.8% for AGIs below $10k, 58.9% for AGIs $10k-25k, 75.6% for AGIs $25k-50k, 77.8% for AGIs $50k-75k, 73.4% for AGIs $75k-100k, 58.9% for AGIs over 100k)
Taxable interest for individuals: $1,880 (reported on 49.6% of returns)
This zip code:
$1,880
Illinois:
$2,101
(% of AGI for various income ranges: 6.1% for AGIs below $10k, 6.7% for AGIs $10k-25k, 1.4% for AGIs $25k-50k, 0.7% for AGIs $50k-75k, 1.4% for AGIs $75k-100k, 3.5% for AGIs over 100k)
Taxable dividends: $724 (reported on 22.8% of returns)
Here:
$724
State:
$4,306
(% of AGI for various income ranges: 1.2% for AGIs below $10k, 0.5% for AGIs $10k-25k, 0.5% for AGIs $25k-50k, 0.3% for AGIs $50k-75k, 0.3% for AGIs $75k-100k, 0.3% for AGIs over 100k)
Net capital gain/loss: +$1,600 (reported on 12.6% of returns)
Here:
+$1,600
State:
+$17,321
(% of AGI for various income ranges: -0.5% for AGIs $10k-25k, 0.0% for AGIs $25k-50k, 0.2% for AGIs $50k-75k, 2.0% for AGIs $75k-100k, 0.0% for AGIs over 100k)
Profit/loss from business: +$5,505 (reported on 17.4% of returns)
Here:
+$5,505
State:
+$11,771
(% of AGI for various income ranges: 10.4% for AGIs below $10k, 5.0% for AGIs $10k-25k, 3.2% for AGIs $25k-50k, 1.4% for AGIs $50k-75k, 2.7% for AGIs $75k-100k)
Profit/loss from farming: +$18,094 (reported on 5.0% of returns)
Here:
+$18,094
State:
+$2,327
IRA payment deduction: $1,900 (reported on 1.6% of returns)
61841:
$1,900
Illinois:
$3,087
Total itemized deductions: $14,199 (19% of AGI, reported on 22.1% of returns)
Here:
$14,199
State:
$20,239
Here:
18.6% of AGI
State:
19.5% of AGI
(% of AGI for various income ranges: 6.8% for AGIs $10k-25k, 6.6% for AGIs $25k-50k, 5.6% for AGIs $50k-75k, 10.2% for AGIs $75k-100k, 7.8% for AGIs over 100k)
Charity contributions deductions: $3,187 (4% of AGI, reported on 16.8% of returns)
Here:
$3,187
State:
$3,719
Here:
3.9% of AGI
State:
3.4% of AGI
(% of AGI for various income ranges: 0.8% for AGIs $25k-50k, 1.0% for AGIs $50k-75k, 1.7% for AGIs $75k-100k, 2.2% for AGIs over 100k)
Total tax: $6,110 (reported on 78.2% of returns)
61841:
$6,110
State:
$9,882
(% of AGI for various income ranges: 2.9% for AGIs below $10k, 4.4% for AGIs $10k-25k, 7.3% for AGIs $25k-50k, 9.4% for AGIs $50k-75k, 11.7% for AGIs $75k-100k, 20.3% for AGIs over 100k)
Earned income credit: $1,651 (reported on 13.0% of returns)
Here:
$1,651
State:
$1,788
Percentage of individuals using paid preparers for their 2004 taxes: 67.8%
Here:
68%
State:
61%
(% for various income ranges: 55.2% for AGIs below $10k, 71.2% for AGIs $10k-25k, 67.3% for AGIs $25k-50k, 74.8% for AGIs $50k-75k, 72.9% for AGIs $75k-100k, 66.7% for AGIs over 100k)
Household received Food Stamps/SNAP in the past 12 months: 34 Household did not receive Food Stamps/SNAP in the past 12 months: 399
Women who had a birth in the past 12 months: 1 (1 now married, 0 unmarried) Women who did not have a birth in the past 12 months: 216 (100 now married, 115 unmarried)
Housing units in zip code 61841 with a mortgage: 205 Median monthly owner costs for units with a mortgage: $1,272 Median monthly owner costs for units without a mortgage: $599
Residents with income below the poverty level in 2022:
This zip code:
8.4%
Whole state:
11.9%
Residents with income below 50% of the poverty level in 2022:
This zip code:
3.2%
Whole state:
5.7%
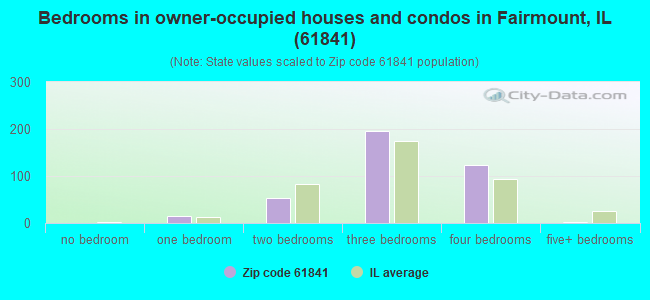
Median number of rooms in houses and condos:
Here:
6.7
State:
6.4
Median number of rooms in apartments:
Here:
5.3
State:
4.1
Notable locations in this zip code not listed on our city pages
Size of family households: 187 2-persons, 57 3-persons, 33 4-persons, 16 5-persons, 12 6-persons, 2 7-or-more-persons
Size of nonfamily households: 106 1-person, 17 2-persons, 3 4-persons
178 married couples with children.
43 single-parent households (22 men, 21 women).
98.9% of residents of 61841 zip code speak English at home.
0.9% of residents speak Spanish at home (100% very well).
Foreign born population: 0 (0.0%)
:
0.0%
Whole state:
14.4%
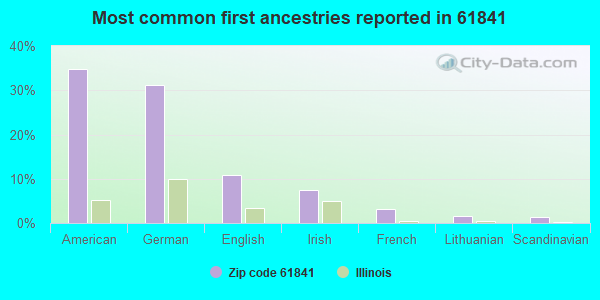
35%American
31%German
11%English
8%Irish
3%French
1%Lithuanian
1%Scandinavian
Year of entry for the foreign-born population
02010 or later
02000 to 2009
31990 to 1999
0Before 1990
Facilities with environmental interests located in this zip code:
HANSON MATERIAL SERVICE YD 16 (PO BOX 50 in FAIRMOUNT, IL)
STATE MASTER (Illinois EPA Project) - SOLID WASTE PROGRAM, HAZARDOUS WASTE PROGRAM, AIR PROGRAM STATE MASTER (Illinois EPA Project) - AIR PROGRAM STATE MASTER (Illinois EPA Project) - National Pollutant Discharge Elimination System Permit AIR MINOR (AIRS/AFS) COMPLIANCE ACTIVITY (Tracking inspections of insecticide, fungicide, and rodenticide, and toxic substances) CRITERIA AND HAZARDOUS AIR POLLUTANT INVENTORY (Inventory of air pollution sources) National Pollutant Discharge Elimination System NON-MAJOR (Tracking pollutant discharge elimination systems) - permit National Pollutant Discharge Elimination System NON-MAJOR (Tracking pollutant discharge elimination systems) - permit Conditionally Exempt Small Quantity Generators, less than 100 kg/month of hazardous waste (Resource Conservation and Recovery Act (tracking hazardous waste)) - notification Business SIC classification: CRUSHED AND BROKEN LIMESTONE; NONCLASSIFIABLE ESTABLISHMENTS Organizations: MATERIAL SERVICE CORPORATION (CONTACT/OWNER)
, MATERIAL SERVICE CORP (CONTACT/OWNER)
Alternative names: C & R AG SUPPLY INC, MATERIAL SERVICE CORP, MATERIAL SERV CORP FAIRMONT Q, MATERIAL SERVICE CORP #16, MATERIAL SERVICE CORP, YARD #16, MATERIAL SERVICE CORP-YD 16, MATERIAL SERVICE CORP
ASC MINERAL PROCESSING COMPANY (12637 NORTH 800 EAST ROAD in FAIRMOUNT, IL)
STATE MASTER (Illinois EPA Project) - AIR PROGRAM AIR MINOR (AIRS/AFS) ENFORCEMENT/COMPLIANCE ACTIVITY (Integrated Compliance Information System) COMPLIANCE ACTIVITY (Tracking inspections of insecticide, fungicide, and rodenticide, and toxic substances) CRITERIA AND HAZARDOUS AIR POLLUTANT INVENTORY (Inventory of air pollution sources) Business SIC classification: FERTILIZERS, MIXING ONLY Alternative names: ALLERTON SUPPLY COMPANY INCORPORATED FAIRMOUNT LOCATION, ALLERTON SUPPLY COM
APCON CORP (FAIRMOUNT QUARRY in FAIRMOUNT, IL)
STATE MASTER (Illinois EPA Project) - AIR PROGRAM AIR MINOR (AIRS/AFS) CRITERIA AND HAZARDOUS AIR POLLUTANT INVENTORY (Inventory of air pollution sources) Business SIC classification: ASPHALT PAVING MIXTURES AND BLOCKS Business NAICS classification: ASPHALT PAVING MIXTURE AND BLOCK MANUFACTURING.
ILL BELL TEL CO FAIRMOUNT C O (FRONT ST E OF MAIN in FAIRMOUNT, IL)
(Resource Conservation and Recovery Act (tracking hazardous waste)) Organizations: ILLINOIS BELL TELEPHONE CO (CONTACT/OWNER)
KNIGHT TRUCKING (RR #1, 850 N. & 680 E. in FAIRMOUNT, IL)
National Pollutant Discharge Elimination System NON-MAJOR (Tracking pollutant discharge elimination systems) - permit
ROHRSCHEIB VERN (1914 N 250 E RD in FAIRMOUNT, IL)
Small Quantity Generators, between 100 kg and 1000 kg of hazardous waste/month (Resource Conservation and Recovery Act (tracking hazardous waste)) - notification
Housing units lacking complete plumbing facilities: 5.7% Housing units lacking complete kitchen facilities: 5.8%
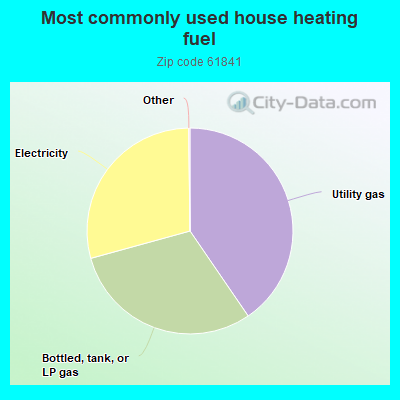
40.5%Utility gas
30.3%Bottled, tank, or LP gas
29.1%Electricity
Population in 1990: 1,317. Population change in the 1990s: +35 (+2.7%).
Place of birth for U.S.-born residents:
This state: 950
Northeast: 6
Midwest: 26
South: 11
West: 39
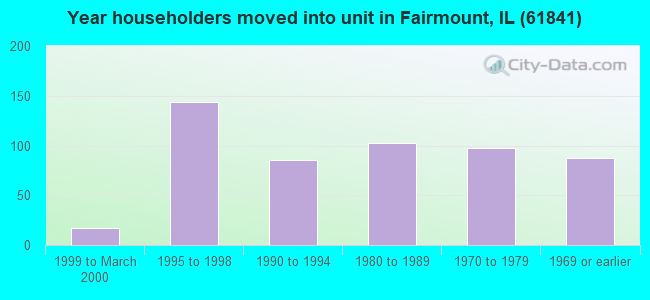
70% of the 61841 zip code residents lived in the same house 5 years ago. Out of people who lived in different houses, 58% lived in this county. Out of people who lived in different counties, 50% lived in Illinois.
99% of the 61841 zip code residents lived in the same house 1 year ago. Out of people who lived in different houses, 75% moved from this county. Out of people who lived in different houses, 25% moved from different state.
Private vs. public school enrollment:
Students in private schools in grades 1 to 8 (elementary and middle school): 3
Here:
2.2%
Illinois:
13.3%
Students in private schools in grades 9 to 12 (high school):
Here:
0.0%
Illinois:
9.9%
Students in private undergraduate colleges:
Here:
0.0%
Illinois:
27.4%
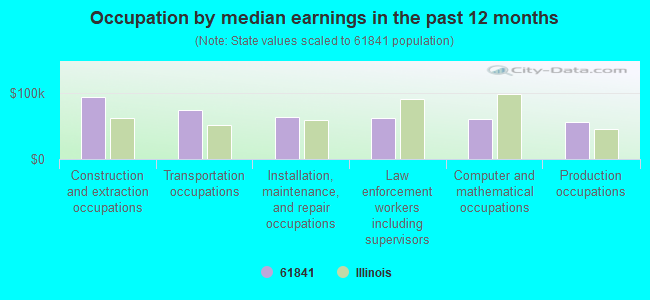
Occupation by median earnings in the past 12 months ($)
93,860Construction and extraction occupations
74,766Transportation occupations
63,330Installation, maintenance, and repair occupations
61,569Law enforcement workers including supervisors
59,969Computer and mathematical occupations
55,788Production occupations
Top industries in this zip code by the number of employees in 2005:
Wholesale Trade: Grain and Field Bean Merchant Wholesalers (50-99 employees: 1 establishment, 5-9 employees: 1 establishment)
Mining: Crushed and Broken Limestone Mining and Quarrying (20-49: 1)
Construction: Residential Remodelers (10-19: 1)
Finance and Insurance: Commercial Banking (5-9: 1)
Construction: All Other Specialty Trade Contractors (5-9: 1)
Finance and Insurance: Insurance Agencies and Brokerages (1-4: 2)
Fatal accident statistics in 2013:
Fatal accident count: 1
Vehicles involved in fatal accidents: 1
Fatal accidents caused by drunken drivers: 0
Fatalities: 1
Persons involved in fatal accidents: 2
Pedestrians involved in fatal accidents: 0
Home Mortgage Disclosure Act Aggregated Statistics For Year 2009 (Based on 4 partial tracts)
A) FHA, FSA/RHS & VA Home Purchase Loans
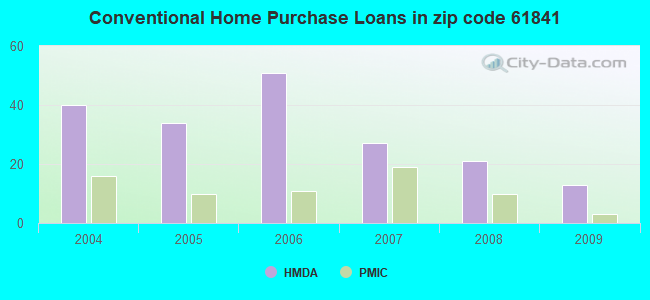
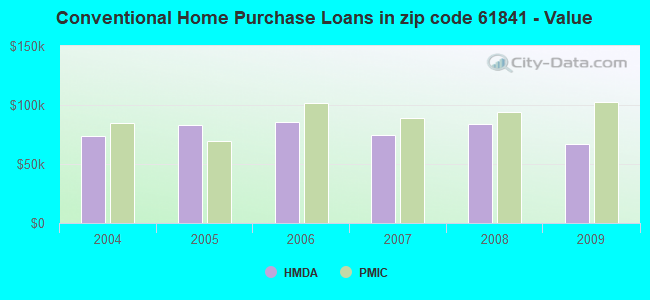
B) Conventional Home Purchase Loans
C) Refinancings
D) Home Improvement Loans
F) Non-occupant Loans on < 5 Family Dwellings (A B C & D)
G) Loans On Manufactured Home Dwelling (A B C & D)
Number
Average Value
Number
Average Value
Number
Average Value
Number
Average Value
Number
Average Value
Number
Average Value
LOANS ORIGINATED
7
$103,516
13
$67,133
61
$115,006
8
$38,210
5
$30,952
3
$46,537
APPLICATIONS APPROVED, NOT ACCEPTED
0
$0
1
$116,840
6
$133,280
1
$89,920
0
$0
0
$0
APPLICATIONS DENIED
1
$135,020
4
$60,452
19
$91,498
1
$81,620
1
$44,990
2
$56,955
APPLICATIONS WITHDRAWN
2
$58,280
1
$131,740
11
$101,135
1
$23,680
0
$0
1
$54,460
FILES CLOSED FOR INCOMPLETENESS
0
$0
1
$20,720
5
$89,932
1
$64,530
0
$0
0
$0
Aggregated Statistics For Year 2008 (Based on 4 partial tracts)
A) FHA, FSA/RHS & VA Home Purchase Loans
B) Conventional Home Purchase Loans
C) Refinancings
D) Home Improvement Loans
F) Non-occupant Loans on < 5 Family Dwellings (A B C & D)
G) Loans On Manufactured Home Dwelling (A B C & D)
Number
Average Value
Number
Average Value
Number
Average Value
Number
Average Value
Number
Average Value
Number
Average Value
LOANS ORIGINATED
5
$113,066
21
$84,300
45
$82,028
9
$30,877
10
$63,465
2
$114,255
APPLICATIONS APPROVED, NOT ACCEPTED
1
$24,270
1
$114,520
7
$101,924
1
$31,970
0
$0
0
$0
APPLICATIONS DENIED
1
$74,630
4
$87,308
16
$108,820
13
$48,135
1
$80,930
1
$20,720
APPLICATIONS WITHDRAWN
0
$0
1
$91,760
7
$108,424
2
$95,610
0
$0
0
$0
FILES CLOSED FOR INCOMPLETENESS
0
$0
2
$91,465
2
$131,805
1
$71,630
0
$0
0
$0
Aggregated Statistics For Year 2007 (Based on 4 partial tracts)
A) FHA, FSA/RHS & VA Home Purchase Loans
B) Conventional Home Purchase Loans
C) Refinancings
D) Home Improvement Loans
F) Non-occupant Loans on < 5 Family Dwellings (A B C & D)
G) Loans On Manufactured Home Dwelling (A B C & D)
Number
Average Value
Number
Average Value
Number
Average Value
Number
Average Value
Number
Average Value
Number
Average Value
LOANS ORIGINATED
5
$88,312
27
$74,664
45
$78,536
15
$31,877
7
$45,881
3
$42,587
APPLICATIONS APPROVED, NOT ACCEPTED
0
$0
5
$66,998
6
$82,603
1
$26,050
1
$9,470
0
$0
APPLICATIONS DENIED
1
$96,490
3
$66,557
33
$122,795
13
$50,177
0
$0
2
$106,760
APPLICATIONS WITHDRAWN
0
$0
3
$98,483
13
$147,719
0
$0
0
$0
0
$0
FILES CLOSED FOR INCOMPLETENESS
0
$0
1
$95,760
4
$195,195
0
$0
0
$0
0
$0
Aggregated Statistics For Year 2006 (Based on 4 partial tracts)
A) FHA, FSA/RHS & VA Home Purchase Loans
B) Conventional Home Purchase Loans
C) Refinancings
D) Home Improvement Loans
F) Non-occupant Loans on < 5 Family Dwellings (A B C & D)
G) Loans On Manufactured Home Dwelling (A B C & D)
Number
Average Value
Number
Average Value
Number
Average Value
Number
Average Value
Number
Average Value
Number
Average Value
LOANS ORIGINATED
4
$86,342
51
$85,317
45
$79,483
17
$46,040
14
$68,420
3
$57,023
APPLICATIONS APPROVED, NOT ACCEPTED
0
$0
3
$54,670
4
$85,548
0
$0
0
$0
0
$0
APPLICATIONS DENIED
0
$0
8
$64,274
30
$105,383
9
$61,604
1
$101,750
1
$65,220
APPLICATIONS WITHDRAWN
1
$49,730
3
$57,967
20
$109,059
2
$78,680
2
$87,735
1
$69,260
FILES CLOSED FOR INCOMPLETENESS
0
$0
1
$49,910
5
$84,220
0
$0
0
$0
0
$0
Aggregated Statistics For Year 2005 (Based on 4 partial tracts)
A) FHA, FSA/RHS & VA Home Purchase Loans
B) Conventional Home Purchase Loans
C) Refinancings
D) Home Improvement Loans
F) Non-occupant Loans on < 5 Family Dwellings (A B C & D)
G) Loans On Manufactured Home Dwelling (A B C & D)
Number
Average Value
Number
Average Value
Number
Average Value
Number
Average Value
Number
Average Value
Number
Average Value
LOANS ORIGINATED
10
$102,444
34
$83,007
55
$89,508
13
$41,090
10
$56,708
2
$94,660
APPLICATIONS APPROVED, NOT ACCEPTED
1
$94,130
4
$93,615
6
$76,352
1
$38,740
1
$21,900
0
$0
APPLICATIONS DENIED
0
$0
7
$81,891
41
$106,097
6
$42,527
0
$0
2
$57,130
APPLICATIONS WITHDRAWN
0
$0
2
$194,605
11
$118,109
3
$99,170
0
$0
1
$59,200
FILES CLOSED FOR INCOMPLETENESS
0
$0
1
$133,530
5
$75,976
0
$0
0
$0
0
$0
Aggregated Statistics For Year 2004 (Based on 4 partial tracts)
A) FHA, FSA/RHS & VA Home Purchase Loans
B) Conventional Home Purchase Loans
C) Refinancings
D) Home Improvement Loans
E) Loans on Dwellings For 5+ Families
F) Non-occupant Loans on < 5 Family Dwellings (A B C & D)
G) Loans On Manufactured Home Dwelling (A B C & D)
Detailed PMIC statistics for the following Tracts:0107.02
, 0109.00
2002 - 2018 National Fire Incident Reporting System (NFIRS) incidents
Based on the data from the years 2002 - 2018 the average number of fires per year is 7. The highest number of reported fires - 16 took place in 2008, and the least - 2 in 2003. The data has an increasing trend.
When looking into fire subcategories, the most incidents belonged to: Outside Fires (41.7%), and Structure Fires (38.6%).
Fire incident types reported to NFIRS in Zip Code 61841

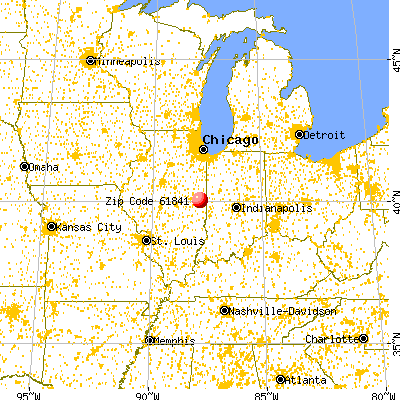


 Nearest zip codes: 61857, 61817, 61850, 61876, 61858, 61844.


 Based on the data from the years 2002 - 2018 the average number of fires per year is 7. The highest number of reported fires - 16 took place in 2008, and the least - 2 in 2003. The data has an increasing trend.
 When looking into fire subcategories, the most incidents belonged to: Outside Fires (41.7%), and Structure Fires (38.6%).