Estimated zip code population in 2022: 459 Zip code population in 2010: 671 Zip code population in 2000: 572
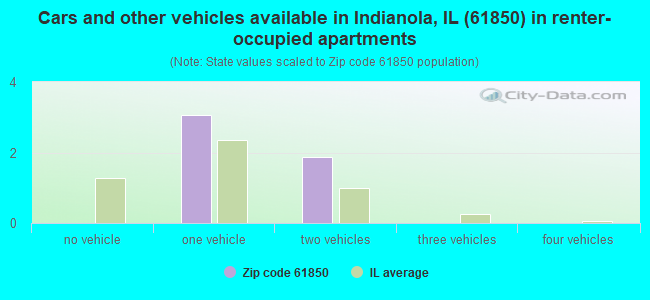
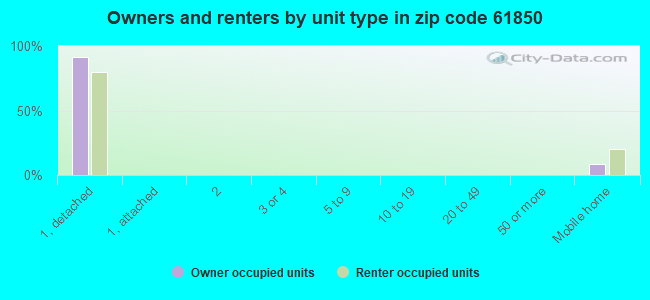
Houses and condos: 244 Renter-occupied apartments: 5
% of renters here:
3%
State:
33%
March 2022 cost of living index in zip code 61850: 83.3 (low, U.S. average is 100)
Land area: 34.4 sq. mi. Water area: 0.0 sq. mi.
Population density: 13 people per square mile
(very low).
OSM Map
General Map
Google Map
MSN Map
OSM Map
General Map
Google Map
MSN Map
OSM Map
General Map
Google Map
MSN Map
OSM Map
General Map
Google Map
MSN Map
Please wait while loading the map...
Real estate property taxes paid for housing units in 2022:
This zip code:
1.8% ($1,205)
Illinois:
2.0% ($4,912)
Median real estate property taxes paid for housing units with mortgages in 2022: $1,104 (1.9%) Median real estate property taxes paid for housing units with no mortgage in 2022: $1,380 (1.8%)
Business Search- 14 Million verified businesses
Males: 227
(49.6%)
Females: 231
(50.4%)
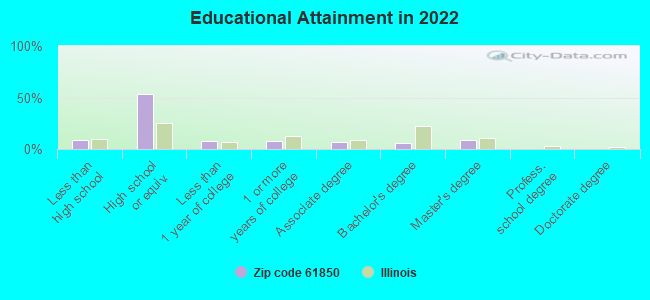
For population 25 years and over in 61850:
High school or higher: 88.9%
Bachelor's degree or higher: 14.9%
Graduate or professional degree: 9.0%
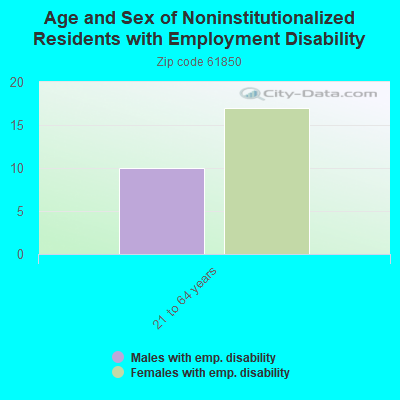
Unemployed: 15.9%
Mean travel time to work (commute): 32.7 minutes
For population 15 years and over in 61850:
Never married: 29.9%
Now married: 57.2%
Separated: 0.0%
Widowed: 5.2%
Divorced: 7.7%
Zip code 61850 compared to state average:
Median house value significantly below state average.
Unemployed percentage significantly above state average.
Black race population percentage significantly below state average.
Hispanic race population percentage significantly below state average.
Foreign-born population percentage significantly below state average.
Renting percentage significantly below state average.
Length of stay since moving in significantly above state average.
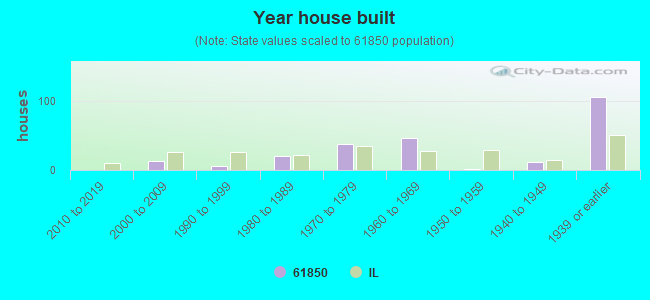
House age above state average.
Number of college students significantly below state average.
Percentage of population with a bachelor's degree or higher significantly below state average.
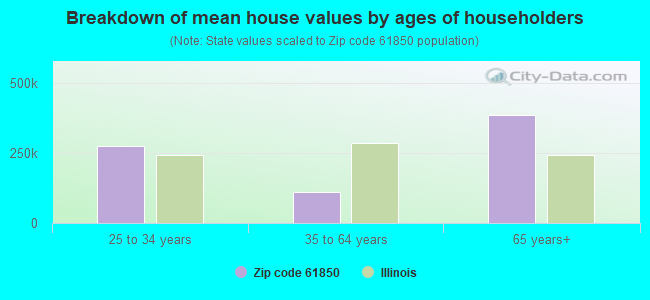
Estimated median house/condo value in 2022: $67,135
61850:
$67,135
Illinois:
$251,600
According to our research of Illinois and other state lists, there was 1 registered sex offender living in 61850 zip code as of May 29, 2024. The ratio of all residents to sex offenders in zip code 61850 is 517 to 1.
Median resident age:
This zip code:
42.4 years
Illinois median age:
39.1 years
Average household size:
This zip code:
2.6 people
Illinois:
2.4 people
Averages for the 2020 tax year for zip code 61850, filed in 2021:
Average Adjusted Gross Income (AGI) in 2020: $51,914 (Individual Income Tax Returns)
Here:
$51,914
State:
$82,626
Salary/wage: $41,289 (reported on 81.8% of returns)
Here:
$41,289
State:
$66,640
(% of AGI for various income ranges: 1068.3% for AGIs below $25k, 2890.0% for AGIs $25k-50k, 6405.0% for AGIs $50k-75k, 5225.0% for AGIs $75k-100k)
Taxable interest for individuals: $443 (reported on 31.8% of returns)
This zip code:
$443
Illinois:
$2,376
(% of AGI for various income ranges: 60.0% for AGIs $25k-50k, 17.5% for AGIs $75k-100k)
Earned income credit: $2,425 (reported on 18.2% of returns)
Here:
$2,425
State:
$2,311
(% of AGI for various income ranges: 161.7% for AGIs below $25k)
Percentage of individuals using paid preparers for their 2020 taxes: 100.0%
Here:
100%
State:
93%
(% for various income ranges: 100.0% for AGIs below $25k, 100.0% for AGIs $25k-50k, 100.0% for AGIs $50k-75k, 100.0% for AGIs $75k-100k, 100.0% for AGIs $100k-200k)
Averages for the 2012 tax year for zip code 61850, filed in 2013:
Average Adjusted Gross Income (AGI) in 2012: $47,492 (Individual Income Tax Returns)
Here:
$47,492
State:
$68,058
Salary/wage: $40,600 (reported on 80.0% of returns)
Here:
$40,600
State:
$55,396
(% of AGI for various income ranges: 63.4% for AGIs below $25k, 72.9% for AGIs $25k-50k, 80.0% for AGIs $50k-75k, 81.0% for AGIs $75k-100k, 51.3% for AGIs $100k-200k)
Taxable interest for individuals: $262 (reported on 32.0% of returns)
This zip code:
$262
Illinois:
$1,969
(% of AGI for various income ranges: 0.2% for AGIs below $25k, 0.4% for AGIs $25k-50k, 0.4% for AGIs $75k-100k)
Ordinary dividends: $1,233 (reported on 12.0% of returns)
Here:
$1,233
State:
$7,786
Profit/loss from business: +$4,100 (reported on 12.0% of returns)
Here:
+$4,100
State:
+$12,903
Total itemized deductions: $13,033 (15% of AGI, reported on 12.0% of returns)
Here:
$13,033
State:
$26,433
Here:
14.9% of AGI
State:
19.2% of AGI
Taxes paid: $5,233 (reported on 12.0% of returns)
61850:
$5,233
State:
$11,968
Earned income credit: $2,240 (reported on 20.0% of returns)
Here:
$2,240
State:
$2,349
(% of AGI for various income ranges: 9.2% for AGIs below $25k)
Percentage of individuals using paid preparers for their 2012 taxes: 72.0%
Here:
72%
State:
57%
(% for various income ranges: 70.0% for AGIs below $25k, 66.7% for AGIs $25k-50k, 75.0% for AGIs $50k-75k, 66.7% for AGIs $75k-100k, 100.0% for AGIs $100k-200k)
Averages for the 2004 tax year for zip code 61850, filed in 2005:
Average Adjusted Gross Income (AGI) in 2004: $39,104 (Individual Income Tax Returns)
Here:
$39,104
State:
$54,625
Salary/wage: $33,844 (reported on 84.4% of returns)
Here:
$33,844
State:
$46,811
(% of AGI for various income ranges: 79.7% for AGIs below $10k, 57.2% for AGIs $10k-25k, 71.6% for AGIs $25k-50k, 88.1% for AGIs $50k-75k, 67.1% for AGIs $75k-100k)
Taxable interest for individuals: $432 (reported on 44.4% of returns)
This zip code:
$432
Illinois:
$2,101
(% of AGI for various income ranges: 1.9% for AGIs $10k-25k, 0.4% for AGIs $25k-50k, 0.1% for AGIs $50k-75k, 0.4% for AGIs $75k-100k)
Taxable dividends: $655 (reported on 22.0% of returns)
Here:
$655
State:
$4,306
Net capital gain/loss: +$786 (reported on 11.2% of returns)
Here:
+$786
State:
+$17,321
Profit/loss from business: +$2,074 (reported on 10.8% of returns)
Here:
+$2,074
State:
+$11,771
Profit/loss from farming: +$2,667 (reported on 6.0% of returns)
Here:
+$2,667
State:
+$2,327
Total itemized deductions: $12,162 (20% of AGI, reported on 14.8% of returns)
Here:
$12,162
State:
$20,239
Here:
19.7% of AGI
State:
19.5% of AGI
Charity contributions deductions: $2,556 (4% of AGI, reported on 7.2% of returns)
Here:
$2,556
State:
$3,719
Here:
3.9% of AGI
State:
3.4% of AGI
Total tax: $4,389 (reported on 76.0% of returns)
61850:
$4,389
State:
$9,882
(% of AGI for various income ranges: 4.2% for AGIs $10k-25k, 6.5% for AGIs $25k-50k, 8.0% for AGIs $50k-75k, 12.5% for AGIs $75k-100k)
Earned income credit: $1,697 (reported on 13.2% of returns)
Here:
$1,697
State:
$1,788
Percentage of individuals using paid preparers for their 2004 taxes: 72.4%
Here:
72%
State:
61%
(% for various income ranges: 54.3% for AGIs below $10k, 74.3% for AGIs $10k-25k, 71.6% for AGIs $25k-50k, 75.6% for AGIs $50k-75k, 84.8% for AGIs $75k-100k)
Household received Food Stamps/SNAP in the past 12 months: 25 Household did not receive Food Stamps/SNAP in the past 12 months: 148
Women who had a birth in the past 12 months: 2 (0 now married, 2 unmarried) Women who did not have a birth in the past 12 months: 66 (20 now married, 46 unmarried)
Housing units in zip code 61850 with a mortgage: 73 Median monthly owner costs for units with a mortgage: $761 Median monthly owner costs for units without a mortgage: $476
Residents with income below the poverty level in 2022:
This zip code:
8.8%
Whole state:
11.9%
Residents with income below 50% of the poverty level in 2022:
This zip code:
4.9%
Whole state:
5.7%
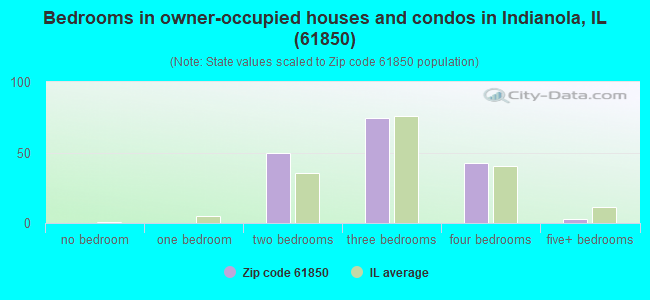
Median number of rooms in houses and condos:
Here:
6.9
State:
6.4
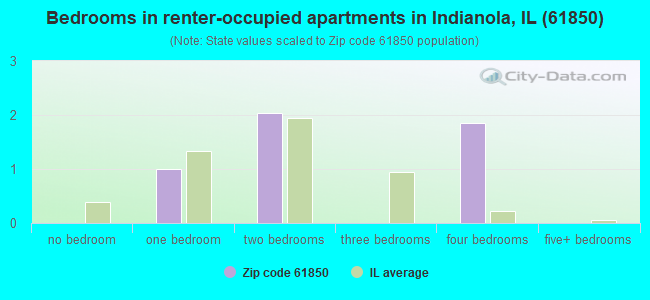
Median number of rooms in apartments:
Here:
5.9
State:
4.1
Notable locations in this zip code not listed on our city pages
Size of family households: 69 2-persons, 55 3-persons, 20 4-persons, 1 6-persons
Size of nonfamily households: 21 1-person, 4 3-persons
19 married couples with children.
101 single-parent households (69 men, 32 women).
98.5% of residents of 61850 zip code speak English at home.
1.0% of residents speak Spanish at home (100% not well).
0.3% of residents speak Asian or Pacific Island language at home (100% well).
Foreign born population: 2 (0.4%) (100.0% of them are naturalized citizens)
This zip code:
0.4%
Whole state:
14.4%
50%Hong Kong
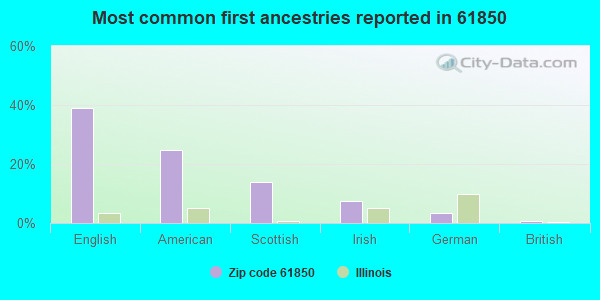
39%English
25%American
14%Scottish
7%Irish
3%German
1%British
Year of entry for the foreign-born population
02010 or later
02000 to 2009
01990 to 1999
1Before 1990
Facilities with environmental interests located in this zip code:
AQUA ILL-INDIANOLA WTP (CATLIN-INDIANOLA RD in INDIANOLA, IL)
STATE MASTER (Illinois EPA Project) - National Pollutant Discharge Elimination System Permit National Pollutant Discharge Elimination System NON-MAJOR (Tracking pollutant discharge elimination systems) - permit Business SIC classification: WATER SUPPLY Alternative names: AQUA ILLINOIS-INDIANOLA WTP
Housing units lacking complete plumbing facilities: 9.3% Housing units lacking complete kitchen facilities: 17.9%
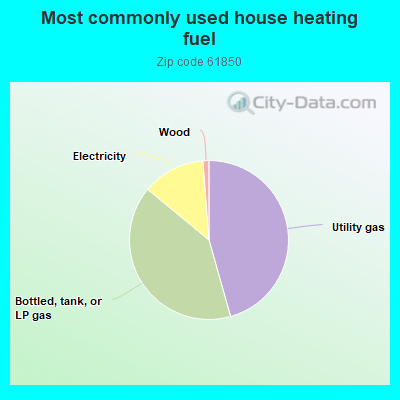
45.9%Utility gas
40.6%Bottled, tank, or LP gas
12.9%Electricity
1.2%Wood
Population in 1990: 715.
Place of birth for U.S.-born residents:
This state: 413
Midwest: 32
South: 9
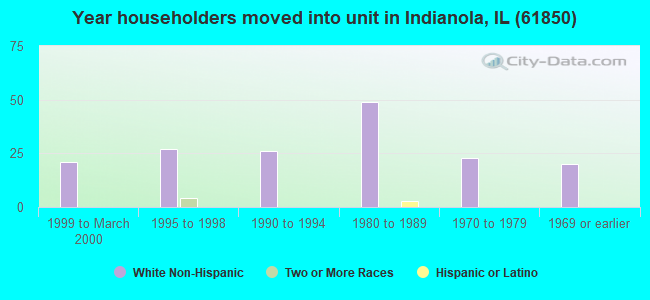
66% of the 61850 zip code residents lived in the same house 5 years ago. Out of people who lived in different houses, 90% lived in this county. Out of people who lived in different counties, 50% lived in Illinois.
98% of the 61850 zip code residents lived in the same house 1 year ago. Out of people who lived in different houses, 40% moved from different county within same state. Out of people who lived in different houses, 60% moved from different state.
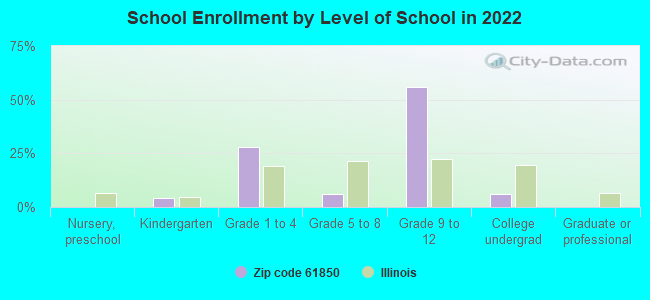
Private vs. public school enrollment:
Students in private schools in grades 1 to 8 (elementary and middle school): 2
Here:
8.7%
Illinois:
13.3%
Students in private schools in grades 9 to 12 (high school):
Here:
2.6%
Illinois:
9.9%
Students in private undergraduate colleges:
Here:
0.0%
Illinois:
27.4%
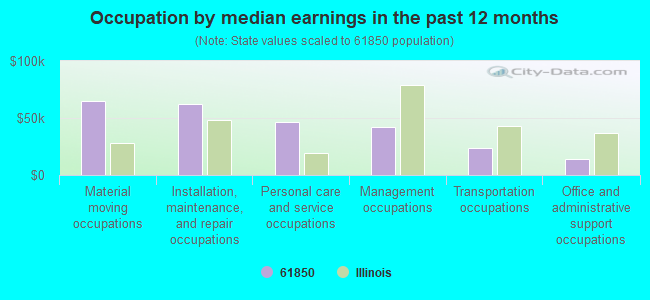
Occupation by median earnings in the past 12 months ($)
65,115Material moving occupations
62,453Installation, maintenance, and repair occupations
46,621Personal care and service occupations
41,886Management occupations
23,543Transportation occupations
14,215Office and administrative support occupations
Top industries in this zip code by the number of employees in 2005:
Wholesale Trade: Grain and Field Bean Merchant Wholesalers (1-4 employees: 1 establishment)
Other Services (except Public Administration): Religious Organizations (1-4: 1)
Other Services (except Public Administration): Cemeteries and Crematories (1-4: 1)
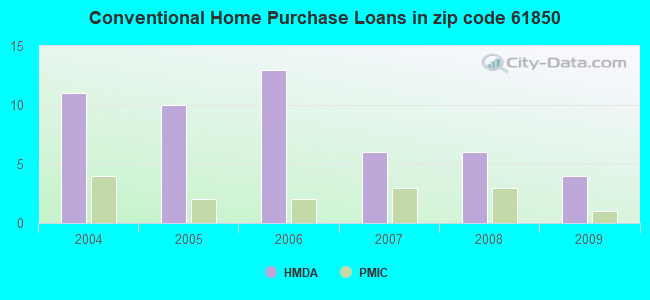
Home Mortgage Disclosure Act Aggregated Statistics For Year 2009 (Based on 2 partial tracts)
A) FHA, FSA/RHS & VA Home Purchase Loans
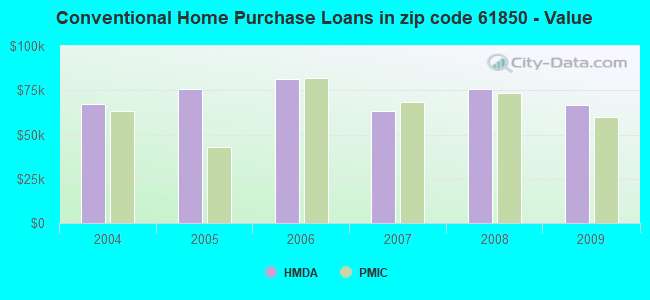
B) Conventional Home Purchase Loans
C) Refinancings
D) Home Improvement Loans
F) Non-occupant Loans on < 5 Family Dwellings (A B C & D)
G) Loans On Manufactured Home Dwelling (A B C & D)
Number
Average Value
Number
Average Value
Number
Average Value
Number
Average Value
Number
Average Value
Number
Average Value
LOANS ORIGINATED
2
$121,680
4
$66,598
17
$115,803
2
$53,995
2
$26,140
1
$65,350
APPLICATIONS APPROVED, NOT ACCEPTED
0
$0
0
$0
1
$194,190
0
$0
0
$0
0
$0
APPLICATIONS DENIED
0
$0
1
$46,990
7
$85,580
0
$0
1
$23,650
1
$30,810
APPLICATIONS WITHDRAWN
1
$45,440
0
$0
3
$87,240
0
$0
0
$0
0
$0
FILES CLOSED FOR INCOMPLETENESS
0
$0
0
$0
1
$116,080
0
$0
0
$0
0
$0
Aggregated Statistics For Year 2008 (Based on 2 partial tracts)
A) FHA, FSA/RHS & VA Home Purchase Loans
B) Conventional Home Purchase Loans
C) Refinancings
D) Home Improvement Loans
F) Non-occupant Loans on < 5 Family Dwellings (A B C & D)
G) Loans On Manufactured Home Dwelling (A B C & D)
Number
Average Value
Number
Average Value
Number
Average Value
Number
Average Value
Number
Average Value
Number
Average Value
LOANS ORIGINATED
1
$67,220
6
$75,570
12
$84,672
2
$39,835
2
$63,175
1
$120,120
APPLICATIONS APPROVED, NOT ACCEPTED
0
$0
0
$0
2
$104,095
0
$0
0
$0
0
$0
APPLICATIONS DENIED
0
$0
1
$42,010
6
$117,842
6
$45,332
0
$0
1
$10,890
APPLICATIONS WITHDRAWN
0
$0
0
$0
2
$120,900
1
$100,520
0
$0
0
$0
FILES CLOSED FOR INCOMPLETENESS
0
$0
1
$96,160
1
$106,430
1
$37,660
0
$0
0
$0
Aggregated Statistics For Year 2007 (Based on 2 partial tracts)
A) FHA, FSA/RHS & VA Home Purchase Loans
B) Conventional Home Purchase Loans
C) Refinancings
D) Home Improvement Loans
F) Non-occupant Loans on < 5 Family Dwellings (A B C & D)
G) Loans On Manufactured Home Dwelling (A B C & D)
Number
Average Value
Number
Average Value
Number
Average Value
Number
Average Value
Number
Average Value
Number
Average Value
LOANS ORIGINATED
1
$91,490
6
$63,018
14
$74,221
4
$30,342
1
$30,810
1
$40,460
APPLICATIONS APPROVED, NOT ACCEPTED
0
$0
1
$79,670
2
$87,135
1
$13,690
0
$0
0
$0
APPLICATIONS DENIED
0
$0
1
$66,910
11
$144,340
4
$52,282
0
$0
1
$95,230
APPLICATIONS WITHDRAWN
0
$0
1
$47,300
3
$173,340
0
$0
0
$0
0
$0
FILES CLOSED FOR INCOMPLETENESS
0
$0
0
$0
1
$275,720
0
$0
0
$0
0
$0
Aggregated Statistics For Year 2006 (Based on 2 partial tracts)
A) FHA, FSA/RHS & VA Home Purchase Loans
B) Conventional Home Purchase Loans
C) Refinancings
D) Home Improvement Loans
F) Non-occupant Loans on < 5 Family Dwellings (A B C & D)
G) Loans On Manufactured Home Dwelling (A B C & D)
Number
Average Value
Number
Average Value
Number
Average Value
Number
Average Value
Number
Average Value
Number
Average Value
LOANS ORIGINATED
1
$71,890
13
$81,319
12
$76,503
6
$41,078
3
$38,487
1
$78,110
APPLICATIONS APPROVED, NOT ACCEPTED
0
$0
1
$72,510
1
$85,580
0
$0
0
$0
0
$0
APPLICATIONS DENIED
0
$0
3
$60,477
12
$106,016
4
$63,172
0
$0
0
$0
APPLICATIONS WITHDRAWN
0
$0
1
$72,510
8
$111,565
0
$0
1
$38,590
1
$36,410
FILES CLOSED FOR INCOMPLETENESS
0
$0
0
$0
1
$63,480
0
$0
0
$0
0
$0
Aggregated Statistics For Year 2005 (Based on 2 partial tracts)
A) FHA, FSA/RHS & VA Home Purchase Loans
B) Conventional Home Purchase Loans
C) Refinancings
D) Home Improvement Loans
F) Non-occupant Loans on < 5 Family Dwellings (A B C & D)
G) Loans On Manufactured Home Dwelling (A B C & D)
Number
Average Value
Number
Average Value
Number
Average Value
Number
Average Value
Number
Average Value
Number
Average Value
LOANS ORIGINATED
2
$91,650
10
$75,777
14
$97,739
3
$47,200
2
$50,260
1
$98,340
APPLICATIONS APPROVED, NOT ACCEPTED
0
$0
1
$133,500
2
$50,570
0
$0
0
$0
0
$0
APPLICATIONS DENIED
0
$0
2
$87,445
14
$105,008
2
$54,305
0
$0
1
$60,060
APPLICATIONS WITHDRAWN
0
$0
1
$124,480
2
$121,680
1
$98,960
0
$0
0
$0
FILES CLOSED FOR INCOMPLETENESS
0
$0
0
$0
2
$56,950
0
$0
0
$0
0
$0
Aggregated Statistics For Year 2004 (Based on 2 partial tracts)
A) FHA, FSA/RHS & VA Home Purchase Loans
B) Conventional Home Purchase Loans
C) Refinancings
D) Home Improvement Loans
F) Non-occupant Loans on < 5 Family Dwellings (A B C & D)
G) Loans On Manufactured Home Dwelling (A B C & D)


 Nearest zip codes: 61876, 61817, 61841, 61870, 61846, 61883.