Estimated median house/condo value in 2022: $138,375
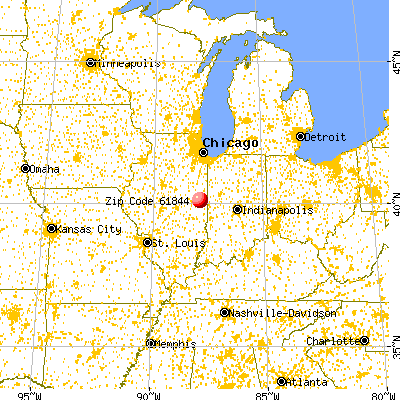
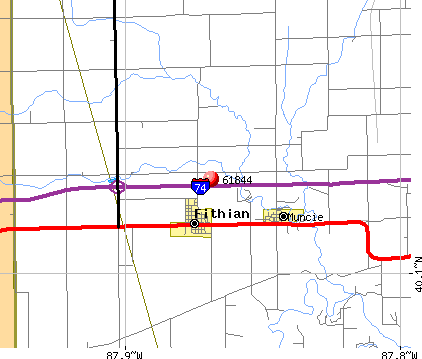
61844:
$138,375
Illinois:
$251,600
According to our research of Illinois and other state lists, there was 1 registered sex offender living in 61844 zip code as of June 08, 2024. The ratio of all residents to sex offenders in zip code 61844 is 855 to 1. The ratio of registered sex offenders to all residents in this zip code is near the state average.
Median resident age:
This zip code:
56.6 years
Illinois median age:
39.1 years
Average household size:
This zip code:
2.3 people
Illinois:
2.4 people
Averages for the 2020 tax year for zip code 61844, filed in 2021:
Average Adjusted Gross Income (AGI) in 2020: $68,288 (Individual Income Tax Returns)
Here:
$68,288
State:
$82,626
Salary/wage: $53,898 (reported on 81.6% of returns)
Here:
$53,898
State:
$66,640
(% of AGI for various income ranges: 1032.5% for AGIs below $25k, 3521.2% for AGIs $25k-50k, 5530.0% for AGIs $50k-75k, 9094.0% for AGIs $75k-100k, 18996.0% for AGIs $100k-200k)
Taxable interest for individuals: $929 (reported on 34.7% of returns)
This zip code:
$929
Illinois:
$2,376
(% of AGI for various income ranges: 8.8% for AGIs below $25k, 36.2% for AGIs $25k-50k, 37.1% for AGIs $50k-75k, 102.0% for AGIs $75k-100k, 90.0% for AGIs $100k-200k)
Ordinary dividends: $2,514 (reported on 14.3% of returns)
Here:
$2,514
State:
$9,061
(% of AGI for various income ranges: 94.3% for AGIs $50k-75k, 220.0% for AGIs $100k-200k)
Net capital gain/loss in AGI: +$2,243 (reported on 14.3% of returns)
Here:
+$2,243
State:
+$31,684
(% of AGI for various income ranges: 61.4% for AGIs $50k-75k, 228.0% for AGIs $100k-200k)
Profit/loss from business: +$11,814 (reported on 14.3% of returns)
Here:
+$11,814
State:
+$12,175
(% of AGI for various income ranges: 267.5% for AGIs $25k-50k, 1226.0% for AGIs $75k-100k)
Taxable individual retirement arrangement distribution: $12,400 (reported on 12.2% of returns)
61844:
$12,400
Illinois:
$21,613
(% of AGI for various income ranges: 320.0% for AGIs $25k-50k, 976.0% for AGIs $75k-100k)
Earned income credit: $1,967 (reported on 6.1% of returns)
Here:
$1,967
State:
$2,311
(% of AGI for various income ranges: 73.8% for AGIs below $25k)
Percentage of individuals using paid preparers for their 2020 taxes: 93.9%
Here:
94%
State:
93%
(% for various income ranges: 91.7% for AGIs below $25k, 100.0% for AGIs $25k-50k, 100.0% for AGIs $50k-75k, 87.5% for AGIs $75k-100k, 90.0% for AGIs $100k-200k)
Averages for the 2012 tax year for zip code 61844, filed in 2013:
Average Adjusted Gross Income (AGI) in 2012: $61,337 (Individual Income Tax Returns)
Here:
$61,337
State:
$68,058
Salary/wage: $44,048 (reported on 82.4% of returns)
Here:
$44,048
State:
$55,396
(% of AGI for various income ranges: 68.8% for AGIs below $25k, 82.2% for AGIs $25k-50k, 74.6% for AGIs $50k-75k, 67.0% for AGIs $75k-100k, 41.0% for AGIs $100k-200k)
Taxable interest for individuals: $1,115 (reported on 39.2% of returns)
This zip code:
$1,115
Illinois:
$1,969
(% of AGI for various income ranges: 0.7% for AGIs below $25k, 0.1% for AGIs $25k-50k, 0.5% for AGIs $50k-75k, 1.0% for AGIs $75k-100k, 0.8% for AGIs $100k-200k)
Ordinary dividends: $1,450 (reported on 15.7% of returns)
Here:
$1,450
State:
$7,786
Net capital gain/loss in AGI: +$3,233 (reported on 11.8% of returns)
Here:
+$3,233
State:
+$22,183
Profit/loss from business: +$11,338 (reported on 15.7% of returns)
Here:
+$11,338
State:
+$12,903
(% of AGI for various income ranges: 12.0% for AGIs below $25k, 4.3% for AGIs $50k-75k, 7.1% for AGIs $75k-100k)
Taxable individual retirement arrangement distribution: $12,900 (reported on 11.8% of returns)
61844:
$12,900
Illinois:
$17,929
Total itemized deductions: $17,492 (15% of AGI, reported on 25.5% of returns)
Here:
$17,492
State:
$26,433
Here:
15.0% of AGI
State:
19.2% of AGI
(% of AGI for various income ranges: 14.5% for AGIs $50k-75k, 5.8% for AGIs $75k-100k, 8.2% for AGIs $100k-200k)
Charity contributions: $3,612 (reported on 15.7% of returns)
Here:
$3,612
State:
$4,525
(% of AGI for various income ranges: 2.1% for AGIs $50k-75k, 1.3% for AGIs $100k-200k)
Taxes paid: $7,315 (reported on 25.5% of returns)
61844:
$7,315
State:
$11,968
(% of AGI for various income ranges: 4.2% for AGIs $50k-75k, 2.4% for AGIs $75k-100k, 4.2% for AGIs $100k-200k)
Earned income credit: $2,100 (reported on 7.8% of returns)
Here:
$2,100
State:
$2,349
(% of AGI for various income ranges: 5.1% for AGIs below $25k)
Percentage of individuals using paid preparers for their 2012 taxes: 56.9%
Here:
57%
State:
57%
(% for various income ranges: 46.7% for AGIs below $25k, 54.5% for AGIs $25k-50k, 55.6% for AGIs $50k-75k, 62.5% for AGIs $75k-100k, 75.0% for AGIs $100k-200k)
Averages for the 2004 tax year for zip code 61844, filed in 2005:
Average Adjusted Gross Income (AGI) in 2004: $42,607 (Individual Income Tax Returns)
Here:
$42,607
State:
$54,625
Salary/wage: $36,699 (reported on 84.3% of returns)
Here:
$36,699
State:
$46,811
(% of AGI for various income ranges: 89.9% for AGIs below $10k, 70.6% for AGIs $10k-25k, 78.6% for AGIs $25k-50k, 79.5% for AGIs $50k-75k, 70.0% for AGIs $75k-100k, 53.3% for AGIs over 100k)
Taxable interest for individuals: $1,082 (reported on 50.1% of returns)
This zip code:
$1,082
Illinois:
$2,101
(% of AGI for various income ranges: 1.8% for AGIs below $10k, 1.9% for AGIs $10k-25k, 1.0% for AGIs $25k-50k, 1.3% for AGIs $50k-75k, 1.4% for AGIs $75k-100k, 0.9% for AGIs over 100k)
Taxable dividends: $689 (reported on 17.7% of returns)
Here:
$689
State:
$4,306
(% of AGI for various income ranges: 2.5% for AGIs below $10k, 0.1% for AGIs $25k-50k, 0.4% for AGIs $50k-75k, 0.4% for AGIs $75k-100k)
Profit/loss from business: +$9,278 (reported on 19.1% of returns)
Here:
+$9,278
State:
+$11,771
(% of AGI for various income ranges: 0.3% for AGIs $10k-25k, 3.7% for AGIs $25k-50k, 6.6% for AGIs $50k-75k, 6.0% for AGIs $75k-100k)
Profit/loss from farming: +$19,100 (reported on 9.8% of returns)
Here:
+$19,100
State:
+$2,327
(% of AGI for various income ranges: 8.1% for AGIs below $10k, 2.0% for AGIs $25k-50k, 3.2% for AGIs $50k-75k, 18.0% for AGIs over 100k)
IRA payment deduction: $2,913 (reported on 4.5% of returns)
61844:
$2,913
Illinois:
$3,087
Total itemized deductions: $13,337 (21% of AGI, reported on 20.4% of returns)
Here:
$13,337
State:
$20,239
Here:
20.8% of AGI
State:
19.5% of AGI
(% of AGI for various income ranges: 8.3% for AGIs $25k-50k, 8.2% for AGIs $50k-75k, 5.7% for AGIs $75k-100k, 5.5% for AGIs over 100k)
Charity contributions deductions: $1,917 (3% of AGI, reported on 16.5% of returns)
Here:
$1,917
State:
$3,719
Here:
2.9% of AGI
State:
3.4% of AGI
Total tax: $5,542 (reported on 81.5% of returns)
61844:
$5,542
State:
$9,882
(% of AGI for various income ranges: 2.2% for AGIs below $10k, 4.6% for AGIs $10k-25k, 7.5% for AGIs $25k-50k, 8.9% for AGIs $50k-75k, 12.6% for AGIs $75k-100k, 19.5% for AGIs over 100k)
Earned income credit: $1,571 (reported on 8.3% of returns)
Here:
$1,571
State:
$1,788
Percentage of individuals using paid preparers for their 2004 taxes: 61.5%
Here:
61%
State:
61%
(% for various income ranges: 48.4% for AGIs below $10k, 64.4% for AGIs $10k-25k, 59.1% for AGIs $25k-50k, 63.9% for AGIs $50k-75k, 68.4% for AGIs $75k-100k, 84.0% for AGIs over 100k)
Household received Food Stamps/SNAP in the past 12 months: 52 Household did not receive Food Stamps/SNAP in the past 12 months: 298
Women who had a birth in the past 12 months: 3 (0 now married, 2 unmarried) Women who did not have a birth in the past 12 months: 122 (56 now married, 65 unmarried)
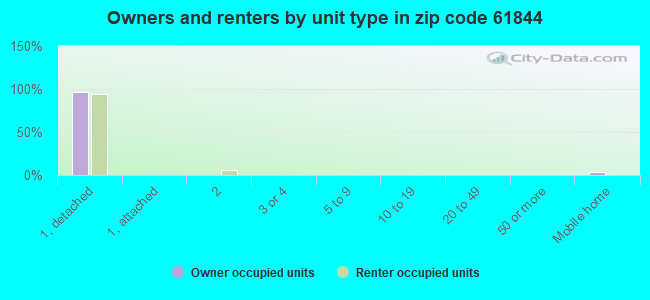
Housing units in zip code 61844 with a mortgage: 178 (4 second mortgage, 3 both second mortgage and home equity loan) Median monthly owner costs for units with a mortgage: $1,241 Median monthly owner costs for units without a mortgage: $513
Residents with income below the poverty level in 2022:
This zip code:
10.8%
Whole state:
11.9%
Residents with income below 50% of the poverty level in 2022:
This zip code:
5.6%
Whole state:
5.7%
Median number of rooms in houses and condos:
Here:
6.2
State:
6.4
Median number of rooms in apartments:
Here:
9.8
State:
4.1
Notable locations in this zip code not listed on our city pages
Churches in zip code 61844 include: Central Church (A), Fithian United Methodist Church (B), Muncie Baptist Church (C). Display/hide their locations on the map
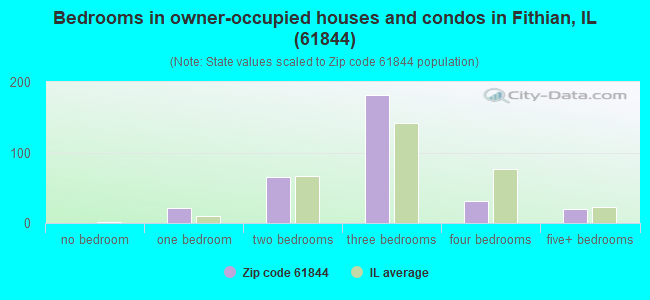
Size of family households: 142 2-persons, 50 3-persons, 25 4-persons, 15 5-persons
Size of nonfamily households: 91 1-person, 23 2-persons, 2 3-persons
73 married couples with children.
14 single-parent households (2 men, 12 women).
97.5% of residents of 61844 zip code speak English at home.
2.3% of residents speak Spanish at home (94% very well, 6% well).
0.3% of residents speak other Indo-European language at home (100% very well).
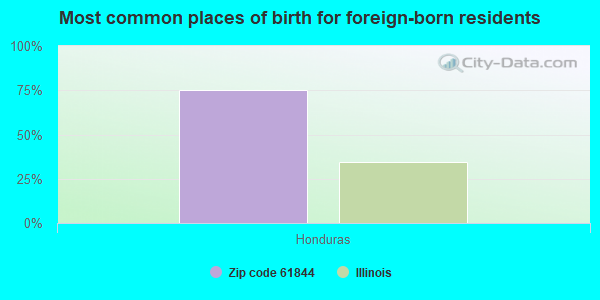
Foreign born population: 4 (0.5%) (100.0% of them are naturalized citizens)
This zip code:
0.5%
Whole state:
14.4%
75%Honduras
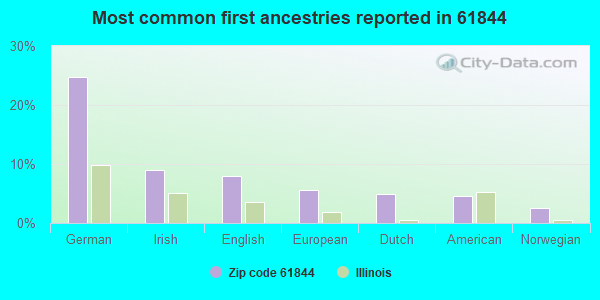
25%German
9%Irish
8%English
6%European
5%Dutch
5%American
2%Norwegian
Year of entry for the foreign-born population
02010 or later
02000 to 2009
31990 to 1999
0Before 1990
Facilities with environmental interests located in this zip code:
ALLERTON SUPPLY COMPANY (17054 STATE ROUTE 49 & 150 in FITHIAN, IL)
(Integrated Compliance Information System) - ICIS-05-2006-0129, ENFORCEMENT/COMPLIANCE ACTIVITY FORMAL ENFORCEMENT ACTION (Integrated Compliance Information System) - ICIS-05-2006-0129, ENFORCEMENT/COMPLIANCE ACTIVITY
OAKWOOD TOWNSHIP HIGH SCHOOL (5870 US 150 in FITHIAN, IL)
STATE MASTER (Illinois EPA Project) - National Pollutant Discharge Elimination System Permit National Pollutant Discharge Elimination System NON-MAJOR (Tracking pollutant discharge elimination systems) - permit National Pollutant Discharge Elimination System NON-MAJOR (Tracking pollutant discharge elimination systems) - permit Business SIC classification: ELEMENTARY AND SECONDARY SCHOOLS Alternative names: OAKWOOD COMM UNIT DISTRICT #76
IL DEPARTMENT OF TRANSPORTATION (1518 E 1800 W RD in FITHIAN, IL)
STATE MASTER (Illinois EPA Project) - AIR PROGRAM AIR MINOR (AIRS/AFS) CRITERIA AND HAZARDOUS AIR POLLUTANT INVENTORY (Inventory of air pollution sources) Business SIC classification: REGULATION AND ADMINISTRATION OF TRANSPORTATION PROGRAMS Alternative names: IL DEPT OF TRANS FITHIAN, IL DOT
MEADE OIL CO (MAIN ST in FITHIAN, IL)
STATE MASTER (Illinois EPA Project) - AIR PROGRAM AIR MINOR (AIRS/AFS) Business SIC classification: PETROLEUM BULK STATIONS AND TERMINALS
OAKWOOD COMM UNIT SCHOOL DISTRICT 76 (MAIN & DONALD in FITHIAN, IL)
STATE MASTER (Illinois EPA Project) - AIR PROGRAM AIR MINOR (AIRS/AFS) Business SIC classification: ELEMENTARY AND SECONDARY SCHOOLS
OAKWOOD HIGH SCHOOL (5870 US RTE 150 in FITHIAN, IL)
(Geographic Names Information System) (National Center for Education Statistics) - STATE ID-5409207600001 Organizations: OAKWOOD COMM UNIT DIST #76 (SCHOOL DISTRICT)
ILL BELL TEL CO FITHIAN C O (MAIN ST N OF WASHINGTON in FITHIAN, IL)
(Resource Conservation and Recovery Act (tracking hazardous waste)) Organizations: ILLINOIS BELL TELEPHONE CO (CONTACT/OWNER)
OTC, INC. (E. EDGE OF FITHIAN, TURN SOUTH in FITHIAN, IL)
National Pollutant Discharge Elimination System NON-MAJOR (Tracking pollutant discharge elimination systems) - permit
ILDOT FITHIAN MAINT STOR (RR 1 in FITHIAN, IL)
Conditionally Exempt Small Quantity Generators, less than 100 kg/month of hazardous waste (Resource Conservation and Recovery Act (tracking hazardous waste)) - notification Organizations: ILDOT STATE OF ILLINOIS (CONTACT/OWNER)
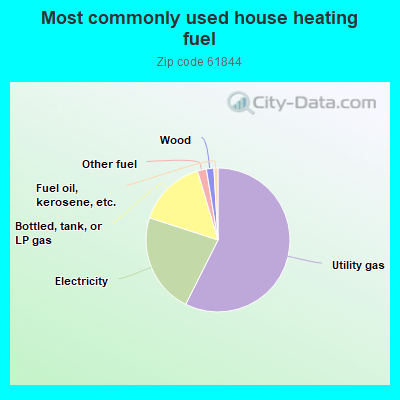
57.7%Utility gas
22.7%Electricity
15.5%Bottled, tank, or LP gas
2.0%Other fuel
1.7%Wood
0.9%Fuel oil, kerosene, etc.
Population in 1990: 673. Population change in the 1990s: +364 (+54.1%).
Place of birth for U.S.-born residents:
This state: 675
Northeast: 11
Midwest: 61
South: 40
West: 3
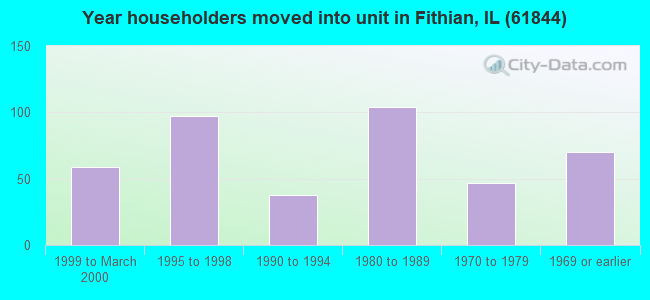
68% of the 61844 zip code residents lived in the same house 5 years ago. Out of people who lived in different houses, 66% lived in this county. Out of people who lived in different counties, 50% lived in Illinois.
94% of the 61844 zip code residents lived in the same house 1 year ago. Out of people who lived in different houses, 23% moved from this county. Out of people who lived in different houses, 74% moved from different county within same state. Out of people who lived in different houses, 5% moved from abroad.
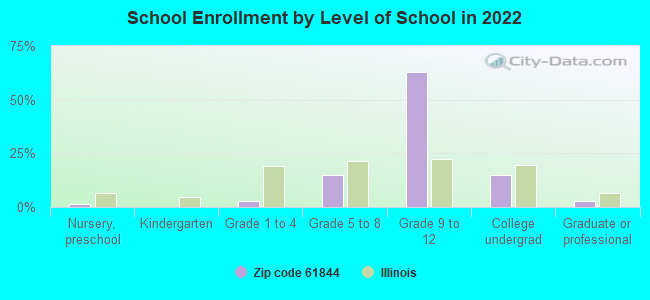
Private vs. public school enrollment:
Students in private schools in grades 1 to 8 (elementary and middle school): 2
Here:
7.9%
Illinois:
13.3%
Students in private schools in grades 9 to 12 (high school):
Here:
0.0%
Illinois:
9.9%
Students in private undergraduate colleges:
Here:
0.0%
Illinois:
27.4%
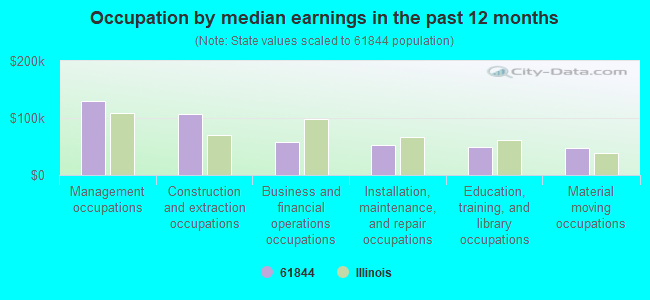
Occupation by median earnings in the past 12 months ($)
129,914Management occupations
106,224Construction and extraction occupations
57,562Business and financial operations occupations
53,313Installation, maintenance, and repair occupations
49,896Education, training, and library occupations
46,992Material moving occupations
Top industries in this zip code by the number of employees in 2005:
Wholesale Trade: Grain and Field Bean Merchant Wholesalers (50-99 employees: 1 establishment, 1-4 employees: 1 establishment)
Other Services (except Public Administration): Other Automotive Mechanical and Electrical Repair and Maintenance (1-4: 1)
Other Services (except Public Administration): Cemeteries and Crematories (1-4: 1)
Construction: Site Preparation Contractors (1-4: 1)
Accommodation and Food Services: Full-Service Restaurants (1-4: 1)
Construction: All Other Specialty Trade Contractors (1-4: 1)
Fatal accident statistics in 2014:
Fatal accident count: 2
Vehicles involved in fatal accidents: 2
Fatal accidents caused by drunken drivers: 0
Fatalities: 2
Persons involved in fatal accidents: 2
Pedestrians involved in fatal accidents: 1
Fatal accident statistics in 2010:
Fatal accident count: 1
Vehicles involved in fatal accidents: 1
Fatal accidents caused by drunken drivers: 0
Fatalities: 1
Persons involved in fatal accidents: 1
Pedestrians involved in fatal accidents: 0
Home Mortgage Disclosure Act Aggregated Statistics For Year 2009 (Based on 2 partial tracts)
A) FHA, FSA/RHS & VA Home Purchase Loans
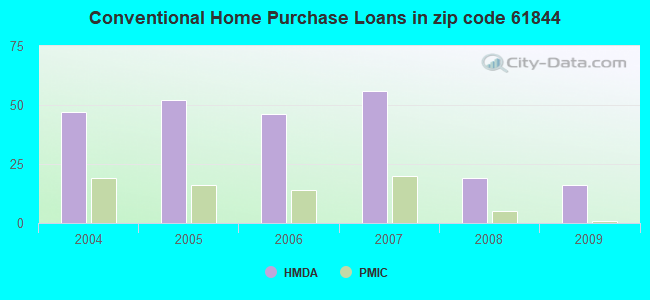
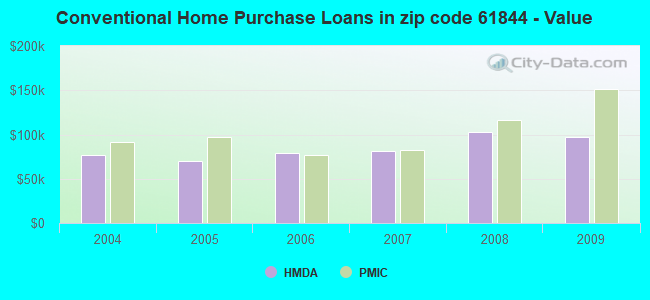
B) Conventional Home Purchase Loans
C) Refinancings
D) Home Improvement Loans
F) Non-occupant Loans on < 5 Family Dwellings (A B C & D)
G) Loans On Manufactured Home Dwelling (A B C & D)
Number
Average Value
Number
Average Value
Number
Average Value
Number
Average Value
Number
Average Value
Number
Average Value
LOANS ORIGINATED
10
$89,202
16
$96,734
87
$106,641
16
$51,808
6
$44,952
2
$49,490
APPLICATIONS APPROVED, NOT ACCEPTED
1
$75,470
0
$0
10
$86,604
1
$49,490
0
$0
1
$85,370
APPLICATIONS DENIED
2
$123,100
5
$139,308
25
$84,031
6
$44,952
0
$0
1
$124,960
APPLICATIONS WITHDRAWN
1
$80,420
6
$140,835
16
$101,451
0
$0
0
$0
4
$60,932
FILES CLOSED FOR INCOMPLETENESS
0
$0
0
$0
2
$110,110
0
$0
0
$0
0
$0
Aggregated Statistics For Year 2008 (Based on 2 partial tracts)
A) FHA, FSA/RHS & VA Home Purchase Loans
B) Conventional Home Purchase Loans
C) Refinancings
D) Home Improvement Loans
F) Non-occupant Loans on < 5 Family Dwellings (A B C & D)
G) Loans On Manufactured Home Dwelling (A B C & D)
Number
Average Value
Number
Average Value
Number
Average Value
Number
Average Value
Number
Average Value
Number
Average Value
LOANS ORIGINATED
16
$92,712
19
$102,623
46
$87,061
9
$50,450
2
$31,550
2
$145,990
APPLICATIONS APPROVED, NOT ACCEPTED
1
$115,060
2
$40,210
6
$89,285
5
$39,590
1
$24,740
0
$0
APPLICATIONS DENIED
2
$60,625
2
$40,830
43
$89,970
17
$76,342
0
$0
4
$63,715
APPLICATIONS WITHDRAWN
2
$145,990
2
$51,345
10
$127,679
4
$38,662
0
$0
2
$55,675
FILES CLOSED FOR INCOMPLETENESS
0
$0
1
$101,450
6
$66,808
2
$102,070
0
$0
0
$0
Aggregated Statistics For Year 2007 (Based on 2 partial tracts)
A) FHA, FSA/RHS & VA Home Purchase Loans
B) Conventional Home Purchase Loans
C) Refinancings
D) Home Improvement Loans
F) Non-occupant Loans on < 5 Family Dwellings (A B C & D)
G) Loans On Manufactured Home Dwelling (A B C & D)
Number
Average Value
Number
Average Value
Number
Average Value
Number
Average Value
Number
Average Value
Number
Average Value
LOANS ORIGINATED
9
$112,586
56
$81,854
64
$84,342
26
$39,400
19
$53,721
16
$45,235
APPLICATIONS APPROVED, NOT ACCEPTED
0
$0
2
$48,870
9
$108,873
2
$42,065
1
$43,300
2
$48,870
APPLICATIONS DENIED
2
$89,080
12
$80,933
49
$97,082
14
$37,028
4
$97,740
12
$46,601
APPLICATIONS WITHDRAWN
2
$93,410
10
$90,563
11
$103,363
1
$61,860
0
$0
1
$34,640
FILES CLOSED FOR INCOMPLETENESS
1
$157,120
2
$127,430
6
$117,533
0
$0
0
$0
0
$0
Aggregated Statistics For Year 2006 (Based on 2 partial tracts)
A) FHA, FSA/RHS & VA Home Purchase Loans
B) Conventional Home Purchase Loans
C) Refinancings
D) Home Improvement Loans
F) Non-occupant Loans on < 5 Family Dwellings (A B C & D)
G) Loans On Manufactured Home Dwelling (A B C & D)
Number
Average Value
Number
Average Value
Number
Average Value
Number
Average Value
Number
Average Value
Number
Average Value
LOANS ORIGINATED
10
$64,582
46
$79,181
57
$73,689
22
$51,569
15
$42,560
21
$31,519
APPLICATIONS APPROVED, NOT ACCEPTED
0
$0
4
$44,848
7
$74,056
5
$34,642
0
$0
1
$32,170
APPLICATIONS DENIED
1
$72,990
17
$39,226
33
$109,136
17
$71,976
2
$43,300
7
$33,227
APPLICATIONS WITHDRAWN
0
$0
4
$93,718
15
$127,431
0
$0
1
$186,820
2
$57,530
FILES CLOSED FOR INCOMPLETENESS
0
$0
1
$184,340
10
$144,134
1
$59,390
0
$0
0
$0
Aggregated Statistics For Year 2005 (Based on 2 partial tracts)
A) FHA, FSA/RHS & VA Home Purchase Loans
B) Conventional Home Purchase Loans
C) Refinancings
D) Home Improvement Loans
F) Non-occupant Loans on < 5 Family Dwellings (A B C & D)
G) Loans On Manufactured Home Dwelling (A B C & D)
Number
Average Value
Number
Average Value
Number
Average Value
Number
Average Value
Number
Average Value
Number
Average Value
LOANS ORIGINATED
16
$97,971
52
$69,545
68
$74,578
19
$66,548
12
$40,106
33
$52,187
APPLICATIONS APPROVED, NOT ACCEPTED
1
$92,790
4
$62,788
11
$79,294
0
$0
0
$0
1
$111,350
APPLICATIONS DENIED
0
$0
22
$48,701
63
$76,078
15
$40,827
9
$38,078
14
$30,488
APPLICATIONS WITHDRAWN
1
$63,100
4
$63,408
31
$102,368
1
$45,780
1
$66,810
0
$0
FILES CLOSED FOR INCOMPLETENESS
0
$0
1
$128,670
2
$117,535
0
$0
0
$0
0
$0
Aggregated Statistics For Year 2004 (Based on 2 partial tracts)
A) FHA, FSA/RHS & VA Home Purchase Loans
B) Conventional Home Purchase Loans
C) Refinancings
D) Home Improvement Loans
F) Non-occupant Loans on < 5 Family Dwellings (A B C & D)
G) Loans On Manufactured Home Dwelling (A B C & D)


 Nearest zip codes: 61857, 61859, 61812, 61858, 61871, 61831.