Estimated zip code population in 2022: 743 Zip code population in 2010: 720 Zip code population in 2000: 698
Houses and condos: 304 Renter-occupied apartments: 6
% of renters here:
2%
State:
33%
March 2022 cost of living index in zip code 61516: 84.4 (less than average, U.S. average is 100)
Land area: 31.6 sq. mi. Water area: 0.0 sq. mi.
Population density: 23 people per square mile
(very low).
OSM Map
General Map
Google Map
MSN Map
OSM Map
General Map
Google Map
MSN Map
OSM Map
General Map
Google Map
MSN Map
OSM Map
General Map
Google Map
MSN Map
Please wait while loading the map...
Real estate property taxes paid for housing units in 2022:
This zip code:
2.0% ($2,605)
Illinois:
2.0% ($4,912)
Median real estate property taxes paid for housing units with mortgages in 2022: $2,798 (2.0%) Median real estate property taxes paid for housing units with no mortgage in 2022: $1,988 (1.8%)
Business Search- 14 Million verified businesses
Males: 393
(52.9%)
Females: 349
(47.1%)
For population 25 years and over in 61516:
High school or higher: 90.8%
Bachelor's degree or higher: 16.3%
Graduate or professional degree: 1.8%
Unemployed: 2.3%
Mean travel time to work (commute): 32.3 minutes
For population 15 years and over in 61516:
Never married: 28.7%
Now married: 56.2%
Separated: 3.4%
Widowed: 6.8%
Divorced: 4.9%
Zip code 61516 compared to state average:
Median house value below state average.
Unemployed percentage below state average.
Black race population percentage significantly below state average.
Hispanic race population percentage significantly below state average.
Foreign-born population percentage significantly below state average.
Renting percentage significantly below state average.
House age above state average.
Number of college students below state average.
Percentage of population with a bachelor's degree or higher significantly below state average.
Estimated median house/condo value in 2022: $128,904
61516:
$128,904
Illinois:
$251,600
Median resident age:
This zip code:
36.2 years
Illinois median age:
39.1 years
Average household size:
This zip code:
2.6 people
Illinois:
2.4 people
Averages for the 2020 tax year for zip code 61516, filed in 2021:
Average Adjusted Gross Income (AGI) in 2020: $68,809 (Individual Income Tax Returns)
Here:
$68,809
State:
$82,626
Salary/wage: $50,287 (reported on 90.9% of returns)
Here:
$50,287
State:
$66,640
(% of AGI for various income ranges: 1183.3% for AGIs below $25k, 3370.0% for AGIs $25k-50k, 7372.5% for AGIs $50k-75k, 11026.7% for AGIs $75k-100k, 19200.0% for AGIs $100k-200k)
Taxable interest for individuals: $794 (reported on 54.5% of returns)
This zip code:
$794
Illinois:
$2,376
(% of AGI for various income ranges: 26.7% for AGIs below $25k, 78.6% for AGIs $25k-50k, 27.5% for AGIs $50k-75k, 53.3% for AGIs $75k-100k, 150.0% for AGIs $100k-200k)
Ordinary dividends: $3,029 (reported on 21.2% of returns)
Here:
$3,029
State:
$9,061
(% of AGI for various income ranges: 137.5% for AGIs $50k-75k, 523.3% for AGIs $100k-200k)
Net capital gain/loss in AGI: +$8,667 (reported on 18.2% of returns)
Here:
+$8,667
State:
+$31,684
(% of AGI for various income ranges: 160.0% for AGIs $50k-75k, 1520.0% for AGIs $100k-200k)
Profit/loss from business: +$2,250 (reported on 12.1% of returns)
Here:
+$2,250
State:
+$12,175
(% of AGI for various income ranges: 261.7% for AGIs below $25k)
Taxable individual retirement arrangement distribution: $6,550 (reported on 12.1% of returns)
61516:
$6,550
Illinois:
$21,613
(% of AGI for various income ranges: 873.3% for AGIs $75k-100k)
Earned income credit: $1,700 (reported on 6.1% of returns)
Here:
$1,700
State:
$2,311
(% of AGI for various income ranges: 56.7% for AGIs below $25k)
Percentage of individuals using paid preparers for their 2020 taxes: 100.0%
Here:
100%
State:
93%
(% for various income ranges: 100.0% for AGIs below $25k, 100.0% for AGIs $25k-50k, 100.0% for AGIs $50k-75k, 100.0% for AGIs $75k-100k, 100.0% for AGIs $100k-200k)
Averages for the 2012 tax year for zip code 61516, filed in 2013:
Average Adjusted Gross Income (AGI) in 2012: $61,184 (Individual Income Tax Returns)
Here:
$61,184
State:
$68,058
Salary/wage: $46,512 (reported on 81.2% of returns)
Here:
$46,512
State:
$55,396
(% of AGI for various income ranges: 72.9% for AGIs below $25k, 75.0% for AGIs $25k-50k, 65.4% for AGIs $50k-75k, 69.3% for AGIs $75k-100k, 50.6% for AGIs $100k-200k)
Taxable interest for individuals: $806 (reported on 56.2% of returns)
This zip code:
$806
Illinois:
$1,969
(% of AGI for various income ranges: 1.9% for AGIs below $25k, 1.0% for AGIs $25k-50k, 0.7% for AGIs $50k-75k, 1.1% for AGIs $75k-100k, 0.3% for AGIs $100k-200k)
Ordinary dividends: $1,214 (reported on 21.9% of returns)
Here:
$1,214
State:
$7,786
Net capital gain/loss in AGI: +$7,450 (reported on 12.5% of returns)
Here:
+$7,450
State:
+$22,183
Profit/loss from business: +$5,500 (reported on 12.5% of returns)
Here:
+$5,500
State:
+$12,903
Taxable individual retirement arrangement distribution: $6,400 (reported on 12.5% of returns)
61516:
$6,400
Illinois:
$17,929
Total itemized deductions: $15,578 (16% of AGI, reported on 28.1% of returns)
Here:
$15,578
State:
$26,433
Here:
16.1% of AGI
State:
19.2% of AGI
(% of AGI for various income ranges: 26.0% for AGIs below $25k, 11.8% for AGIs $50k-75k, 8.0% for AGIs $100k-200k)
Charity contributions: $3,317 (reported on 18.8% of returns)
Here:
$3,317
State:
$4,525
Taxes paid: $6,800 (reported on 28.1% of returns)
61516:
$6,800
State:
$11,968
(% of AGI for various income ranges: 7.6% for AGIs below $25k, 4.6% for AGIs $50k-75k, 4.3% for AGIs $100k-200k)
Earned income credit: $1,825 (reported on 12.5% of returns)
Here:
$1,825
State:
$2,349
(% of AGI for various income ranges: 3.8% for AGIs below $25k, 1.1% for AGIs $25k-50k)
Percentage of individuals using paid preparers for their 2012 taxes: 68.8%
Here:
69%
State:
57%
(% for various income ranges: 66.7% for AGIs below $25k, 62.5% for AGIs $25k-50k, 66.7% for AGIs $50k-75k, 75.0% for AGIs $75k-100k, 80.0% for AGIs $100k-200k)
Averages for the 2004 tax year for zip code 61516, filed in 2005:
Average Adjusted Gross Income (AGI) in 2004: $41,697 (Individual Income Tax Returns)
Here:
$41,697
State:
$54,625
Salary/wage: $37,328 (reported on 76.9% of returns)
Here:
$37,328
State:
$46,811
(% of AGI for various income ranges: 73.6% for AGIs below $10k, 43.2% for AGIs $10k-25k, 76.0% for AGIs $25k-50k, 72.7% for AGIs $50k-75k, 69.2% for AGIs $75k-100k, 63.6% for AGIs over 100k)
Taxable interest for individuals: $1,990 (reported on 61.0% of returns)
This zip code:
$1,990
Illinois:
$2,101
(% of AGI for various income ranges: 3.7% for AGIs below $10k, 10.9% for AGIs $10k-25k, 2.6% for AGIs $25k-50k, 3.2% for AGIs $50k-75k, 1.0% for AGIs $75k-100k, 0.6% for AGIs over 100k)
Taxable dividends: $607 (reported on 26.7% of returns)
Here:
$607
State:
$4,306
(% of AGI for various income ranges: 0.8% for AGIs $10k-25k, 0.4% for AGIs $25k-50k, 0.6% for AGIs $50k-75k, 0.2% for AGIs $75k-100k)
Profit/loss from business: +$2,581 (reported on 12.9% of returns)
Here:
+$2,581
State:
+$11,771
Profit/loss from farming: +$10,838 (reported on 11.1% of returns)
Here:
+$10,838
State:
+$2,327
IRA payment deduction: $1,700 (reported on 3.0% of returns)
61516:
$1,700
Illinois:
$3,087
Total itemized deductions: $12,805 (22% of AGI, reported on 26.1% of returns)
Here:
$12,805
State:
$20,239
Here:
22.2% of AGI
State:
19.5% of AGI
(% of AGI for various income ranges: 17.6% for AGIs $10k-25k, 6.7% for AGIs $25k-50k, 7.4% for AGIs $50k-75k, 14.1% for AGIs $75k-100k)
Charity contributions deductions: $2,643 (4% of AGI, reported on 21.0% of returns)
Here:
$2,643
State:
$3,719
Here:
4.3% of AGI
State:
3.4% of AGI
(% of AGI for various income ranges: 1.3% for AGIs $10k-25k, 0.6% for AGIs $25k-50k, 1.3% for AGIs $50k-75k, 3.7% for AGIs $75k-100k)
Total tax: $4,960 (reported on 83.2% of returns)
61516:
$4,960
State:
$9,882
(% of AGI for various income ranges: 3.7% for AGIs below $10k, 4.5% for AGIs $10k-25k, 7.6% for AGIs $25k-50k, 8.6% for AGIs $50k-75k, 10.8% for AGIs $75k-100k, 18.4% for AGIs over 100k)
Earned income credit: $1,739 (reported on 6.9% of returns)
Here:
$1,739
State:
$1,788
Percentage of individuals using paid preparers for their 2004 taxes: 67.6%
Here:
68%
State:
61%
(% for various income ranges: 43.4% for AGIs below $10k, 72.9% for AGIs $10k-25k, 68.7% for AGIs $25k-50k, 75.4% for AGIs $50k-75k, 76.7% for AGIs $75k-100k, 68.8% for AGIs over 100k)
Household received Food Stamps/SNAP in the past 12 months: 6 Household did not receive Food Stamps/SNAP in the past 12 months: 272
Women who had a birth in the past 12 months: 1 (1 now married, 0 unmarried) Women who did not have a birth in the past 12 months: 166 (94 now married, 71 unmarried)
Housing units in zip code 61516 with a mortgage: 190 (13 second mortgage, 12 both second mortgage and home equity loan) Median monthly owner costs for units with a mortgage: $1,331 Median monthly owner costs for units without a mortgage: $527
Residents with income below the poverty level in 2022:
This zip code:
2.5%
Whole state:
11.9%
Residents with income below 50% of the poverty level in 2022:
This zip code:
0.1%
Whole state:
5.7%
Median number of rooms in houses and condos:
Here:
6.8
State:
6.4
Median number of rooms in apartments:
Here:
6.8
State:
4.1
Notable locations in this zip code not listed on our city pages
Churches in zip code 61516 include: Saint Peter Lutheran Church (A), Benson Baptist Church (B), Saint Johns Catholic Church (C), Saint Paul Lutheran Church (D). Display/hide their locations on the map
Cemeteries: Trinity Cemetery (1), Clayton Township Cemetery (2), Saint John Cemetery (3), Saint Peter Lutheran Cemetery (4), Clayton Cemetery (5). Display/hide their locations on the map
Size of family households: 76 2-persons, 49 3-persons, 37 4-persons, 11 5-persons, 20 6-persons
Size of nonfamily households: 79 1-person, 5 2-persons, 3 4-persons
91 married couples with children.
86 single-parent households (86 women).
97.3% of residents of 61516 zip code speak English at home.
0.8% of residents speak Spanish at home (100% very well).
1.0% of residents speak other Indo-European language at home (86% very well, 14% not well).
Foreign born population: 6 (0.8%) (100.0% of them are naturalized citizens)
This zip code:
0.8%
Whole state:
14.4%
67%Hungary
33%Malaysia
46%German
12%European
10%American
8%English
5%Lebanese
4%Irish
2%Scottish
Year of entry for the foreign-born population
92010 or later
02000 to 2009
21990 to 1999
1Before 1990
Facilities with environmental interests located in this zip code:
ROANOKE FARMERS ASSN (401 FRONT STREET in BENSON, IL)
STATE MASTER (Illinois EPA Project) - SOLID WASTE PROGRAM, AIR PROGRAM STATE MASTER (Illinois EPA Project) - AIR PROGRAM AIR MINOR (AIRS/AFS) CRITERIA AND HAZARDOUS AIR POLLUTANT INVENTORY (Inventory of air pollution sources) Business SIC classification: FERTILIZERS, MIXING ONLY; GRAIN AND FIELD BEANS Alternative names: BENSON FARMERS COOPERATIVE GRAIN ASSOCIATION INC, ROANOKE FARMERS association
ROANOKE-BENSON JR HIGH SCHOOL (PO BOX 137 in BENSON, IL)
(National Center for Education Statistics) - STATE ID-4310206001002 Organizations: ROANOKE BENSON C U S DIST 60 (SCHOOL DISTRICT)
AT AND T LONG LINES BENSON I (RURAL RTE in BENSON, IL)
(Resource Conservation and Recovery Act (tracking hazardous waste))
KOEHLER TRUCKING, INC. (2 1/2 MI. N. OF ROUTE 116 AND in BENSON, IL)
National Pollutant Discharge Elimination System NON-MAJOR (Tracking pollutant discharge elimination systems) - permit
Housing units lacking complete plumbing facilities: 1.1% Housing units lacking complete kitchen facilities: 1.1%
58.1%Utility gas
31.8%Bottled, tank, or LP gas
8.7%Electricity
2.2%Other fuel
Population in 1990: 838.
Place of birth for U.S.-born residents:
This state: 682
Northeast: 4
Midwest: 26
South: 9
West: 5
66% of the 61516 zip code residents lived in the same house 5 years ago. Out of people who lived in different houses, 79% lived in this county. Out of people who lived in different counties, 50% lived in Illinois.
88% of the 61516 zip code residents lived in the same house 1 year ago. Out of people who lived in different houses, 104% moved from different county within same state. Out of people who lived in different houses, 2% moved from abroad.
Private vs. public school enrollment:
Students in private schools in grades 1 to 8 (elementary and middle school): 11
Here:
10.9%
Illinois:
13.3%
Students in private schools in grades 9 to 12 (high school):
Here:
0.0%
Illinois:
9.9%
Students in private undergraduate colleges:
Here:
0.0%
Illinois:
27.4%
Occupation by median earnings in the past 12 months ($)
80,304Healthcare support occupations
79,378Installation, maintenance, and repair occupations
68,813Management occupations
68,379Construction and extraction occupations
63,469Health diagnosing and treating practitioners and other technical occupations
61,496Business and financial operations occupations
Top industries in this zip code by the number of employees in 2005:
Other Services (except Public Administration): Commercial and Industrial Machinery and Equipment (except Automotive and Electronic) Repair and Maintenance (1-4: 1)
Construction: Site Preparation Contractors (1-4: 1)
Fatal accident statistics in 2012:
Fatal accident count: 1
Vehicles involved in fatal accidents: 1
Fatal accidents caused by drunken drivers: 1
Fatalities: 1
Persons involved in fatal accidents: 6
Pedestrians involved in fatal accidents: 0
Home Mortgage Disclosure Act Aggregated Statistics For Year 2009 (Based on 4 partial tracts)
A) FHA, FSA/RHS & VA Home Purchase Loans
B) Conventional Home Purchase Loans
C) Refinancings
D) Home Improvement Loans
F) Non-occupant Loans on < 5 Family Dwellings (A B C & D)
Number
Average Value
Number
Average Value
Number
Average Value
Number
Average Value
Number
Average Value
LOANS ORIGINATED
5
$76,328
13
$101,774
50
$107,197
7
$46,551
5
$46,182
APPLICATIONS APPROVED, NOT ACCEPTED
0
$0
0
$0
2
$128,955
0
$0
0
$0
APPLICATIONS DENIED
1
$84,440
1
$41,460
13
$103,588
2
$33,235
0
$0
APPLICATIONS WITHDRAWN
1
$124,870
0
$0
4
$132,138
1
$69,270
0
$0
FILES CLOSED FOR INCOMPLETENESS
0
$0
0
$0
1
$122,070
0
$0
0
$0
Aggregated Statistics For Year 2008 (Based on 4 partial tracts)
A) FHA, FSA/RHS & VA Home Purchase Loans
B) Conventional Home Purchase Loans
C) Refinancings
D) Home Improvement Loans
F) Non-occupant Loans on < 5 Family Dwellings (A B C & D)
Number
Average Value
Number
Average Value
Number
Average Value
Number
Average Value
Number
Average Value
LOANS ORIGINATED
8
$95,995
17
$73,153
37
$91,304
3
$28,160
8
$58,670
APPLICATIONS APPROVED, NOT ACCEPTED
0
$0
0
$0
2
$152,525
1
$40,340
0
$0
APPLICATIONS DENIED
2
$58,420
4
$52,135
12
$84,105
5
$65,934
0
$0
APPLICATIONS WITHDRAWN
0
$0
2
$71,510
6
$89,382
0
$0
0
$0
FILES CLOSED FOR INCOMPLETENESS
0
$0
0
$0
1
$58,580
0
$0
0
$0
Aggregated Statistics For Year 2007 (Based on 4 partial tracts)
A) FHA, FSA/RHS & VA Home Purchase Loans
B) Conventional Home Purchase Loans
C) Refinancings
D) Home Improvement Loans
F) Non-occupant Loans on < 5 Family Dwellings (A B C & D)
G) Loans On Manufactured Home Dwelling (A B C & D)
Number
Average Value
Number
Average Value
Number
Average Value
Number
Average Value
Number
Average Value
Number
Average Value
LOANS ORIGINATED
6
$85,837
26
$76,005
32
$88,479
7
$24,211
4
$58,190
1
$40,640
APPLICATIONS APPROVED, NOT ACCEPTED
0
$0
0
$0
5
$65,706
2
$34,345
0
$0
0
$0
APPLICATIONS DENIED
0
$0
2
$42,425
13
$79,980
6
$42,193
0
$0
1
$30,480
APPLICATIONS WITHDRAWN
0
$0
1
$69,610
7
$77,684
1
$49,080
0
$0
0
$0
FILES CLOSED FOR INCOMPLETENESS
0
$0
0
$0
2
$121,705
0
$0
0
$0
0
$0
Aggregated Statistics For Year 2006 (Based on 4 partial tracts)
A) FHA, FSA/RHS & VA Home Purchase Loans
B) Conventional Home Purchase Loans
C) Refinancings
D) Home Improvement Loans
F) Non-occupant Loans on < 5 Family Dwellings (A B C & D)
Number
Average Value
Number
Average Value
Number
Average Value
Number
Average Value
Number
Average Value
LOANS ORIGINATED
6
$74,690
36
$83,811
29
$87,057
12
$24,534
7
$67,761
APPLICATIONS APPROVED, NOT ACCEPTED
0
$0
1
$43,940
3
$73,803
2
$17,225
0
$0
APPLICATIONS DENIED
3
$70,760
5
$103,774
20
$88,352
8
$36,184
0
$0
APPLICATIONS WITHDRAWN
0
$0
2
$91,190
11
$81,845
1
$65,580
1
$48,490
FILES CLOSED FOR INCOMPLETENESS
0
$0
1
$121,210
1
$75,890
0
$0
0
$0
Aggregated Statistics For Year 2005 (Based on 4 partial tracts)
A) FHA, FSA/RHS & VA Home Purchase Loans
B) Conventional Home Purchase Loans
C) Refinancings
D) Home Improvement Loans
F) Non-occupant Loans on < 5 Family Dwellings (A B C & D)
G) Loans On Manufactured Home Dwelling (A B C & D)
Number
Average Value
Number
Average Value
Number
Average Value
Number
Average Value
Number
Average Value
Number
Average Value
LOANS ORIGINATED
3
$78,800
39
$69,513
40
$85,197
8
$40,051
8
$57,241
1
$23,550
APPLICATIONS APPROVED, NOT ACCEPTED
0
$0
1
$42,570
4
$73,722
1
$28,750
0
$0
0
$0
APPLICATIONS DENIED
1
$54,280
6
$53,725
32
$89,806
10
$33,554
1
$39,180
1
$36,020
APPLICATIONS WITHDRAWN
0
$0
3
$69,293
17
$99,737
3
$106,980
2
$69,950
0
$0
FILES CLOSED FOR INCOMPLETENESS
0
$0
1
$63,880
1
$119,140
0
$0
0
$0
0
$0
Aggregated Statistics For Year 2004 (Based on 4 partial tracts)
A) FHA, FSA/RHS & VA Home Purchase Loans
B) Conventional Home Purchase Loans
C) Refinancings
D) Home Improvement Loans
F) Non-occupant Loans on < 5 Family Dwellings (A B C & D)
G) Loans On Manufactured Home Dwelling (A B C & D)
Number
Average Value
Number
Average Value
Number
Average Value
Number
Average Value
Number
Average Value
Number
Average Value
LOANS ORIGINATED
3
$96,793
30
$74,721
45
$90,178
9
$38,803
11
$58,083
1
$152,860
APPLICATIONS APPROVED, NOT ACCEPTED
1
$90,340
1
$37,870
4
$81,088
0
$0
0
$0
0
$0
APPLICATIONS DENIED
0
$0
5
$74,644
29
$83,657
7
$18,679
2
$63,020
0
$0
APPLICATIONS WITHDRAWN
0
$0
1
$61,480
19
$85,232
1
$37,870
1
$75,740
0
$0
FILES CLOSED FOR INCOMPLETENESS
0
$0
0
$0
1
$110,830
0
$0
0
$0
0
$0
Aggregated Statistics For Year 2003 (Based on 4 partial tracts)
A) FHA, FSA/RHS & VA Home Purchase Loans
B) Conventional Home Purchase Loans
C) Refinancings
D) Home Improvement Loans
F) Non-occupant Loans on < 5 Family Dwellings (A B C & D)
Number
Average Value
Number
Average Value
Number
Average Value
Number
Average Value
Number
Average Value
LOANS ORIGINATED
6
$68,615
34
$63,231
126
$84,916
10
$39,245
10
$57,019
APPLICATIONS APPROVED, NOT ACCEPTED
0
$0
0
$0
7
$89,884
1
$10,280
1
$55,420
APPLICATIONS DENIED
0
$0
5
$86,914
30
$71,020
4
$12,798
4
$62,712
APPLICATIONS WITHDRAWN
1
$35,830
2
$49,845
22
$84,644
1
$9,350
1
$31,860
FILES CLOSED FOR INCOMPLETENESS
0
$0
0
$0
1
$107,370
1
$12,460
0
$0
Aggregated Statistics For Year 2002 (Based on 4 partial tracts)
A) FHA, FSA/RHS & VA Home Purchase Loans
B) Conventional Home Purchase Loans
C) Refinancings
D) Home Improvement Loans
F) Non-occupant Loans on < 5 Family Dwellings (A B C & D)
Number
Average Value
Number
Average Value
Number
Average Value
Number
Average Value
Number
Average Value
LOANS ORIGINATED
4
$73,802
27
$68,179
120
$78,496
11
$25,461
7
$53,824
APPLICATIONS APPROVED, NOT ACCEPTED
1
$73,180
2
$28,460
4
$73,105
0
$0
1
$30,020
APPLICATIONS DENIED
0
$0
3
$67,193
25
$69,831
6
$17,155
2
$67,885
APPLICATIONS WITHDRAWN
0
$0
0
$0
14
$87,744
0
$0
1
$102,520
FILES CLOSED FOR INCOMPLETENESS
0
$0
0
$0
1
$81,500
0
$0
0
$0
Aggregated Statistics For Year 2001 (Based on 4 partial tracts)
A) FHA, FSA/RHS & VA Home Purchase Loans
B) Conventional Home Purchase Loans
C) Refinancings
D) Home Improvement Loans
F) Non-occupant Loans on < 5 Family Dwellings (A B C & D)
Number
Average Value
Number
Average Value
Number
Average Value
Number
Average Value
Number
Average Value
LOANS ORIGINATED
2
$74,440
20
$69,890
69
$79,933
14
$15,897
4
$42,540
APPLICATIONS APPROVED, NOT ACCEPTED
0
$0
1
$45,720
6
$59,900
1
$12,470
0
$0
APPLICATIONS DENIED
1
$70,420
3
$59,383
9
$52,177
7
$10,251
0
$0
APPLICATIONS WITHDRAWN
0
$0
1
$34,280
7
$60,319
2
$26,485
0
$0
FILES CLOSED FOR INCOMPLETENESS
0
$0
0
$0
2
$84,840
0
$0
0
$0
Aggregated Statistics For Year 2000 (Based on 4 partial tracts)
A) FHA, FSA/RHS & VA Home Purchase Loans
B) Conventional Home Purchase Loans
C) Refinancings
D) Home Improvement Loans
F) Non-occupant Loans on < 5 Family Dwellings (A B C & D)
Number
Average Value
Number
Average Value
Number
Average Value
Number
Average Value
Number
Average Value
LOANS ORIGINATED
4
$73,732
24
$70,912
21
$52,277
14
$13,949
4
$49,260
APPLICATIONS APPROVED, NOT ACCEPTED
0
$0
3
$62,083
4
$59,658
3
$18,740
2
$51,750
APPLICATIONS DENIED
1
$87,750
6
$51,222
9
$42,900
5
$9,858
0
$0
APPLICATIONS WITHDRAWN
0
$0
1
$47,970
7
$43,264
1
$60,500
0
$0
FILES CLOSED FOR INCOMPLETENESS
0
$0
1
$56,240
1
$54,050
0
$0
0
$0
Aggregated Statistics For Year 1999 (Based on 2 partial tracts)
A) FHA, FSA/RHS & VA Home Purchase Loans
B) Conventional Home Purchase Loans
C) Refinancings
D) Home Improvement Loans
F) Non-occupant Loans on < 5 Family Dwellings (A B C & D)

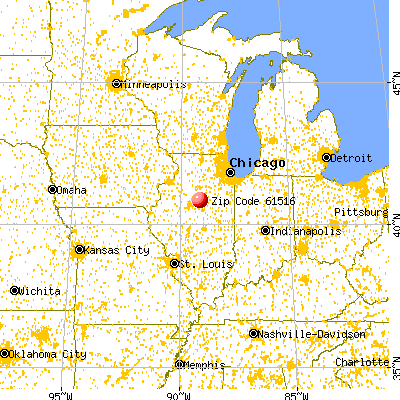


 Nearest zip codes: 61561, 61760, 61369, 61358, 61738, 61771.


