Estimated zip code population in 2022: 4,128 Zip code population in 2010: 4,212 Zip code population in 2000: 4,457
Houses and condos: 1,630 Renter-occupied apartments: 361
% of renters here:
24%
State:
33%
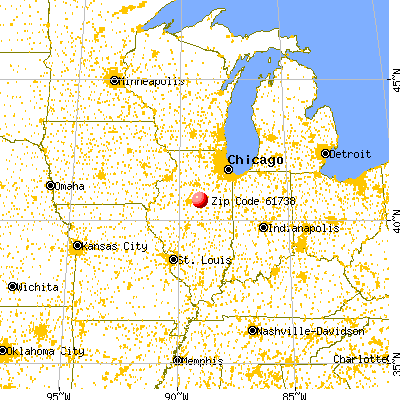
March 2022 cost of living index in zip code 61738: 82.8 (low, U.S. average is 100)
Land area: 79.9 sq. mi. Water area: 0.1 sq. mi.
Population density: 52 people per square mile
(very low).
OSM Map
General Map
Google Map
MSN Map
OSM Map
General Map
Google Map
MSN Map
OSM Map
General Map
Google Map
MSN Map
OSM Map
General Map
Google Map
MSN Map
Please wait while loading the map...
Real estate property taxes paid for housing units in 2022:
This zip code:
1.9% ($3,192)
Illinois:
2.0% ($4,912)
Median real estate property taxes paid for housing units with mortgages in 2022: $2,868 (1.8%) Median real estate property taxes paid for housing units with no mortgage in 2022: $4,078 (2.3%)
Business Search- 14 Million verified businesses
Males: 2,224
(53.9%)
Females: 1,904
(46.1%)
For population 25 years and over in 61738:
High school or higher: 92.4%
Bachelor's degree or higher: 24.2%
Graduate or professional degree: 5.6%
Unemployed: 2.8%
Mean travel time to work (commute): 25.5 minutes
For population 15 years and over in 61738:
Never married: 33.6%
Now married: 47.0%
Separated: 1.4%
Widowed: 6.9%
Divorced: 11.2%
Zip code 61738 compared to state average:
Median house value below state average.
Unemployed percentage below state average.
Black race population percentage significantly below state average.
Hispanic race population percentage significantly below state average.
Foreign-born population percentage significantly below state average.
Length of stay since moving in significantly above state average.
Number of college students below state average.
Percentage of population with a bachelor's degree or higher below state average.
Estimated median house/condo value in 2022: $166,576
61738:
$166,576
Illinois:
$251,600
According to our research of Illinois and other state lists, there were 7 registered sex offenders living in 61738 zip code as of May 28, 2024. The ratio of all residents to sex offenders in zip code 61738 is 661 to 1. The ratio of registered sex offenders to all residents in this zip code is near the state average.
Median resident age:
This zip code:
38.4 years
Illinois median age:
39.1 years
Average household size:
This zip code:
2.6 people
Illinois:
2.4 people
Averages for the 2020 tax year for zip code 61738, filed in 2021:
Average Adjusted Gross Income (AGI) in 2020: $75,258 (Individual Income Tax Returns)
Here:
$75,258
State:
$82,626
Salary/wage: $58,868 (reported on 82.3% of returns)
Here:
$58,868
State:
$66,640
(% of AGI for various income ranges: 1092.9% for AGIs below $25k, 3540.3% for AGIs $25k-50k, 6432.5% for AGIs $50k-75k, 9170.0% for AGIs $75k-100k, 15565.2% for AGIs $100k-200k)
Taxable interest for individuals: $1,136 (reported on 47.3% of returns)
This zip code:
$1,136
Illinois:
$2,376
(% of AGI for various income ranges: 23.1% for AGIs below $25k, 18.0% for AGIs $25k-50k, 111.0% for AGIs $50k-75k, 140.7% for AGIs $75k-100k, 126.5% for AGIs $100k-200k)
Ordinary dividends: $8,633 (reported on 22.7% of returns)
Here:
$8,633
State:
$9,061
(% of AGI for various income ranges: 33.1% for AGIs below $25k, 44.9% for AGIs $25k-50k, 98.0% for AGIs $50k-75k, 115.7% for AGIs $75k-100k, 241.7% for AGIs $100k-200k)
Net capital gain/loss in AGI: +$8,483 (reported on 20.7% of returns)
Here:
+$8,483
State:
+$31,684
(% of AGI for various income ranges: 15.2% for AGIs below $25k, 22.3% for AGIs $25k-50k, 83.0% for AGIs $50k-75k, 150.0% for AGIs $75k-100k, 458.7% for AGIs $100k-200k)
Profit/loss from business: +$14,750 (reported on 13.8% of returns)
Here:
+$14,750
State:
+$12,175
(% of AGI for various income ranges: 73.3% for AGIs below $25k, 101.4% for AGIs $25k-50k, 279.0% for AGIs $50k-75k, 276.4% for AGIs $75k-100k, 1096.5% for AGIs $100k-200k)
Taxable individual retirement arrangement distribution: $20,082 (reported on 10.8% of returns)
61738:
$20,082
Illinois:
$21,613
(% of AGI for various income ranges: 66.0% for AGIs below $25k, 64.9% for AGIs $25k-50k, 259.5% for AGIs $50k-75k, 366.4% for AGIs $75k-100k, 1253.0% for AGIs $100k-200k)
Total itemized deductions: $34,642 (reported on 5.9% of returns)
Here:
$34,642
State:
$34,948
(% of AGI for various income ranges: 200.3% for AGIs $25k-50k, 485.5% for AGIs $50k-75k, 496.5% for AGIs $100k-200k)
Charity contributions: $13,250 (reported on 4.9% of returns)
Here:
$13,250
State:
$13,122
(% of AGI for various income ranges: 102.5% for AGIs $50k-75k, 166.5% for AGIs $100k-200k)
Taxes paid: $8,092 (reported on 5.9% of returns)
61738:
$8,092
State:
$8,563
(% of AGI for various income ranges: 24.3% for AGIs below $25k, 107.5% for AGIs $50k-75k, 143.5% for AGIs $100k-200k)
Earned income credit: $2,243 (reported on 11.3% of returns)
Here:
$2,243
State:
$2,311
(% of AGI for various income ranges: 75.0% for AGIs below $25k, 57.4% for AGIs $25k-50k)
Percentage of individuals using paid preparers for their 2020 taxes: 95.6%
Here:
96%
State:
93%
(% for various income ranges: 94.9% for AGIs below $25k, 95.5% for AGIs $25k-50k, 96.8% for AGIs $50k-75k, 95.2% for AGIs $75k-100k, 97.4% for AGIs $100k-200k, 88.9% for AGIs over 200k)
Averages for the 2012 tax year for zip code 61738, filed in 2013:
Average Adjusted Gross Income (AGI) in 2012: $73,353 (Individual Income Tax Returns)
Here:
$73,353
State:
$68,058
Salary/wage: $48,222 (reported on 85.1% of returns)
Here:
$48,222
State:
$55,396
(% of AGI for various income ranges: 76.5% for AGIs below $25k, 79.3% for AGIs $25k-50k, 74.2% for AGIs $50k-75k, 74.1% for AGIs $75k-100k, 68.1% for AGIs $100k-200k, 18.0% for AGIs over 200k)
Taxable interest for individuals: $1,209 (reported on 45.5% of returns)
This zip code:
$1,209
Illinois:
$1,969
(% of AGI for various income ranges: 1.3% for AGIs below $25k, 1.0% for AGIs $25k-50k, 0.6% for AGIs $50k-75k, 0.9% for AGIs $75k-100k, 0.9% for AGIs $100k-200k, 0.5% for AGIs over 200k)
Ordinary dividends: $3,909 (reported on 21.8% of returns)
Here:
$3,909
State:
$7,786
(% of AGI for various income ranges: 1.3% for AGIs below $25k, 0.7% for AGIs $25k-50k, 0.7% for AGIs $50k-75k, 0.7% for AGIs $75k-100k, 1.2% for AGIs $100k-200k, 1.7% for AGIs over 200k)
Net capital gain/loss in AGI: +$9,771 (reported on 15.3% of returns)
Here:
+$9,771
State:
+$22,183
(% of AGI for various income ranges: 0.5% for AGIs $50k-75k, 1.0% for AGIs $75k-100k, 1.0% for AGIs $100k-200k, 5.2% for AGIs over 200k)
Profit/loss from business: +$17,289 (reported on 13.4% of returns)
Here:
+$17,289
State:
+$12,903
(% of AGI for various income ranges: 3.2% for AGIs below $25k, 2.3% for AGIs $25k-50k, 5.1% for AGIs $50k-75k, 2.2% for AGIs $75k-100k, 6.7% for AGIs $100k-200k)
Taxable individual retirement arrangement distribution: $10,157 (reported on 11.4% of returns)
61738:
$10,157
Illinois:
$17,929
(% of AGI for various income ranges: 3.3% for AGIs below $25k, 1.4% for AGIs $25k-50k, 1.5% for AGIs $50k-75k, 2.5% for AGIs $75k-100k, 2.6% for AGIs $100k-200k)
Self-employment retirement plans: $15,467 (reported on 1.5% of returns)
61738:
$15,467
Illinois:
$24,666
Total itemized deductions: $22,341 (16% of AGI, reported on 36.6% of returns)
Here:
$22,341
State:
$26,433
Here:
16.4% of AGI
State:
19.2% of AGI
(% of AGI for various income ranges: 10.9% for AGIs below $25k, 10.0% for AGIs $25k-50k, 10.7% for AGIs $50k-75k, 12.3% for AGIs $75k-100k, 13.6% for AGIs $100k-200k, 9.2% for AGIs over 200k)
Charity contributions: $4,712 (reported on 28.2% of returns)
Here:
$4,712
State:
$4,525
(% of AGI for various income ranges: 0.8% for AGIs below $25k, 0.7% for AGIs $25k-50k, 1.3% for AGIs $50k-75k, 1.9% for AGIs $75k-100k, 2.6% for AGIs $100k-200k, 1.9% for AGIs over 200k)
Taxes paid: $10,227 (reported on 36.6% of returns)
61738:
$10,227
State:
$11,968
(% of AGI for various income ranges: 2.5% for AGIs below $25k, 3.0% for AGIs $25k-50k, 4.0% for AGIs $50k-75k, 5.2% for AGIs $75k-100k, 6.3% for AGIs $100k-200k, 5.6% for AGIs over 200k)
Earned income credit: $2,188 (reported on 11.9% of returns)
Here:
$2,188
State:
$2,349
(% of AGI for various income ranges: 4.7% for AGIs below $25k, 1.0% for AGIs $25k-50k)
Percentage of individuals using paid preparers for their 2012 taxes: 63.9%
Here:
64%
State:
57%
(% for various income ranges: 61.8% for AGIs below $25k, 61.9% for AGIs $25k-50k, 64.5% for AGIs $50k-75k, 64.0% for AGIs $75k-100k, 66.7% for AGIs $100k-200k, 83.3% for AGIs over 200k)
Averages for the 2004 tax year for zip code 61738, filed in 2005:
Average Adjusted Gross Income (AGI) in 2004: $47,582 (Individual Income Tax Returns)
Here:
$47,582
State:
$54,625
Salary/wage: $38,362 (reported on 85.7% of returns)
Here:
$38,362
State:
$46,811
(% of AGI for various income ranges: 94.6% for AGIs below $10k, 70.4% for AGIs $10k-25k, 79.0% for AGIs $25k-50k, 77.3% for AGIs $50k-75k, 78.8% for AGIs $75k-100k, 51.1% for AGIs over 100k)
Taxable interest for individuals: $1,646 (reported on 54.3% of returns)
This zip code:
$1,646
Illinois:
$2,101
(% of AGI for various income ranges: 6.5% for AGIs below $10k, 4.6% for AGIs $10k-25k, 1.6% for AGIs $25k-50k, 1.8% for AGIs $50k-75k, 0.9% for AGIs $75k-100k, 1.7% for AGIs over 100k)
Taxable dividends: $1,797 (reported on 26.9% of returns)
Here:
$1,797
State:
$4,306
(% of AGI for various income ranges: 2.0% for AGIs below $10k, 1.2% for AGIs $10k-25k, 1.1% for AGIs $25k-50k, 1.1% for AGIs $50k-75k, 0.9% for AGIs $75k-100k, 0.9% for AGIs over 100k)
Net capital gain/loss: +$5,696 (reported on 19.0% of returns)
Here:
+$5,696
State:
+$17,321
(% of AGI for various income ranges: -1.2% for AGIs below $10k, 0.8% for AGIs $10k-25k, 0.9% for AGIs $25k-50k, 0.9% for AGIs $50k-75k, 1.4% for AGIs $75k-100k, 5.0% for AGIs over 100k)
Profit/loss from business: +$12,227 (reported on 15.6% of returns)
Here:
+$12,227
State:
+$11,771
(% of AGI for various income ranges: 4.7% for AGIs below $10k, 3.8% for AGIs $10k-25k, 3.1% for AGIs $25k-50k, 4.1% for AGIs $50k-75k, 0.6% for AGIs $75k-100k, 6.2% for AGIs over 100k)
Profit/loss from farming: +$2,580 (reported on 5.1% of returns)
Here:
+$2,580
State:
+$2,327
(% of AGI for various income ranges: -2.1% for AGIs $10k-25k, -1.3% for AGIs $25k-50k, 1.7% for AGIs $50k-75k, 1.2% for AGIs $75k-100k, 0.1% for AGIs over 100k)
IRA payment deduction: $3,100 (reported on 2.5% of returns)
61738:
$3,100
Illinois:
$3,087
Self-employed pension: $9,625 (reported on 0.8% of returns)
Here:
$9,625
Illinois:
$16,965
Total itemized deductions: $16,044 (19% of AGI, reported on 33.1% of returns)
Here:
$16,044
State:
$20,239
Here:
18.6% of AGI
State:
19.5% of AGI
(% of AGI for various income ranges: 24.7% for AGIs below $10k, 9.6% for AGIs $10k-25k, 11.7% for AGIs $25k-50k, 11.5% for AGIs $50k-75k, 12.1% for AGIs $75k-100k, 9.8% for AGIs over 100k)
Charity contributions deductions: $3,230 (3% of AGI, reported on 27.7% of returns)
Here:
$3,230
State:
$3,719
Here:
3.5% of AGI
State:
3.4% of AGI
(% of AGI for various income ranges: 0.9% for AGIs below $10k, 0.9% for AGIs $10k-25k, 1.2% for AGIs $25k-50k, 1.7% for AGIs $50k-75k, 2.3% for AGIs $75k-100k, 2.4% for AGIs over 100k)
Total tax: $7,376 (reported on 77.5% of returns)
61738:
$7,376
State:
$9,882
(% of AGI for various income ranges: 2.1% for AGIs below $10k, 4.3% for AGIs $10k-25k, 6.9% for AGIs $25k-50k, 9.0% for AGIs $50k-75k, 10.1% for AGIs $75k-100k, 20.3% for AGIs over 100k)
Earned income credit: $1,602 (reported on 10.2% of returns)
Here:
$1,602
State:
$1,788
Percentage of individuals using paid preparers for their 2004 taxes: 65.1%
Here:
65%
State:
61%
(% for various income ranges: 52.6% for AGIs below $10k, 69.2% for AGIs $10k-25k, 68.1% for AGIs $25k-50k, 69.0% for AGIs $50k-75k, 64.0% for AGIs $75k-100k, 71.0% for AGIs over 100k)
Household received Food Stamps/SNAP in the past 12 months: 100 Household did not receive Food Stamps/SNAP in the past 12 months: 1,400
Women who had a birth in the past 12 months: 74 (24 now married, 49 unmarried) Women who did not have a birth in the past 12 months: 783 (356 now married, 425 unmarried)
Housing units in zip code 61738 with a mortgage: 702 (76 second mortgage, 72 both second mortgage and home equity loan) Median monthly owner costs for units with a mortgage: $1,302 Median monthly owner costs for units without a mortgage: $629
Residents with income below the poverty level in 2022:
This zip code:
9.9%
Whole state:
11.9%
Residents with income below 50% of the poverty level in 2022:
This zip code:
1.5%
Whole state:
5.7%
Median number of rooms in houses and condos:
Here:
6.7
State:
6.4
Median number of rooms in apartments:
Here:
5.0
State:
4.1
Notable locations in this zip code not listed on our city pages
Notable locations in zip code 61738: El Paso Golf Club (A), Centennial Gymnasium (B), Colburn Farms (C), Delaney Farms (D), Longview Farms (E), El Paso City Hall (F), El Paso Public Library (G), El Paso Emergency Squad (H), El Paso Fire Department (I). Display/hide their locations on the map
Churches in zip code 61738 include: Church of the Nazarene (A), Community Bible Fellowship of El Paso (B), El Paso Christian Church (C), El Paso United Methodist Church (D), First Baptist Church (E), Harvest Chapel Assembly of God Church (F), Saint Andrews Episcopal Church (G), Saint Marys Catholic Church (H), Trinity Lutheran Church (I). Display/hide their locations on the map
In group quarters: 168 (-1 institutionalized population)
Size of family households: 501 2-persons, 232 3-persons, 121 4-persons, 60 5-persons, 61 6-persons, 43 7-or-more-persons
Size of nonfamily households: 440 1-person, 37 2-persons, 14 3-persons
611 married couples with children.
250 single-parent households (126 men, 124 women).
96.3% of residents of 61738 zip code speak English at home.
0.2% of residents speak Spanish at home (100% very well).
2.3% of residents speak other Indo-European language at home (60% very well, 40% well).
0.7% of residents speak Asian or Pacific Island language at home (100% very well).
Foreign born population: 89 (2.2%) (13.4% of them are naturalized citizens)
This zip code:
2.2%
Whole state:
14.4%
39%France
34%Germany
9%Japan
36%German
16%American
10%English
9%Irish
6%European
4%French
3%Dutch
Year of entry for the foreign-born population
922010 or later
92000 to 2009
01990 to 1999
2Before 1990
Major facilities with environmental interests located in this zip code:
AMERICAN BUILDINGS CO (HIGHWAY 24 EAST in EL PASO, IL)
STATE MASTER (Illinois EPA Project) - SOLID WASTE PROGRAM, AIR PROGRAM, HAZARDOUS WASTE PROGRAM AIR SYNTHETIC MINOR (AIRS/AFS) CRITERIA AND HAZARDOUS AIR POLLUTANT INVENTORY (Inventory of air pollution sources) National Pollutant Discharge Elimination System NON-MAJOR (Tracking pollutant discharge elimination systems) - permit National Pollutant Discharge Elimination System NON-MAJOR (Tracking pollutant discharge elimination systems) - permit TRI REPORTER (Tracking of toxic chemicals releasing facilities) Business SIC classification: PREFABRICATED METAL BUILDINGS AND COMPONENTS Business NAICS classification: PREFABRICATED METAL BUILDING AND COMPONENT MANUFACTURING. Organizations: AMERICAN BUILDING CO (CONTACT/OWNER)
, AMERICAN BUILDINGS COMPANY (CONTACT/OWNER)
Alternative names: AMERICAN BUILDINGS CO-EL PASO
JOHN KRUG FARM (R. R. 2 in EL PASO, IL)
STATE MASTER (Illinois EPA Project) - National Pollutant Discharge Elimination System Permit National Pollutant Discharge Elimination System NON-MAJOR (Tracking pollutant discharge elimination systems) - permit Business SIC classification: HOGS
KENT LUMBER & COAL (12 W FRONT in EL PASO, IL)
STATE MASTER (Illinois EPA Project) - SOLID WASTE PROGRAM, AIR PROGRAM AIR MINOR (AIRS/AFS) Business SIC classification: READY-MIXED CONCRETE
MORTON PRE FINISHING (2810 COUNTY RD 520N in EL PASO, IL)
STATE MASTER (Illinois EPA Project) - HAZARDOUS WASTE PROGRAM Small Quantity Generators, between 100 kg and 1000 kg of hazardous waste/month (Resource Conservation and Recovery Act (tracking hazardous waste)) Organizations: MORTON PREFINISHING (CONTACT/OPERATOR)
, TRACY HIBBENS (CONTACT/OWNER)
Alternative names: MORTON PREFINISHING, NORTON PREFINISHING
PAYNE OIL CO (RTES 24 & 51 in EL PASO, IL)
STATE MASTER (Illinois EPA Project) - AIR PROGRAM AIR MINOR (AIRS/AFS) Business SIC classification: PETROLEUM BULK STATIONS AND TERMINALS
PFISTER HYBRID CORN CO (27 W MAIN in EL PASO, IL)
STATE MASTER (Illinois EPA Project) - AIR PROGRAM AIR MINOR (AIRS/AFS) Business SIC classification: METALS SERVICE CENTERS AND OFFICES
CUSTOM CRAFTED DOOR INC (RR 1 in EL PASO, IL)
STATE MASTER (Illinois EPA Project) - HAZARDOUS WASTE PROGRAM Small Quantity Generators, between 100 kg and 1000 kg of hazardous waste/month (Resource Conservation and Recovery Act (tracking hazardous waste)) - notification Organizations: YOUNG JIMMY D (CONTACT/OWNER)
JEFFERSON PARK ELEM SCHOOL (250 W 3RD ST in EL PASO, IL)
(National Center for Education Statistics) - STATE ID-4310237502003 Organizations: EL PASO C U DISTRICT 375 (SCHOOL DISTRICT)
KAISER AGRIUCLTURAL CHEMICALS (ST RD 24 EAST in EL PASO, IL)
(Resource Conservation and Recovery Act (tracking hazardous waste))
MARATHON METALLIC BUILDING CO (EAST ON RTE 24 in EL PASO, IL)
(Resource Conservation and Recovery Act (tracking hazardous waste))
GRAINLAND COOPERATIVE (R R ROUTE 51 SOUTH in EL PASO, IL)
AIR MINOR (AIRS/AFS) CRITERIA AND HAZARDOUS AIR POLLUTANT INVENTORY (Inventory of air pollution sources) Business SIC classification: GRAIN AND FIELD BEANS Alternative names: SECOR ELEVATOR CO. EL PASO BRANCH
HELLER FORD BODY SHOP (612 1/2 W MAIN in EL PASO, IL)
Conditionally Exempt Small Quantity Generators, less than 100 kg/month of hazardous waste (Resource Conservation and Recovery Act (tracking hazardous waste)) TRANSPORTER (Resource Conservation and Recovery Act (tracking hazardous waste)) Organizations: HELLER FORD-DANIEL HELLER (CONTACT/OWNER)
RJR TRANSPORTATION (575 EAST MAIN STREET in EL PASO, IL)
National Pollutant Discharge Elimination System NON-MAJOR (Tracking pollutant discharge elimination systems) - permit Organizations: L & W TRANSPORTATION INC. (CONTACT/OWNER)
Alternative names: L & W TRANSPORTATION INC., RJR TRANSPORTATION-EL PASO
Housing units lacking complete plumbing facilities: 0.2% Housing units lacking complete kitchen facilities: 1.0%
79.8%Utility gas
11.4%Bottled, tank, or LP gas
7.6%Electricity
0.7%No fuel used
Population in 1990: 3,338. Population change in the 1990s: +1,119 (+33.5%).
Place of birth for U.S.-born residents:
This state: 3,582
Northeast: 14
Midwest: 239
South: 111
West: 72
63% of the 61738 zip code residents lived in the same house 5 years ago. Out of people who lived in different houses, 46% lived in this county. Out of people who lived in different counties, 50% lived in Illinois.
92% of the 61738 zip code residents lived in the same house 1 year ago. Out of people who lived in different houses, 54% moved from this county. Out of people who lived in different houses, 36% moved from different county within same state. Out of people who lived in different houses, 10% moved from different state.
Private vs. public school enrollment:
Students in private schools in grades 1 to 8 (elementary and middle school): 70
Here:
13.4%
Illinois:
13.3%
Students in private schools in grades 9 to 12 (high school): 6
Here:
2.4%
Illinois:
9.9%
Students in private undergraduate colleges: 5
Here:
5.8%
Illinois:
27.4%
Occupation by median earnings in the past 12 months ($)
110,991Architecture and engineering occupations
109,356Computer and mathematical occupations
102,742Business and financial operations occupations
70,797Health diagnosing and treating practitioners and other technical occupations
69,752Installation, maintenance, and repair occupations
62,082Management occupations
Top industries in this zip code by the number of employees in 2005:
2003 - 2018 National Fire Incident Reporting System (NFIRS) incidents
Based on the data from the years 2003 - 2018 the average number of fires per year is 19. The highest number of fires - 28 took place in 2007, and the least - 2 in 2003. The data has a rising trend.
When looking into fire subcategories, the most incidents belonged to: Other (46.1%), and Structure Fires (26.9%).
Fire incident types reported to NFIRS in Zip Code 61738


 Nearest zip codes: 61771, 61748, 61760, 61744, 61516, 61725.


 Based on the data from the years 2003 - 2018 the average number of fires per year is 19. The highest number of fires - 28 took place in 2007, and the least - 2 in 2003. The data has a rising trend.
 When looking into fire subcategories, the most incidents belonged to: Other (46.1%), and Structure Fires (26.9%).