Estimated zip code population in 2022: 2,465 Zip code population in 2010: 2,788 Zip code population in 2000: 2,863
Houses and condos: 1,005 Renter-occupied apartments: 188
% of renters here:
20%
State:
33%
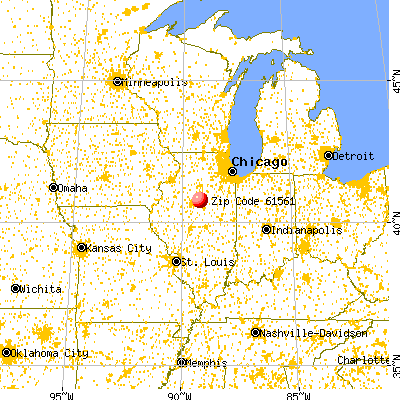
March 2022 cost of living index in zip code 61561: 85.7 (less than average, U.S. average is 100)
Land area: 55.1 sq. mi. Water area: 0.1 sq. mi.
Population density: 45 people per square mile
(very low).
OSM Map
General Map
Google Map
MSN Map
OSM Map
General Map
Google Map
MSN Map
OSM Map
General Map
Google Map
MSN Map
OSM Map
General Map
Google Map
MSN Map
Please wait while loading the map...
Real estate property taxes paid for housing units in 2022:
This zip code:
2.1% ($3,238)
Illinois:
2.0% ($4,912)
Median real estate property taxes paid for housing units with mortgages in 2022: $3,109 (2.1%) Median real estate property taxes paid for housing units with no mortgage in 2022: $3,463 (2.0%)
Business Search- 14 Million verified businesses
Males: 1,239
(50.3%)
Females: 1,226
(49.7%)
For population 25 years and over in 61561:
High school or higher: 94.3%
Bachelor's degree or higher: 23.9%
Graduate or professional degree: 6.0%
Unemployed: 1.5%
Mean travel time to work (commute): 25.0 minutes
For population 15 years and over in 61561:
Never married: 26.9%
Now married: 55.9%
Separated: 0.0%
Widowed: 8.7%
Divorced: 8.5%
Zip code 61561 compared to state average:
Median house value below state average.
Unemployed percentage significantly below state average.
Black race population percentage significantly below state average.
Hispanic race population percentage below state average.
Foreign-born population percentage significantly below state average.
Renting percentage below state average.
Length of stay since moving in significantly above state average.
Number of rooms per house above state average.
Percentage of population with a bachelor's degree or higher below state average.
Averages for the 2020 tax year for zip code 61561, filed in 2021:
Average Adjusted Gross Income (AGI) in 2020: $78,066 (Individual Income Tax Returns)
Here:
$78,066
State:
$82,626
Salary/wage: $51,951 (reported on 81.2% of returns)
Here:
$51,951
State:
$66,640
(% of AGI for various income ranges: 1318.0% for AGIs below $25k, 4025.6% for AGIs $25k-50k, 6450.0% for AGIs $50k-75k, 8957.8% for AGIs $75k-100k, 17283.6% for AGIs $100k-200k, 50535.0% for AGIs over 200k)
Taxable interest for individuals: $1,342 (reported on 54.1% of returns)
This zip code:
$1,342
Illinois:
$2,376
(% of AGI for various income ranges: 24.0% for AGIs below $25k, 26.7% for AGIs $25k-50k, 42.3% for AGIs $50k-75k, 68.9% for AGIs $75k-100k, 290.9% for AGIs $100k-200k, 2105.0% for AGIs over 200k)
Ordinary dividends: $4,056 (reported on 30.8% of returns)
Here:
$4,056
State:
$9,061
(% of AGI for various income ranges: 42.8% for AGIs below $25k, 71.7% for AGIs $25k-50k, 153.1% for AGIs $50k-75k, 236.7% for AGIs $75k-100k, 526.4% for AGIs $100k-200k, 2180.0% for AGIs over 200k)
Net capital gain/loss in AGI: +$7,935 (reported on 25.6% of returns)
Here:
+$7,935
State:
+$31,684
(% of AGI for various income ranges: 15.6% for AGIs below $25k, 65.6% for AGIs $25k-50k, 234.6% for AGIs $50k-75k, 265.6% for AGIs $75k-100k, 784.5% for AGIs $100k-200k, 5670.0% for AGIs over 200k)
Profit/loss from business: +$15,048 (reported on 17.3% of returns)
Here:
+$15,048
State:
+$12,175
(% of AGI for various income ranges: 87.2% for AGIs below $25k, 180.0% for AGIs $25k-50k, 425.4% for AGIs $50k-75k, 62.2% for AGIs $75k-100k, 616.4% for AGIs $100k-200k, 8160.0% for AGIs over 200k)
Taxable individual retirement arrangement distribution: $17,675 (reported on 12.0% of returns)
61561:
$17,675
Illinois:
$21,613
(% of AGI for various income ranges: 179.4% for AGIs $25k-50k, 312.3% for AGIs $50k-75k, 348.9% for AGIs $75k-100k, 1622.7% for AGIs $100k-200k)
Total itemized deductions: $38,190 (reported on 7.5% of returns)
Here:
$38,190
State:
$34,948
(% of AGI for various income ranges: 1033.1% for AGIs $50k-75k, 955.5% for AGIs $100k-200k, 7125.0% for AGIs over 200k)
Charity contributions: $16,956 (reported on 6.8% of returns)
Here:
$16,956
State:
$13,122
(% of AGI for various income ranges: 103.1% for AGIs $50k-75k, 399.1% for AGIs $100k-200k, 4765.0% for AGIs over 200k)
Taxes paid: $8,290 (reported on 7.5% of returns)
61561:
$8,290
State:
$8,563
(% of AGI for various income ranges: 194.6% for AGIs $50k-75k, 253.6% for AGIs $100k-200k, 1485.0% for AGIs over 200k)
Earned income credit: $2,038 (reported on 9.8% of returns)
Here:
$2,038
State:
$2,311
(% of AGI for various income ranges: 57.2% for AGIs below $25k, 67.8% for AGIs $25k-50k)
Percentage of individuals using paid preparers for their 2020 taxes: 91.7%
Here:
92%
State:
93%
(% for various income ranges: 89.7% for AGIs below $25k, 92.3% for AGIs $25k-50k, 95.2% for AGIs $50k-75k, 92.9% for AGIs $75k-100k, 92.0% for AGIs $100k-200k, 87.5% for AGIs over 200k)
Averages for the 2012 tax year for zip code 61561, filed in 2013:
Average Adjusted Gross Income (AGI) in 2012: $72,596 (Individual Income Tax Returns)
Here:
$72,596
State:
$68,058
Salary/wage: $45,057 (reported on 82.4% of returns)
Here:
$45,057
State:
$55,396
(% of AGI for various income ranges: 71.1% for AGIs below $25k, 70.1% for AGIs $25k-50k, 74.9% for AGIs $50k-75k, 68.0% for AGIs $75k-100k, 55.3% for AGIs $100k-200k, 23.6% for AGIs over 200k)
Taxable interest for individuals: $2,114 (reported on 52.2% of returns)
This zip code:
$2,114
Illinois:
$1,969
(% of AGI for various income ranges: 1.7% for AGIs below $25k, 1.2% for AGIs $25k-50k, 0.7% for AGIs $50k-75k, 0.8% for AGIs $75k-100k, 0.8% for AGIs $100k-200k, 2.7% for AGIs over 200k)
Ordinary dividends: $6,544 (reported on 33.1% of returns)
Here:
$6,544
State:
$7,786
(% of AGI for various income ranges: 2.5% for AGIs below $25k, 2.6% for AGIs $25k-50k, 0.8% for AGIs $50k-75k, 1.6% for AGIs $75k-100k, 1.7% for AGIs $100k-200k, 5.5% for AGIs over 200k)
Net capital gain/loss in AGI: +$6,934 (reported on 25.7% of returns)
Here:
+$6,934
State:
+$22,183
(% of AGI for various income ranges: 0.3% for AGIs below $25k, 0.3% for AGIs $25k-50k, 0.2% for AGIs $50k-75k, 0.9% for AGIs $75k-100k, 4.6% for AGIs $100k-200k, 3.1% for AGIs over 200k)
Profit/loss from business: +$13,405 (reported on 15.4% of returns)
Here:
+$13,405
State:
+$12,903
(% of AGI for various income ranges: 2.8% for AGIs below $25k, 3.9% for AGIs $25k-50k, 2.0% for AGIs $50k-75k, 1.8% for AGIs $75k-100k, 6.8% for AGIs $100k-200k)
Taxable individual retirement arrangement distribution: $9,805 (reported on 14.7% of returns)
61561:
$9,805
Illinois:
$17,929
(% of AGI for various income ranges: 3.9% for AGIs below $25k, 3.9% for AGIs $25k-50k, 2.3% for AGIs $75k-100k, 4.0% for AGIs $100k-200k)
Self-employment retirement plans: $21,200 (reported on 1.5% of returns)
61561:
$21,200
Illinois:
$24,666
Total itemized deductions: $22,382 (16% of AGI, reported on 32.4% of returns)
Here:
$22,382
State:
$26,433
Here:
15.6% of AGI
State:
19.2% of AGI
(% of AGI for various income ranges: 8.9% for AGIs below $25k, 9.9% for AGIs $25k-50k, 8.1% for AGIs $50k-75k, 10.8% for AGIs $75k-100k, 12.1% for AGIs $100k-200k, 8.8% for AGIs over 200k)
Charity contributions: $7,967 (reported on 26.5% of returns)
Here:
$7,967
State:
$4,525
(% of AGI for various income ranges: 0.7% for AGIs below $25k, 1.0% for AGIs $25k-50k, 1.8% for AGIs $50k-75k, 2.4% for AGIs $75k-100k, 4.1% for AGIs $100k-200k, 3.5% for AGIs over 200k)
Taxes paid: $8,945 (reported on 32.4% of returns)
61561:
$8,945
State:
$11,968
(% of AGI for various income ranges: 1.1% for AGIs below $25k, 2.4% for AGIs $25k-50k, 3.1% for AGIs $50k-75k, 4.1% for AGIs $75k-100k, 4.9% for AGIs $100k-200k, 4.5% for AGIs over 200k)
Earned income credit: $2,021 (reported on 10.3% of returns)
Here:
$2,021
State:
$2,349
(% of AGI for various income ranges: 3.6% for AGIs below $25k, 0.9% for AGIs $25k-50k)
Percentage of individuals using paid preparers for their 2012 taxes: 62.5%
Here:
62%
State:
57%
(% for various income ranges: 55.3% for AGIs below $25k, 62.1% for AGIs $25k-50k, 63.2% for AGIs $50k-75k, 64.3% for AGIs $75k-100k, 70.0% for AGIs $100k-200k, 85.7% for AGIs over 200k)
Averages for the 2004 tax year for zip code 61561, filed in 2005:
Average Adjusted Gross Income (AGI) in 2004: $49,112 (Individual Income Tax Returns)
Here:
$49,112
State:
$54,625
Salary/wage: $36,130 (reported on 82.0% of returns)
Here:
$36,130
State:
$46,811
(% of AGI for various income ranges: 129.3% for AGIs below $10k, 63.4% for AGIs $10k-25k, 72.9% for AGIs $25k-50k, 67.9% for AGIs $50k-75k, 68.2% for AGIs $75k-100k, 41.4% for AGIs over 100k)
Taxable interest for individuals: $2,887 (reported on 60.0% of returns)
This zip code:
$2,887
Illinois:
$2,101
(% of AGI for various income ranges: 11.3% for AGIs below $10k, 6.0% for AGIs $10k-25k, 2.5% for AGIs $25k-50k, 2.8% for AGIs $50k-75k, 1.3% for AGIs $75k-100k, 4.9% for AGIs over 100k)
Taxable dividends: $2,669 (reported on 38.1% of returns)
Here:
$2,669
State:
$4,306
(% of AGI for various income ranges: 10.5% for AGIs below $10k, 2.5% for AGIs $10k-25k, 2.1% for AGIs $25k-50k, 1.3% for AGIs $50k-75k, 0.8% for AGIs $75k-100k, 2.8% for AGIs over 100k)
Net capital gain/loss: +$4,768 (reported on 25.7% of returns)
Here:
+$4,768
State:
+$17,321
(% of AGI for various income ranges: 5.6% for AGIs below $10k, 0.5% for AGIs $10k-25k, -0.2% for AGIs $25k-50k, 1.5% for AGIs $50k-75k, 1.3% for AGIs $75k-100k, 5.5% for AGIs over 100k)
Profit/loss from business: +$10,867 (reported on 15.3% of returns)
Here:
+$10,867
State:
+$11,771
(% of AGI for various income ranges: 7.8% for AGIs below $10k, 2.9% for AGIs $10k-25k, 1.3% for AGIs $25k-50k, 3.8% for AGIs $50k-75k, 0.9% for AGIs $75k-100k, 5.5% for AGIs over 100k)
Profit/loss from farming: +$8,675 (reported on 8.6% of returns)
Here:
+$8,675
State:
+$2,327
(% of AGI for various income ranges: -9.5% for AGIs below $10k, -0.6% for AGIs $10k-25k, 1.0% for AGIs $25k-50k, 4.7% for AGIs $50k-75k, 3.3% for AGIs $75k-100k, -0.4% for AGIs over 100k)
IRA payment deduction: $3,000 (reported on 3.5% of returns)
61561:
$3,000
Illinois:
$3,087
Self-employed pension: $6,533 (reported on 1.1% of returns)
Here:
$6,533
Illinois:
$16,965
Total itemized deductions: $18,902 (22% of AGI, reported on 27.8% of returns)
Here:
$18,902
State:
$20,239
Here:
22.1% of AGI
State:
19.5% of AGI
(% of AGI for various income ranges: 19.0% for AGIs $10k-25k, 10.5% for AGIs $25k-50k, 10.1% for AGIs $50k-75k, 11.0% for AGIs $75k-100k, 9.8% for AGIs over 100k)
Charity contributions deductions: $5,732 (6% of AGI, reported on 24.7% of returns)
Here:
$5,732
State:
$3,719
Here:
6.3% of AGI
State:
3.4% of AGI
(% of AGI for various income ranges: 1.4% for AGIs $10k-25k, 1.4% for AGIs $25k-50k, 1.7% for AGIs $50k-75k, 2.6% for AGIs $75k-100k, 5.0% for AGIs over 100k)
Total tax: $7,591 (reported on 78.1% of returns)
61561:
$7,591
State:
$9,882
(% of AGI for various income ranges: 2.9% for AGIs below $10k, 4.4% for AGIs $10k-25k, 7.1% for AGIs $25k-50k, 8.8% for AGIs $50k-75k, 10.6% for AGIs $75k-100k, 19.5% for AGIs over 100k)
Earned income credit: $1,700 (reported on 6.8% of returns)
Here:
$1,700
State:
$1,788
Percentage of individuals using paid preparers for their 2004 taxes: 67.0%
Here:
67%
State:
61%
(% for various income ranges: 55.4% for AGIs below $10k, 68.8% for AGIs $10k-25k, 66.2% for AGIs $25k-50k, 71.8% for AGIs $50k-75k, 70.0% for AGIs $75k-100k, 78.4% for AGIs over 100k)
Household received Food Stamps/SNAP in the past 12 months: 42 Household did not receive Food Stamps/SNAP in the past 12 months: 893
Women who had a birth in the past 12 months: 47 (25 now married, 21 unmarried) Women who did not have a birth in the past 12 months: 464 (224 now married, 238 unmarried)
Housing units in zip code 61561 with a mortgage: 422 (52 second mortgage, 52 both second mortgage and home equity loan) Houses without a mortgage: 14
Median monthly owner costs for units with a mortgage: $1,267 Median monthly owner costs for units without a mortgage: $686
Residents with income below the poverty level in 2022:
This zip code:
3.4%
Whole state:
11.9%
Residents with income below 50% of the poverty level in 2022:
This zip code:
1.8%
Whole state:
5.7%
Median number of rooms in houses and condos:
Here:
7.1
State:
6.4
Median number of rooms in apartments:
Here:
4.1
State:
4.1
Notable locations in this zip code not listed on our city pages
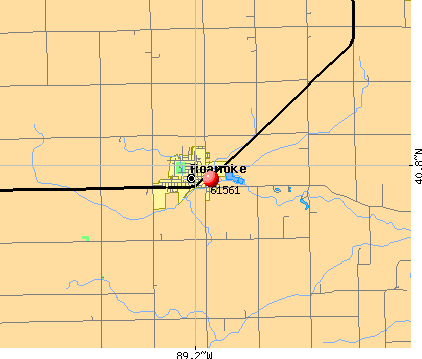
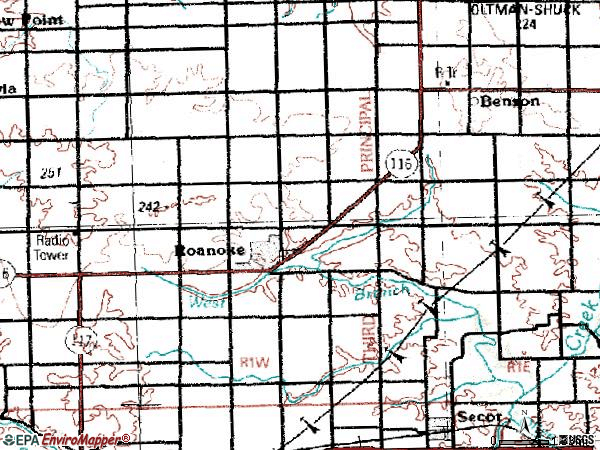
Notable locations in zip code 61561: Lone Willow Farm (A), Pineline Farms (B), Greene Township Hall (C), Roanoke Municipal Ambulance Department (D), Roanoke Fire Protection District (E). Display/hide their locations on the map
Churches in zip code 61561 include: Apostolic Church (A), Brethren Church (B), Roanoke United Methodist Church (C), Saint Joseph's Catholic Church (D), Trinity Lutheran Church (E), Linn Mennonite Church (F). Display/hide their locations on the map
Cemeteries: Carroll Cemetery (1), Mennonite Cemetery (2), Roanke Cemetery (3), Church of the Brethern Cemetery (4), Apostolic Christian Cemetery (5), Saint Peters Cemetery (6). Display/hide their locations on the map
In group quarters: 51 (-1 institutionalized population)
Size of family households: 336 2-persons, 186 3-persons, 65 4-persons, 64 5-persons, 23 6-persons, 5 7-or-more-persons
Size of nonfamily households: 248 1-person, 14 2-persons
465 married couples with children.
133 single-parent households (43 men, 90 women).
96.7% of residents of 61561 zip code speak English at home.
2.2% of residents speak Spanish at home (100% very well).
1.0% of residents speak other Indo-European language at home (100% very well).
Foreign born population: 21 (0.9%) (100.0% of them are naturalized citizens)
This zip code:
0.9%
Whole state:
14.4%
86%Belgium
57%German
9%American
5%Italian
4%Swedish
4%Irish
3%English
1%European
Year of entry for the foreign-born population
02010 or later
02000 to 2009
01990 to 1999
20Before 1990
Major facilities with environmental interests located in this zip code:
ROANOKE CONCRETE PRODUCTS CO (101 CONCRETE DRIVE in ROANOKE, IL)
STATE MASTER (Illinois EPA Project) - AIR PROGRAM STATE MASTER (Illinois EPA Project) - National Pollutant Discharge Elimination System Permit AIR MINOR (AIRS/AFS) CRITERIA AND HAZARDOUS AIR POLLUTANT INVENTORY (Inventory of air pollution sources) National Pollutant Discharge Elimination System NON-MAJOR (Tracking pollutant discharge elimination systems) - permit Business SIC classification: READY-MIXED CONCRETE Business NAICS classification: READY-MIX CONCRETE MANUFACTURING. Organizations: ROANOKE CONCRETE PRODUCTS CO. (CONTACT/OWNER)
PARSONS CO INC (1386 STATE ROUTE 117 in ROANOKE, IL)
STATE MASTER (Illinois EPA Project) - SOLID WASTE PROGRAM, HAZARDOUS WASTE PROGRAM, AIR PROGRAM AIR MINOR (AIRS/AFS) CRITERIA AND HAZARDOUS AIR POLLUTANT INVENTORY (Inventory of air pollution sources) National Pollutant Discharge Elimination System NON-MAJOR (Tracking pollutant discharge elimination systems) - permit HAZARDOUS WASTE BIENNIAL REPORTER (Resource Conservation and Recovery Act (tracking hazardous waste)) Large Quantity Generators, more that 1000 kg of hazardous waste/month (Resource Conservation and Recovery Act (tracking hazardous waste)) - notification TRI REPORTER (Tracking of toxic chemicals releasing facilities) Business SIC classification: COATING, ENGRAVING, AND ALLIED SERVICES; FABRICATED METAL PRODUCTS Business NAICS classification: ALL OTHER MISCELLANEOUS FABRICATED METAL PRODUCT MANUFACTURING. Organizations: PARSONS MANUFACTURING INC (CONTACT/OPERATOR)
, PARSON'S COMPANY, INC. (CONTACT/OWNER)
, ROBERT PARSONS (CONTACT/OWNER)
Alternative names: PARSONS MFG INC
ROANOKE CONCRETE PRODUCTS CO (ROUTE 24 & WESTERN AVENUE in ROANOKE, IL)
STATE MASTER (Illinois EPA Project) - National Pollutant Discharge Elimination System Permit National Pollutant Discharge Elimination System NON-MAJOR (Tracking pollutant discharge elimination systems) - permit Organizations: ROANOKE CONCRETE PRODUCTS CO. (CONTACT/OWNER)
ROANOKE FARMERS ASSN (1861 STATE ROUTE 116 in ROANOKE, IL)
STATE MASTER (Illinois EPA Project) - AIR PROGRAM AIR MINOR (AIRS/AFS) CRITERIA AND HAZARDOUS AIR POLLUTANT INVENTORY (Inventory of air pollution sources) Business SIC classification: GRAIN AND FIELD BEANS Alternative names: ROANOKE FARMERS ASSOCIATION
CHARLES RIVER SPAFAS (117 W HUSSEMAN in ROANOKE, IL)
STATE MASTER (Illinois EPA Project) - HAZARDOUS WASTE PROGRAM (Resource Conservation and Recovery Act (tracking hazardous waste)) Organizations: JOHN A WEBER (CONTACT/OPERATOR)
, JIM & HARLAN BRAKER (CONTACT/OWNER)
AMIGONI CONSTRUCTION (800 N. STATE ST. in ROANOKE, IL)
STATE MASTER (Illinois EPA Project) - AIR PROGRAM AIR MINOR (AIRS/AFS) CRITERIA AND HAZARDOUS AIR POLLUTANT INVENTORY (Inventory of air pollution sources) Business SIC classification: CRUSHED AND BROKEN LIMESTONE Alternative names: AMIGONI CONSTRUCTION BACHMAN PIT
ROANOKE FARMERS ASSN (306 N. MAIN in ROANOKE, IL)
STATE MASTER (Illinois EPA Project) - AIR PROGRAM AIR MINOR (AIRS/AFS) CRITERIA AND HAZARDOUS AIR POLLUTANT INVENTORY (Inventory of air pollution sources) Business SIC classification: GRAIN AND FIELD BEANS Alternative names: ROANOKE FARMERS ASSOCIATION
ROANOKE MILLING CO INC (211 W HUSSEMAN in ROANOKE, IL)
STATE MASTER (Illinois EPA Project) - AIR PROGRAM AIR MINOR (AIRS/AFS) CRITERIA AND HAZARDOUS AIR POLLUTANT INVENTORY (Inventory of air pollution sources) Business SIC classification: FARM SUPPLIES
ILLINOIS CATTLE FEEDERS, INC. (RURAL ROUTE #1 in ROANOKE, IL)
STATE MASTER (Illinois EPA Project) - National Pollutant Discharge Elimination System Permit National Pollutant Discharge Elimination System NON-MAJOR (Tracking pollutant discharge elimination systems) - permit Business SIC classification: BEEF CATTLE FEEDLOTS
ROANOKE AUTO BODY (107 GREEN ST in ROANOKE, IL)
STATE MASTER (Illinois EPA Project) - HAZARDOUS WASTE PROGRAM (Resource Conservation and Recovery Act (tracking hazardous waste))
ROANOKE CONCRETE PRODUCTS CO. (412 E. SANTA FAY in ROANOKE, IL)
National Pollutant Discharge Elimination System NON-MAJOR (Tracking pollutant discharge elimination systems) - permit National Pollutant Discharge Elimination System NON-MAJOR (Tracking pollutant discharge elimination systems) - permit
ROANOKE STP (106 NORTH JEFFERSON in ROANOKE, IL)
STATE MASTER (Illinois EPA Project) - National Pollutant Discharge Elimination System Permit National Pollutant Discharge Elimination System NON-MAJOR (Tracking pollutant discharge elimination systems) - permit Business SIC classification: SEWERAGE SYSTEMS Alternative names: ROANOKE STP, VILLAGE OF
CHARLES RIVER LABORATORIES (520 E HUSSEMAN in ROANOKE, IL)
STATE MASTER (Illinois EPA Project) - AIR PROGRAM AIR MINOR (AIRS/AFS) Business SIC classification: NONCLASSIFIABLE ESTABLISHMENTS
Housing units lacking complete kitchen facilities: 1.9%
69.1%Utility gas
17.3%Bottled, tank, or LP gas
11.1%Electricity
1.8%No fuel used
1.0%Wood
Population in 1990: 2,653. Population change in the 1990s: +210 (+7.9%).
Place of birth for U.S.-born residents:
This state: 2,184
Northeast: 46
Midwest: 172
South: 16
West: 15
67% of the 61561 zip code residents lived in the same house 5 years ago. Out of people who lived in different houses, 64% lived in this county. Out of people who lived in different counties, 50% lived in Illinois.
90% of the 61561 zip code residents lived in the same house 1 year ago. Out of people who lived in different houses, 37% moved from this county. Out of people who lived in different houses, 58% moved from different county within same state. Out of people who lived in different houses, 6% moved from different state.
Private vs. public school enrollment:
Students in private schools in grades 1 to 8 (elementary and middle school): 17
Here:
6.6%
Illinois:
13.3%
Students in private schools in grades 9 to 12 (high school): 5
Here:
3.9%
Illinois:
9.9%
Students in private undergraduate colleges: 18
Here:
15.5%
Illinois:
27.4%
Occupation by median earnings in the past 12 months ($)
84,604Architecture and engineering occupations
78,729Management occupations
78,474Business and financial operations occupations
60,576Transportation occupations
59,664Installation, maintenance, and repair occupations
59,342Sales and related occupations
Top industries in this zip code by the number of employees in 2005:
Health Care and Social Assistance: Nursing Care Facilities (100-249 employees: 1 establishment)
Wholesale Trade: Farm and Garden Machinery and Equipment Merchant Wholesalers (20-49: 1)
Other Services (except Public Administration): Commercial and Industrial Machinery and Equipment (except Automotive and Electronic) Repair and Maintenance (10-19: 1, 1-4: 3)
Other Services (except Public Administration): Religious Organizations (5-9: 2, 1-4: 2)
People in group quarters in 2010:
57 people in nursing facilities/skilled-nursing facilities
People in group quarters in 2000:
69 people in nursing homes
Fatal accident statistics in 2012:
Fatal accident count: 1
Vehicles involved in fatal accidents: 1
Fatal accidents caused by drunken drivers: 0
Fatalities: 1
Persons involved in fatal accidents: 1
Pedestrians involved in fatal accidents: 1
Fatal accident statistics in 2010:
Fatal accident count: 1
Vehicles involved in fatal accidents: 1
Fatal accidents caused by drunken drivers: 0
Fatalities: 1
Persons involved in fatal accidents: 1
Pedestrians involved in fatal accidents: 0
Home Mortgage Disclosure Act Aggregated Statistics For Year 2009 (Based on 4 partial tracts)
A) FHA, FSA/RHS & VA Home Purchase Loans
B) Conventional Home Purchase Loans
C) Refinancings
D) Home Improvement Loans
F) Non-occupant Loans on < 5 Family Dwellings (A B C & D)
Number
Average Value
Number
Average Value
Number
Average Value
Number
Average Value
Number
Average Value
LOANS ORIGINATED
15
$95,380
18
$127,289
109
$115,628
14
$28,696
6
$56,533
APPLICATIONS APPROVED, NOT ACCEPTED
0
$0
0
$0
5
$157,534
0
$0
0
$0
APPLICATIONS DENIED
4
$103,910
3
$41,710
19
$110,279
4
$44,385
0
$0
APPLICATIONS WITHDRAWN
4
$55,628
2
$69,675
5
$91,458
0
$0
0
$0
FILES CLOSED FOR INCOMPLETENESS
0
$0
0
$0
4
$134,935
0
$0
0
$0
Aggregated Statistics For Year 2008 (Based on 4 partial tracts)
A) FHA, FSA/RHS & VA Home Purchase Loans
B) Conventional Home Purchase Loans
C) Refinancings
D) Home Improvement Loans
F) Non-occupant Loans on < 5 Family Dwellings (A B C & D)
Number
Average Value
Number
Average Value
Number
Average Value
Number
Average Value
Number
Average Value
LOANS ORIGINATED
11
$84,213
29
$102,899
71
$101,848
6
$40,142
5
$75,136
APPLICATIONS APPROVED, NOT ACCEPTED
0
$0
0
$0
5
$149,302
2
$95,305
0
$0
APPLICATIONS DENIED
3
$35,380
7
$76,536
22
$85,550
8
$68,370
0
$0
APPLICATIONS WITHDRAWN
0
$0
6
$97,828
10
$114,368
2
$20,400
0
$0
FILES CLOSED FOR INCOMPLETENESS
0
$0
0
$0
3
$97,727
0
$0
0
$0
Aggregated Statistics For Year 2007 (Based on 4 partial tracts)
A) FHA, FSA/RHS & VA Home Purchase Loans
B) Conventional Home Purchase Loans
C) Refinancings
D) Home Improvement Loans
E) Loans on Dwellings For 5+ Families
F) Non-occupant Loans on < 5 Family Dwellings (A B C & D)
Number
Average Value
Number
Average Value
Number
Average Value
Number
Average Value
Number
Average Value
Number
Average Value
LOANS ORIGINATED
10
$83,997
39
$94,480
71
$95,396
13
$27,624
1
$209,720
7
$63,410
APPLICATIONS APPROVED, NOT ACCEPTED
1
$158,570
0
$0
5
$86,976
2
$36,940
0
$0
0
$0
APPLICATIONS DENIED
0
$0
3
$95,133
22
$78,805
10
$55,122
0
$0
1
$114,280
APPLICATIONS WITHDRAWN
0
$0
2
$46,165
12
$81,859
4
$28,022
0
$0
0
$0
FILES CLOSED FOR INCOMPLETENESS
0
$0
0
$0
2
$166,075
0
$0
0
$0
0
$0
Aggregated Statistics For Year 2006 (Based on 4 partial tracts)
A) FHA, FSA/RHS & VA Home Purchase Loans
B) Conventional Home Purchase Loans
C) Refinancings
D) Home Improvement Loans
F) Non-occupant Loans on < 5 Family Dwellings (A B C & D)
Number
Average Value
Number
Average Value
Number
Average Value
Number
Average Value
Number
Average Value
LOANS ORIGINATED
7
$80,819
69
$89,405
57
$97,345
17
$40,107
12
$61,325
APPLICATIONS APPROVED, NOT ACCEPTED
0
$0
4
$70,808
3
$109,317
3
$13,640
0
$0
APPLICATIONS DENIED
3
$71,187
11
$71,749
31
$95,767
15
$64,092
1
$68,140
APPLICATIONS WITHDRAWN
0
$0
5
$97,676
20
$89,842
1
$61,520
0
$0
FILES CLOSED FOR INCOMPLETENESS
0
$0
1
$127,880
2
$104,175
0
$0
0
$0
Aggregated Statistics For Year 2005 (Based on 4 partial tracts)
A) FHA, FSA/RHS & VA Home Purchase Loans
B) Conventional Home Purchase Loans
C) Refinancings
D) Home Improvement Loans
F) Non-occupant Loans on < 5 Family Dwellings (A B C & D)
Number
Average Value
Number
Average Value
Number
Average Value
Number
Average Value
Number
Average Value
LOANS ORIGINATED
4
$68,812
50
$90,247
66
$101,207
7
$46,236
7
$86,203
APPLICATIONS APPROVED, NOT ACCEPTED
0
$0
2
$91,790
7
$55,667
4
$23,338
0
$0
APPLICATIONS DENIED
1
$84,400
7
$53,459
43
$87,129
14
$42,551
1
$79,290
APPLICATIONS WITHDRAWN
0
$0
7
$58,789
14
$84,456
3
$184,470
1
$43,480
FILES CLOSED FOR INCOMPLETENESS
0
$0
4
$69,088
1
$114,280
0
$0
0
$0
Aggregated Statistics For Year 2004 (Based on 4 partial tracts)
A) FHA, FSA/RHS & VA Home Purchase Loans
B) Conventional Home Purchase Loans
C) Refinancings
D) Home Improvement Loans
F) Non-occupant Loans on < 5 Family Dwellings (A B C & D)
Number
Average Value
Number
Average Value
Number
Average Value
Number
Average Value
Number
Average Value
LOANS ORIGINATED
4
$70,972
50
$87,514
77
$110,220
13
$16,266
20
$55,600
APPLICATIONS APPROVED, NOT ACCEPTED
1
$99,750
0
$0
5
$59,672
2
$100,470
1
$99,750
APPLICATIONS DENIED
2
$71,215
8
$72,108
35
$81,680
5
$19,850
2
$56,190
APPLICATIONS WITHDRAWN
0
$0
4
$71,410
23
$87,033
0
$0
0
$0
FILES CLOSED FOR INCOMPLETENESS
1
$80,560
0
$0
0
$0
0
$0
0
$0
Aggregated Statistics For Year 2003 (Based on 4 partial tracts)
A) FHA, FSA/RHS & VA Home Purchase Loans
B) Conventional Home Purchase Loans
C) Refinancings
D) Home Improvement Loans
F) Non-occupant Loans on < 5 Family Dwellings (A B C & D)
Number
Average Value
Number
Average Value
Number
Average Value
Number
Average Value
Number
Average Value
LOANS ORIGINATED
9
$71,740
58
$80,583
212
$97,695
10
$14,463
13
$71,236
APPLICATIONS APPROVED, NOT ACCEPTED
0
$0
0
$0
13
$88,243
4
$11,732
0
$0
APPLICATIONS DENIED
0
$0
7
$71,306
36
$76,580
5
$8,372
3
$37,787
APPLICATIONS WITHDRAWN
3
$59,037
2
$65,840
20
$82,596
3
$12,787
0
$0
FILES CLOSED FOR INCOMPLETENESS
0
$0
2
$55,170
4
$72,252
3
$17,050
0
$0
Aggregated Statistics For Year 2002 (Based on 2 partial tracts)
A) FHA, FSA/RHS & VA Home Purchase Loans
B) Conventional Home Purchase Loans
C) Refinancings
D) Home Improvement Loans
E) Loans on Dwellings For 5+ Families
F) Non-occupant Loans on < 5 Family Dwellings (A B C & D)
Number
Average Value
Number
Average Value
Number
Average Value
Number
Average Value
Number
Average Value
Number
Average Value
LOANS ORIGINATED
9
$68,913
40
$73,403
155
$87,049
15
$15,601
1
$166,240
8
$63,460
APPLICATIONS APPROVED, NOT ACCEPTED
1
$72,890
1
$93,350
1
$191,820
1
$3,840
0
$0
0
$0
APPLICATIONS DENIED
1
$76,730
1
$80,560
24
$63,833
8
$4,476
0
$0
0
$0
APPLICATIONS WITHDRAWN
0
$0
0
$0
10
$79,797
0
$0
0
$0
0
$0
FILES CLOSED FOR INCOMPLETENESS
0
$0
0
$0
1
$182,870
0
$0
0
$0
0
$0
Aggregated Statistics For Year 2001 (Based on 2 partial tracts)
A) FHA, FSA/RHS & VA Home Purchase Loans
B) Conventional Home Purchase Loans
C) Refinancings
D) Home Improvement Loans
E) Loans on Dwellings For 5+ Families
F) Non-occupant Loans on < 5 Family Dwellings (A B C & D)
Number
Average Value
Number
Average Value
Number
Average Value
Number
Average Value
Number
Average Value
Number
Average Value
LOANS ORIGINATED
3
$55,840
23
$79,007
105
$87,165
12
$16,731
1
$104,860
3
$24,297
APPLICATIONS APPROVED, NOT ACCEPTED
0
$0
0
$0
8
$44,599
0
$0
0
$0
0
$0
APPLICATIONS DENIED
4
$72,252
3
$57,973
6
$75,450
12
$9,698
0
$0
0
$0
APPLICATIONS WITHDRAWN
0
$0
3
$46,890
10
$78,902
1
$5,120
0
$0
0
$0
FILES CLOSED FOR INCOMPLETENESS
0
$0
0
$0
4
$69,375
0
$0
0
$0
0
$0
Aggregated Statistics For Year 2000 (Based on 2 partial tracts)
A) FHA, FSA/RHS & VA Home Purchase Loans
B) Conventional Home Purchase Loans
C) Refinancings
D) Home Improvement Loans
E) Loans on Dwellings For 5+ Families
F) Non-occupant Loans on < 5 Family Dwellings (A B C & D)
Number
Average Value
Number
Average Value
Number
Average Value
Number
Average Value
Number
Average Value
Number
Average Value
LOANS ORIGINATED
4
$65,220
28
$69,740
32
$50,712
6
$14,493
1
$76,730
9
$46,889
APPLICATIONS APPROVED, NOT ACCEPTED
0
$0
5
$41,434
10
$74,810
1
$12,790
0
$0
3
$41,773
APPLICATIONS DENIED
3
$70,760
6
$101,238
17
$44,156
6
$10,657
0
$0
0
$0
APPLICATIONS WITHDRAWN
0
$0
1
$31,970
9
$25,860
0
$0
0
$0
0
$0
FILES CLOSED FOR INCOMPLETENESS
0
$0
1
$122,760
4
$41,242
0
$0
0
$0
0
$0
Aggregated Statistics For Year 1999 (Based on 2 partial tracts)
A) FHA, FSA/RHS & VA Home Purchase Loans
B) Conventional Home Purchase Loans
C) Refinancings
D) Home Improvement Loans
E) Loans on Dwellings For 5+ Families
F) Non-occupant Loans on < 5 Family Dwellings (A B C & D)
Detailed PMIC statistics for the following Tracts:0301.00
, 0303.00
2002 - 2018 National Fire Incident Reporting System (NFIRS) incidents
According to the data from the years 2002 - 2018 the average number of fire incidents per year is 11. The highest number of fires - 20 took place in 2008, and the least - 2 in 2013. The data has a decreasing trend.
When looking into fire subcategories, the most incidents belonged to: Outside Fires (42.8%), and Structure Fires (33.9%).
Fire incident types reported to NFIRS in Zip Code 61561


 Nearest zip codes: 61516, 61530, 61771, 61545, 61570, 61729.


 According to the data from the years 2002 - 2018 the average number of fire incidents per year is 11. The highest number of fires - 20 took place in 2008, and the least - 2 in 2013. The data has a decreasing trend.
 When looking into fire subcategories, the most incidents belonged to: Outside Fires (42.8%), and Structure Fires (33.9%).