Estimated zip code population in 2022: 3,734 Zip code population in 2010: 3,683 Zip code population in 2000: 3,329
Houses and condos: 1,567 Renter-occupied apartments: 302
% of renters here:
22%
State:
27%
March 2022 cost of living index in zip code 49657: 80.8 (low, U.S. average is 100)
Land area: 96.4 sq. mi. Water area: 0.6 sq. mi.
Population density: 39 people per square mile
(very low).
OSM Map
General Map
Google Map
MSN Map
OSM Map
General Map
Google Map
MSN Map
OSM Map
General Map
Google Map
MSN Map
OSM Map
General Map
Google Map
MSN Map
Please wait while loading the map...
Real estate property taxes paid for housing units in 2022:
This zip code:
0.9% ($1,647)
Michigan:
1.2% ($2,746)
Median real estate property taxes paid for housing units with mortgages in 2022: $2,023 (1.1%) Median real estate property taxes paid for housing units with no mortgage in 2022: $1,423 (0.8%)
Business Search- 14 Million verified businesses
Males: 1,737
(46.5%)
Females: 1,996
(53.5%)
For population 25 years and over in 49657:
High school or higher: 90.3%
Bachelor's degree or higher: 18.7%
Graduate or professional degree: 5.8%
Unemployed: 3.7%
Mean travel time to work (commute): 19.0 minutes
For population 15 years and over in 49657:
Never married: 26.8%
Now married: 55.4%
Separated: 2.0%
Widowed: 6.8%
Divorced: 9.1%
Zip code 49657 compared to state average:
Black race population percentage significantly below state average.
Foreign-born population percentage below state average.
Length of stay since moving in significantly above state average.
Number of college students below state average.
Percentage of population with a bachelor's degree or higher below state average.
Averages for the 2020 tax year for zip code 49657, filed in 2021:
Average Adjusted Gross Income (AGI) in 2020: $57,839 (Individual Income Tax Returns)
Here:
$57,839
State:
$68,945
Salary/wage: $45,846 (reported on 79.4% of returns)
Here:
$45,846
State:
$57,142
(% of AGI for various income ranges: 1244.5% for AGIs below $25k, 3684.4% for AGIs $25k-50k, 6833.8% for AGIs $50k-75k, 9956.0% for AGIs $75k-100k, 13525.5% for AGIs $100k-200k)
Taxable interest for individuals: $1,847 (reported on 29.4% of returns)
This zip code:
$1,847
Michigan:
$1,630
(% of AGI for various income ranges: 32.9% for AGIs below $25k, 22.9% for AGIs $25k-50k, 55.6% for AGIs $50k-75k, 107.0% for AGIs $75k-100k, 142.7% for AGIs $100k-200k)
Ordinary dividends: $3,367 (reported on 15.0% of returns)
Here:
$3,367
State:
$6,972
(% of AGI for various income ranges: 35.5% for AGIs below $25k, 33.8% for AGIs $25k-50k, 28.7% for AGIs $50k-75k, 85.0% for AGIs $75k-100k, 410.9% for AGIs $100k-200k)
Net capital gain/loss in AGI: +$14,338 (reported on 16.2% of returns)
Here:
+$14,338
State:
+$20,064
(% of AGI for various income ranges: 35.2% for AGIs below $25k, 50.0% for AGIs $25k-50k, 138.8% for AGIs $50k-75k, 323.0% for AGIs $75k-100k, 2640.0% for AGIs $100k-200k)
Profit/loss from business: +$11,559 (reported on 18.1% of returns)
Here:
+$11,559
State:
+$11,172
(% of AGI for various income ranges: 136.5% for AGIs below $25k, 130.0% for AGIs $25k-50k, 393.8% for AGIs $50k-75k, 718.0% for AGIs $75k-100k, 1035.5% for AGIs $100k-200k)
Taxable individual retirement arrangement distribution: $13,456 (reported on 11.2% of returns)
49657:
$13,456
Michigan:
$19,803
(% of AGI for various income ranges: 111.0% for AGIs below $25k, 121.2% for AGIs $25k-50k, 396.0% for AGIs $75k-100k, 1154.5% for AGIs $100k-200k)
Total itemized deductions: $56,780 (reported on 3.1% of returns)
Here:
$56,780
State:
$34,117
(% of AGI for various income ranges: 972.0% for AGIs $75k-100k)
Charity contributions: $47,800 (reported on 2.5% of returns)
Here:
$47,800
State:
$13,548
(% of AGI for various income ranges: 196.9% for AGIs $50k-75k)
Taxes paid: $7,320 (reported on 3.1% of returns)
49657:
$7,320
State:
$7,972
(% of AGI for various income ranges: 165.0% for AGIs $75k-100k)
Earned income credit: $2,114 (reported on 13.8% of returns)
Here:
$2,114
State:
$2,251
(% of AGI for various income ranges: 78.1% for AGIs below $25k, 65.6% for AGIs $25k-50k)
Percentage of individuals using paid preparers for their 2020 taxes: 95.6%
Here:
96%
State:
93%
(% for various income ranges: 94.4% for AGIs below $25k, 97.7% for AGIs $25k-50k, 91.7% for AGIs $50k-75k, 93.8% for AGIs $75k-100k, 100.0% for AGIs $100k-200k, 100.0% for AGIs over 200k)
Averages for the 2012 tax year for zip code 49657, filed in 2013:
Average Adjusted Gross Income (AGI) in 2012: $41,756 (Individual Income Tax Returns)
Here:
$41,756
State:
$55,609
Salary/wage: $36,177 (reported on 79.2% of returns)
Here:
$36,177
State:
$46,782
(% of AGI for various income ranges: 68.7% for AGIs below $25k, 74.1% for AGIs $25k-50k, 76.3% for AGIs $50k-75k, 76.9% for AGIs $75k-100k, 83.5% for AGIs $100k-200k)
Taxable interest for individuals: $1,232 (reported on 32.5% of returns)
This zip code:
$1,232
Michigan:
$1,491
(% of AGI for various income ranges: 1.2% for AGIs below $25k, 0.6% for AGIs $25k-50k, 0.4% for AGIs $50k-75k, 0.4% for AGIs $75k-100k, 3.1% for AGIs $100k-200k)
Ordinary dividends: $2,333 (reported on 15.6% of returns)
Here:
$2,333
State:
$6,225
(% of AGI for various income ranges: 1.4% for AGIs below $25k, 0.5% for AGIs $25k-50k, 0.8% for AGIs $50k-75k, 0.2% for AGIs $75k-100k, 2.4% for AGIs $100k-200k)
Net capital gain/loss in AGI: +$13,455 (reported on 13.0% of returns)
Here:
+$13,455
State:
+$9,326
(% of AGI for various income ranges: 0.7% for AGIs below $25k, 1.7% for AGIs $25k-50k, 4.7% for AGIs $50k-75k, 15.8% for AGIs $100k-200k)
Profit/loss from business: +$12,182 (reported on 21.4% of returns)
Here:
+$12,182
State:
+$11,523
(% of AGI for various income ranges: 12.1% for AGIs below $25k, 7.9% for AGIs $25k-50k, 3.3% for AGIs $50k-75k, 8.4% for AGIs $75k-100k, 5.6% for AGIs $100k-200k)
Taxable individual retirement arrangement distribution: $9,824 (reported on 11.0% of returns)
49657:
$9,824
Michigan:
$15,298
(% of AGI for various income ranges: 4.3% for AGIs below $25k, 2.8% for AGIs $25k-50k, 3.1% for AGIs $50k-75k, 4.5% for AGIs $100k-200k)
Total itemized deductions: $20,484 (24% of AGI, reported on 20.8% of returns)
Here:
$20,484
State:
$21,628
Here:
23.9% of AGI
State:
18.4% of AGI
(% of AGI for various income ranges: 8.4% for AGIs below $25k, 6.3% for AGIs $25k-50k, 8.7% for AGIs $50k-75k, 11.2% for AGIs $75k-100k, 11.9% for AGIs $100k-200k, 20.2% for AGIs over 200k)
Charity contributions: $7,443 (reported on 18.2% of returns)
Here:
$7,443
State:
$4,225
(% of AGI for various income ranges: 1.5% for AGIs below $25k, 1.3% for AGIs $25k-50k, 2.0% for AGIs $50k-75k, 3.1% for AGIs $75k-100k, 4.9% for AGIs $100k-200k, 10.0% for AGIs over 200k)
Taxes paid: $5,372 (reported on 20.8% of returns)
49657:
$5,372
State:
$8,327
(% of AGI for various income ranges: 1.5% for AGIs below $25k, 1.4% for AGIs $25k-50k, 2.2% for AGIs $50k-75k, 3.3% for AGIs $75k-100k, 3.9% for AGIs $100k-200k, 5.1% for AGIs over 200k)
Earned income credit: $2,096 (reported on 18.2% of returns)
Here:
$2,096
State:
$2,306
(% of AGI for various income ranges: 5.0% for AGIs below $25k, 1.4% for AGIs $25k-50k)
Percentage of individuals using paid preparers for their 2012 taxes: 67.5%
Here:
68%
State:
57%
(% for various income ranges: 62.7% for AGIs below $25k, 66.7% for AGIs $25k-50k, 73.9% for AGIs $50k-75k, 75.0% for AGIs $75k-100k, 75.0% for AGIs $100k-200k, 100.0% for AGIs over 200k)
Averages for the 2004 tax year for zip code 49657, filed in 2005:
Average Adjusted Gross Income (AGI) in 2004: $34,375 (Individual Income Tax Returns)
Here:
$34,375
State:
$48,204
Salary/wage: $31,634 (reported on 84.9% of returns)
Here:
$31,634
State:
$42,791
(% of AGI for various income ranges: 108.0% for AGIs below $10k, 73.9% for AGIs $10k-25k, 78.6% for AGIs $25k-50k, 82.4% for AGIs $50k-75k, 76.1% for AGIs $75k-100k, 71.3% for AGIs over 100k)
Taxable interest for individuals: $1,380 (reported on 43.1% of returns)
This zip code:
$1,380
Michigan:
$1,725
(% of AGI for various income ranges: 9.9% for AGIs below $10k, 2.5% for AGIs $10k-25k, 1.2% for AGIs $25k-50k, 1.0% for AGIs $50k-75k, 1.0% for AGIs $75k-100k, 3.0% for AGIs over 100k)
Taxable dividends: $1,000 (reported on 19.0% of returns)
Here:
$1,000
State:
$3,420
(% of AGI for various income ranges: 3.3% for AGIs below $10k, 1.0% for AGIs $10k-25k, 0.6% for AGIs $25k-50k, 0.3% for AGIs $50k-75k, 0.4% for AGIs $75k-100k, 0.3% for AGIs over 100k)
Net capital gain/loss: +$8,308 (reported on 17.2% of returns)
Here:
+$8,308
State:
+$8,532
(% of AGI for various income ranges: 0.2% for AGIs below $10k, 1.2% for AGIs $10k-25k, 4.0% for AGIs $25k-50k, 4.3% for AGIs $50k-75k, 6.6% for AGIs $75k-100k, 4.4% for AGIs over 100k)
Profit/loss from business: +$6,485 (reported on 20.6% of returns)
Here:
+$6,485
State:
+$9,547
(% of AGI for various income ranges: 7.1% for AGIs below $10k, 9.9% for AGIs $10k-25k, 4.6% for AGIs $25k-50k, 3.5% for AGIs $50k-75k, 0.3% for AGIs $75k-100k, 1.8% for AGIs over 100k)
IRA payment deduction: $2,529 (reported on 4.8% of returns)
49657:
$2,529
Michigan:
$2,875
Total itemized deductions: $15,843 (25% of AGI, reported on 23.9% of returns)
Here:
$15,843
State:
$18,509
Here:
25.0% of AGI
State:
20.7% of AGI
(% of AGI for various income ranges: 15.8% for AGIs below $10k, 10.2% for AGIs $10k-25k, 8.5% for AGIs $25k-50k, 9.7% for AGIs $50k-75k, 13.8% for AGIs $75k-100k, 14.7% for AGIs over 100k)
Charity contributions deductions: $4,893 (7% of AGI, reported on 20.9% of returns)
Here:
$4,893
State:
$3,365
Here:
7.3% of AGI
State:
3.6% of AGI
(% of AGI for various income ranges: 2.3% for AGIs below $10k, 1.8% for AGIs $10k-25k, 2.1% for AGIs $25k-50k, 2.4% for AGIs $50k-75k, 3.7% for AGIs $75k-100k, 5.7% for AGIs over 100k)
Total tax: $3,779 (reported on 70.6% of returns)
49657:
$3,779
State:
$7,691
(% of AGI for various income ranges: 3.8% for AGIs below $10k, 4.5% for AGIs $10k-25k, 5.5% for AGIs $25k-50k, 6.7% for AGIs $50k-75k, 8.6% for AGIs $75k-100k, 15.9% for AGIs over 100k)
Earned income credit: $1,720 (reported on 14.3% of returns)
Here:
$1,720
State:
$1,737
Percentage of individuals using paid preparers for their 2004 taxes: 66.2%
Here:
66%
State:
60%
(% for various income ranges: 58.9% for AGIs below $10k, 65.9% for AGIs $10k-25k, 67.3% for AGIs $25k-50k, 74.6% for AGIs $50k-75k, 64.3% for AGIs $75k-100k, 84.0% for AGIs over 100k)
Household received Food Stamps/SNAP in the past 12 months: 196 Household did not receive Food Stamps/SNAP in the past 12 months: 1,168
Women who had a birth in the past 12 months: 56 (52 now married, 4 unmarried) Women who did not have a birth in the past 12 months: 793 (345 now married, 447 unmarried)
Housing units in zip code 49657 with a mortgage: 579 (88 second mortgage, 60 both second mortgage and home equity loan) Houses without a mortgage: 3
Median monthly owner costs for units with a mortgage: $1,257 Median monthly owner costs for units without a mortgage: $506
Residents with income below the poverty level in 2022:
This zip code:
7.5%
Whole state:
13.4%
Residents with income below 50% of the poverty level in 2022:
This zip code:
5.7%
Whole state:
6.9%
Median number of rooms in houses and condos:
Here:
7.0
State:
6.5
Median number of rooms in apartments:
Here:
4.3
State:
4.3
Notable locations in this zip code not listed on our city pages
Notable locations in zip code 49657: Lucas Station (A), McBain Station (B), Missaukee County Emergency Medical Services McBain (C), McBain Community Library (D), McBain Community Fire Department (E). Display/hide their locations on the map
Churches in zip code 49657 include: Vogel Center Christian Church (A), Lucas Christian Reformed Church (B), Rehoboth Reformed Church (C), Northland Community Church (D), McBain Presbyterian Church (E), McBain Baptist Church (F), McBain Christian Reformed Church (G), Calvin Church (H). Display/hide their locations on the map
In group quarters: 77 (-1 institutionalized population)
Size of family households: 447 2-persons, 166 3-persons, 169 4-persons, 136 5-persons, 45 6-persons, 33 7-or-more-persons
Size of nonfamily households: 302 1-person, 58 2-persons
659 married couples with children.
190 single-parent households (67 men, 123 women).
90.2% of residents of 49657 zip code speak English at home.
4.8% of residents speak Spanish at home (45% very well, 27% well, 22% not well, 6% not at all).
4.9% of residents speak other Indo-European language at home (65% very well, 30% well, 5% not at all).
0.1% of residents speak Asian or Pacific Island language at home (100% very well).
Foreign born population: 123 (3.3%) (7.4% of them are naturalized citizens)
This zip code:
3.3%
Whole state:
6.9%
75%Honduras
19%El Salvador
1%France
1%Germany
32%Dutch
14%German
12%American
7%English
4%Irish
4%Swiss
3%European
Year of entry for the foreign-born population
192010 or later
932000 to 2009
161990 to 1999
6Before 1990
Facilities with environmental interests located in this zip code:
FALMOUTH COOP INC (101 NORTH PINE in MC BAIN, MI)
COMPLIANCE ACTIVITY (Tracking inspections of insecticide, fungicide, and rodenticide, and toxic substances) Alternative names: FALMOUTH CO-OP CO
MI DEPT/TRANSPORTATION BRIDGE (M-66 OVER CLAM RIVER in MC BAIN, MI)
(Resource Conservation and Recovery Act (tracking hazardous waste)) Organizations: MICH DEPT OF TRANSPORTATION (CONTACT/OPERATOR)
Alternative names: MIDOT BRIDGE M-66 OVER CLAM RIVER
BIEWER SAWMILL INC (6256 GERWOUDE in MCBAIN, MI)
AIR MINOR (AIRS/AFS) Business SIC classification: SAWMILLS AND PLANING MILLS, GENERAL
FALMOUTH COOP (101 PINE ST in MC BAIN, MI)
COMPLIANCE ACTIVITY (Tracking inspections of insecticide, fungicide, and rodenticide, and toxic substances)
GRIFFITHS LAMINATING SYSTEM (6500 GERWOUDE DR. in MCBAIN, MI)
AIR SYNTHETIC MINOR (AIRS/AFS) Business SIC classification: PLASTICS PRODUCTS
Housing units lacking complete plumbing facilities: 2.1% Housing units lacking complete kitchen facilities: 1.5%
48.8%Bottled, tank, or LP gas
27.0%Utility gas
12.1%Wood
5.7%Electricity
3.3%Fuel oil, kerosene, etc.
1.9%Other fuel
0.7%Coal or coke
0.7%No fuel used
Population in 1990: 3,431.
Place of birth for U.S.-born residents:
This state: 3,224
Northeast: 34
Midwest: 174
South: 73
West: 84
68% of the 49657 zip code residents lived in the same house 5 years ago. Out of people who lived in different houses, 49% lived in this county. Out of people who lived in different counties, 50% lived in Michigan.
90% of the 49657 zip code residents lived in the same house 1 year ago. Out of people who lived in different houses, 30% moved from this county. Out of people who lived in different houses, 56% moved from different county within same state. Out of people who lived in different houses, 9% moved from different state. Out of people who lived in different houses, 5% moved from abroad.
Private vs. public school enrollment:
Students in private schools in grades 1 to 8 (elementary and middle school): 87
Here:
23.0%
Michigan:
12.4%
Students in private schools in grades 9 to 12 (high school): 42
Here:
18.2%
Michigan:
9.8%
Students in private undergraduate colleges: 32
Here:
56.7%
Michigan:
14.9%
Occupation by median earnings in the past 12 months ($)
61,698Architecture and engineering occupations
61,177Law enforcement workers including supervisors
56,167Health diagnosing and treating practitioners and other technical occupations
54,848Management occupations
52,158Business and financial operations occupations
45,611Installation, maintenance, and repair occupations
Top industries in this zip code by the number of employees in 2005:
Health Care and Social Assistance: Nursing Care Facilities (100-249 employees: 1 establishment)
Educational Services: Elementary and Secondary Schools (50-99: 1)
Accommodation and Food Services: Full-Service Restaurants (20-49: 1)
Other Services (except Public Administration): Religious Organizations (5-9: 1, 1-4: 5)
Wholesale Trade: Farm and Garden Machinery and Equipment Merchant Wholesalers (10-19: 1, 1-4: 1)
People in group quarters in 2010:
80 people in nursing facilities/skilled-nursing facilities
7 people in group homes intended for adults
People in group quarters in 2000:
81 people in nursing homes
23 people in agriculture workers' dormitories on farms
6 people in homes for the mentally retarded
Fatal accident statistics in 2010:
Fatal accident count: 1
Vehicles involved in fatal accidents: 1
Fatal accidents caused by drunken drivers: 0
Fatalities: 1
Persons involved in fatal accidents: 1
Pedestrians involved in fatal accidents: 1
2002 - 2018 National Fire Incident Reporting System (NFIRS) incidents
According to the data from the years 2002 - 2018 the average number of fires per year is 14. The highest number of reported fires - 27 took place in 2013, and the least - 3 in 2012. The data has a growing trend.
When looking into fire subcategories, the most incidents belonged to: Structure Fires (50.6%), and Outside Fires (31.9%).
Fire incident types reported to NFIRS in Zip Code 49657

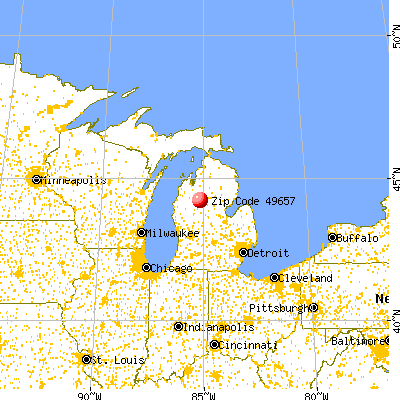


 Nearest zip codes: 49665, 49651, 49632, 49667, 49688, 49663.


 According to the data from the years 2002 - 2018 the average number of fires per year is 14. The highest number of reported fires - 27 took place in 2013, and the least - 3 in 2012. The data has a growing trend.
 When looking into fire subcategories, the most incidents belonged to: Structure Fires (50.6%), and Outside Fires (31.9%).