Estimated zip code population in 2022: 2,325 Zip code population in 2010: 2,703 Zip code population in 2000: 2,602
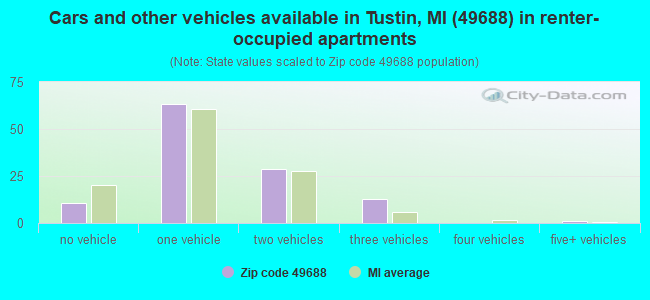
Houses and condos: 1,304 Renter-occupied apartments: 116
% of renters here:
13%
State:
27%
March 2022 cost of living index in zip code 49688: 81.7 (low, U.S. average is 100)
Land area: 96.5 sq. mi. Water area: 0.5 sq. mi.
Population density: 24 people per square mile
(very low).
OSM Map
General Map
Google Map
MSN Map
OSM Map
General Map
Google Map
MSN Map
OSM Map
General Map
Google Map
MSN Map
OSM Map
General Map
Google Map
MSN Map
Please wait while loading the map...
Real estate property taxes paid for housing units in 2022:
This zip code:
1.0% ($1,726)
Michigan:
1.2% ($2,746)
Median real estate property taxes paid for housing units with mortgages in 2022: $1,769 (0.9%) Median real estate property taxes paid for housing units with no mortgage in 2022: $1,682 (1.2%)
Business Search- 14 Million verified businesses
Males: 1,260
(54.2%)
Females: 1,065
(45.8%)
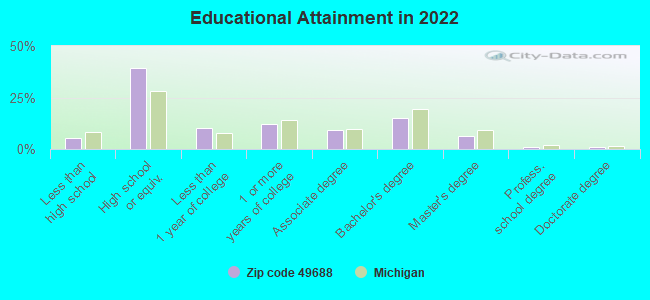
For population 25 years and over in 49688:
High school or higher: 93.7%
Bachelor's degree or higher: 23.3%
Graduate or professional degree: 8.2%
Unemployed: 2.2%
Mean travel time to work (commute): 26.7 minutes
For population 15 years and over in 49688:
Never married: 20.0%
Now married: 61.9%
Separated: 1.2%
Widowed: 4.9%
Divorced: 12.0%
Zip code 49688 compared to state average:
Unemployed percentage below state average.
Black race population percentage significantly below state average.
Hispanic race population percentage significantly below state average.
Foreign-born population percentage significantly below state average.
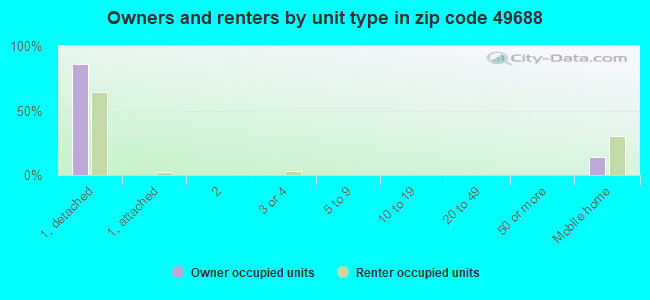
Renting percentage below state average.
Length of stay since moving in significantly above state average.
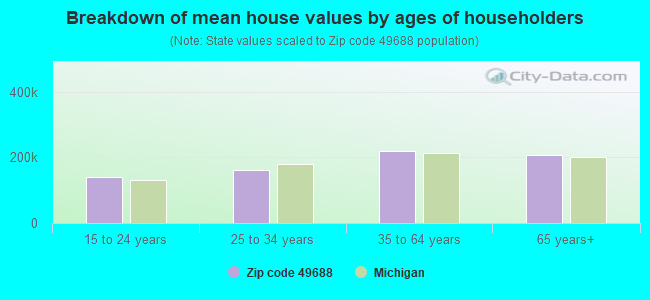
Estimated median house/condo value in 2022: $169,611
49688:
$169,611
Michigan:
$224,400
According to our research of Michigan and other state lists, there were 9 registered sex offenders living in 49688 zip code as of May 23, 2024. The ratio of all residents to sex offenders in zip code 49688 is 294 to 1. The ratio of registered sex offenders to all residents in this zip code is near the state average.
Median resident age:
This zip code:
42.7 years
Michigan median age:
40.3 years
Average household size:
This zip code:
2.6 people
Michigan:
2.4 people
Averages for the 2020 tax year for zip code 49688, filed in 2021:
Average Adjusted Gross Income (AGI) in 2020: $56,655 (Individual Income Tax Returns)
Here:
$56,655
State:
$68,945
Salary/wage: $47,991 (reported on 77.6% of returns)
Here:
$47,991
State:
$57,142
(% of AGI for various income ranges: 1151.6% for AGIs below $25k, 3395.6% for AGIs $25k-50k, 5450.7% for AGIs $50k-75k, 8200.0% for AGIs $75k-100k, 13206.4% for AGIs $100k-200k)
Taxable interest for individuals: $914 (reported on 29.6% of returns)
This zip code:
$914
Michigan:
$1,630
(% of AGI for various income ranges: 32.8% for AGIs below $25k, 16.4% for AGIs $25k-50k, 35.3% for AGIs $50k-75k, 37.8% for AGIs $75k-100k, 107.3% for AGIs $100k-200k)
Ordinary dividends: $3,244 (reported on 12.8% of returns)
Here:
$3,244
State:
$6,972
(% of AGI for various income ranges: 14.4% for AGIs below $25k, 8.4% for AGIs $25k-50k, 108.0% for AGIs $50k-75k, 73.3% for AGIs $75k-100k, 212.7% for AGIs $100k-200k)
Net capital gain/loss in AGI: +$5,582 (reported on 13.6% of returns)
Here:
+$5,582
State:
+$20,064
(% of AGI for various income ranges: 22.4% for AGIs below $25k, 3.6% for AGIs $25k-50k, 86.0% for AGIs $50k-75k, 221.1% for AGIs $75k-100k, 505.5% for AGIs $100k-200k)
Profit/loss from business: +$16,063 (reported on 15.2% of returns)
Here:
+$16,063
State:
+$11,172
(% of AGI for various income ranges: 144.0% for AGIs below $25k, 204.8% for AGIs $25k-50k, 823.3% for AGIs $50k-75k, 859.1% for AGIs $100k-200k)
Taxable individual retirement arrangement distribution: $14,106 (reported on 13.6% of returns)
49688:
$14,106
Michigan:
$19,803
(% of AGI for various income ranges: 132.0% for AGIs below $25k, 182.8% for AGIs $25k-50k, 318.7% for AGIs $50k-75k, 384.4% for AGIs $75k-100k, 715.5% for AGIs $100k-200k)
Total itemized deductions: $28,975 (reported on 3.2% of returns)
Here:
$28,975
State:
$34,117
(% of AGI for various income ranges: 1053.6% for AGIs $100k-200k)
Charity contributions: $13,967 (reported on 2.4% of returns)
Here:
$13,967
State:
$13,548
(% of AGI for various income ranges: 465.6% for AGIs $75k-100k)
Taxes paid: $6,975 (reported on 3.2% of returns)
49688:
$6,975
State:
$7,972
(% of AGI for various income ranges: 253.6% for AGIs $100k-200k)
Earned income credit: $2,140 (reported on 12.0% of returns)
Here:
$2,140
State:
$2,251
(% of AGI for various income ranges: 59.2% for AGIs below $25k, 69.2% for AGIs $25k-50k)
Percentage of individuals using paid preparers for their 2020 taxes: 92.0%
Here:
92%
State:
93%
(% for various income ranges: 90.0% for AGIs below $25k, 93.8% for AGIs $25k-50k, 90.5% for AGIs $50k-75k, 92.3% for AGIs $75k-100k, 93.8% for AGIs $100k-200k, 100.0% for AGIs over 200k)
Averages for the 2012 tax year for zip code 49688, filed in 2013:
Average Adjusted Gross Income (AGI) in 2012: $42,562 (Individual Income Tax Returns)
Here:
$42,562
State:
$55,609
Salary/wage: $37,804 (reported on 80.3% of returns)
Here:
$37,804
State:
$46,782
(% of AGI for various income ranges: 65.6% for AGIs below $25k, 75.1% for AGIs $25k-50k, 73.8% for AGIs $50k-75k, 71.8% for AGIs $75k-100k, 69.1% for AGIs $100k-200k)
Taxable interest for individuals: $700 (reported on 31.6% of returns)
This zip code:
$700
Michigan:
$1,491
(% of AGI for various income ranges: 1.4% for AGIs below $25k, 0.4% for AGIs $25k-50k, 0.4% for AGIs $50k-75k, 0.7% for AGIs $75k-100k, 0.2% for AGIs $100k-200k)
Ordinary dividends: $1,422 (reported on 15.4% of returns)
Here:
$1,422
State:
$6,225
(% of AGI for various income ranges: 0.5% for AGIs below $25k, 0.7% for AGIs $25k-50k, 0.4% for AGIs $50k-75k, 0.3% for AGIs $75k-100k, 0.6% for AGIs $100k-200k)
Net capital gain/loss in AGI: +$2,827 (reported on 9.4% of returns)
Here:
+$2,827
State:
+$9,326
(% of AGI for various income ranges: 0.9% for AGIs $25k-50k, 1.5% for AGIs $100k-200k)
Profit/loss from business: +$9,871 (reported on 17.9% of returns)
Here:
+$9,871
State:
+$11,523
(% of AGI for various income ranges: 6.4% for AGIs below $25k, 4.6% for AGIs $25k-50k, 2.2% for AGIs $50k-75k, 11.9% for AGIs $75k-100k)
Taxable individual retirement arrangement distribution: $10,927 (reported on 12.8% of returns)
49688:
$10,927
Michigan:
$15,298
(% of AGI for various income ranges: 5.7% for AGIs below $25k, 2.5% for AGIs $25k-50k, 6.0% for AGIs $50k-75k, 2.6% for AGIs $100k-200k)
Total itemized deductions: $17,635 (21% of AGI, reported on 19.7% of returns)
Here:
$17,635
State:
$21,628
Here:
21.5% of AGI
State:
18.4% of AGI
(% of AGI for various income ranges: 5.8% for AGIs below $25k, 5.9% for AGIs $25k-50k, 6.7% for AGIs $50k-75k, 11.2% for AGIs $75k-100k, 10.2% for AGIs $100k-200k)
Charity contributions: $3,835 (reported on 14.5% of returns)
Here:
$3,835
State:
$4,225
(% of AGI for various income ranges: 1.4% for AGIs $25k-50k, 0.9% for AGIs $50k-75k, 2.0% for AGIs $75k-100k, 1.7% for AGIs $100k-200k)
Taxes paid: $5,561 (reported on 19.7% of returns)
49688:
$5,561
State:
$8,327
(% of AGI for various income ranges: 1.2% for AGIs below $25k, 1.5% for AGIs $25k-50k, 1.7% for AGIs $50k-75k, 3.3% for AGIs $75k-100k, 4.1% for AGIs $100k-200k)
Earned income credit: $2,180 (reported on 17.1% of returns)
Here:
$2,180
State:
$2,306
(% of AGI for various income ranges: 5.1% for AGIs below $25k, 1.1% for AGIs $25k-50k)
Percentage of individuals using paid preparers for their 2012 taxes: 56.4%
Here:
56%
State:
57%
(% for various income ranges: 50.9% for AGIs below $25k, 57.1% for AGIs $25k-50k, 58.8% for AGIs $50k-75k, 66.7% for AGIs $75k-100k, 70.0% for AGIs $100k-200k)
Averages for the 2004 tax year for zip code 49688, filed in 2005:
Average Adjusted Gross Income (AGI) in 2004: $34,943 (Individual Income Tax Returns)
Here:
$34,943
State:
$48,204
Salary/wage: $33,037 (reported on 81.6% of returns)
Here:
$33,037
State:
$42,791
(% of AGI for various income ranges: 113.7% for AGIs below $10k, 70.6% for AGIs $10k-25k, 78.5% for AGIs $25k-50k, 79.3% for AGIs $50k-75k, 78.5% for AGIs $75k-100k, 71.4% for AGIs over 100k)
Taxable interest for individuals: $892 (reported on 41.0% of returns)
This zip code:
$892
Michigan:
$1,725
(% of AGI for various income ranges: 4.2% for AGIs below $10k, 2.6% for AGIs $10k-25k, 1.2% for AGIs $25k-50k, 0.6% for AGIs $50k-75k, 0.7% for AGIs $75k-100k, 0.4% for AGIs over 100k)
Taxable dividends: $1,376 (reported on 18.2% of returns)
Here:
$1,376
State:
$3,420
(% of AGI for various income ranges: 2.3% for AGIs below $10k, 1.4% for AGIs $10k-25k, 1.0% for AGIs $25k-50k, 0.4% for AGIs $50k-75k, 0.3% for AGIs $75k-100k, 0.4% for AGIs over 100k)
Net capital gain/loss: +$4,690 (reported on 14.3% of returns)
Here:
+$4,690
State:
+$8,532
(% of AGI for various income ranges: -2.5% for AGIs below $10k, 1.4% for AGIs $10k-25k, 1.2% for AGIs $25k-50k, 1.6% for AGIs $50k-75k, 0.1% for AGIs $75k-100k, 5.8% for AGIs over 100k)
Profit/loss from business: +$6,156 (reported on 19.3% of returns)
Here:
+$6,156
State:
+$9,547
(% of AGI for various income ranges: 17.4% for AGIs below $10k, 4.8% for AGIs $10k-25k, 4.8% for AGIs $25k-50k, 1.3% for AGIs $50k-75k, 1.9% for AGIs $75k-100k, 2.7% for AGIs over 100k)
IRA payment deduction: $2,964 (reported on 2.3% of returns)
49688:
$2,964
Michigan:
$2,875
Total itemized deductions: $15,996 (23% of AGI, reported on 22.5% of returns)
Here:
$15,996
State:
$18,509
Here:
23.1% of AGI
State:
20.7% of AGI
(% of AGI for various income ranges: 9.0% for AGIs $10k-25k, 8.3% for AGIs $25k-50k, 11.7% for AGIs $50k-75k, 11.6% for AGIs $75k-100k, 12.5% for AGIs over 100k)
Charity contributions deductions: $2,855 (4% of AGI, reported on 17.8% of returns)
Here:
$2,855
State:
$3,365
Here:
4.0% of AGI
State:
3.6% of AGI
(% of AGI for various income ranges: 0.6% for AGIs $10k-25k, 1.3% for AGIs $25k-50k, 1.9% for AGIs $50k-75k, 1.9% for AGIs $75k-100k, 1.5% for AGIs over 100k)
Total tax: $4,532 (reported on 68.8% of returns)
49688:
$4,532
State:
$7,691
(% of AGI for various income ranges: 4.9% for AGIs below $10k, 3.7% for AGIs $10k-25k, 6.7% for AGIs $25k-50k, 7.2% for AGIs $50k-75k, 10.5% for AGIs $75k-100k, 17.2% for AGIs over 100k)
Earned income credit: $1,741 (reported on 15.8% of returns)
Here:
$1,741
State:
$1,737
Percentage of individuals using paid preparers for their 2004 taxes: 57.5%
Here:
57%
State:
60%
(% for various income ranges: 50.0% for AGIs below $10k, 57.9% for AGIs $10k-25k, 57.2% for AGIs $25k-50k, 63.4% for AGIs $50k-75k, 61.8% for AGIs $75k-100k, 75.6% for AGIs over 100k)
Likely homosexual households (counted as self-reported same-sex unmarried-partner households)
Lesbian couples: 0.4% of all households
Gay men: 0.0% of all households
Household received Food Stamps/SNAP in the past 12 months: 107 Household did not receive Food Stamps/SNAP in the past 12 months: 789
Women who had a birth in the past 12 months: 37 (20 now married, 16 unmarried) Women who did not have a birth in the past 12 months: 366 (199 now married, 165 unmarried)
Housing units in zip code 49688 with a mortgage: 394 (35 second mortgage, 10 home equity loan, 27 both second mortgage and home equity loan) Houses without a mortgage: 3
Median monthly owner costs for units with a mortgage: $1,210 Median monthly owner costs for units without a mortgage: $490
Residents with income below the poverty level in 2022:
This zip code:
20.7%
Whole state:
13.4%
Residents with income below 50% of the poverty level in 2022:
This zip code:
9.7%
Whole state:
6.9%
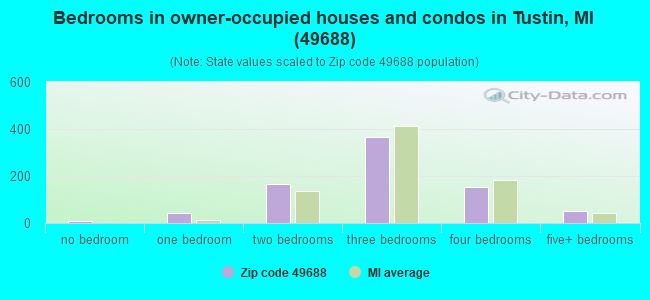
Median number of rooms in houses and condos:
Here:
6.2
State:
6.5
Median number of rooms in apartments:
Here:
4.7
State:
4.3
Notable locations in this zip code not listed on our city pages
Notable locations in zip code 49688: Kettunen Center (A), Harman School (B), Lake Olga Recreation Site (C), Sherman School (D), Noggle School (E), Nash School (F), School Number 1 (G), Tustin Rest Area (H), Cadillac Woods Campground (I), Tustin Trails Golf Course (J), Tustin Area Volunteer Fire Department (K), Tustin Community Library (L). Display/hide their locations on the map
Churches in zip code 49688 include: Augustana Lutheran Church (A), First Baptist Church (B), Covenant Presbyterian Church (C), Faith Chapel (D), Dover Regular Baptist Church (E). Display/hide their locations on the map
Cemeteries: Tustin Cemetery (1), Highland Cemetery (2), Sherman Township Cemetery (3), Burdell Township Cemetery (4). Display/hide their locations on the map
Lakes: Asplund Lake (A), Lake Olga (B), Eggle Lake (C), Noggle Lake (D), Hewitt Lake (E), Hay Lake (F), Fewlass Lake (G), Echelberger Lake (H). Display/hide their locations on the map
Streams, rivers, and creeks: Fairchild Creek (A), North Branch Pine River (B), Lake Outlet (C), Rose Edgett Creek (D), Dyer Creek (E), East Branch Pine River (F), Sprague Creek (G). Display/hide their locations on the map
Parks in zip code 49688 include: John E Larson Farm Historical Marker (1), Swedish Evangelical Lutheran Church Historical Marker (2), Unto a New Land Historical Marker (3). Display/hide their locations on the map
In group quarters: 11 (-1 institutionalized population)
Size of family households: 364 2-persons, 72 3-persons, 85 4-persons, 76 5-persons, 15 6-persons, 29 7-or-more-persons
Size of nonfamily households: 211 1-person, 31 2-persons, 10 3-persons
374 married couples with children.
103 single-parent households (41 men, 62 women).
96.2% of residents of 49688 zip code speak English at home.
0.3% of residents speak Spanish at home (100% very well).
2.1% of residents speak other Indo-European language at home (89% very well, 7% well, 4% not well).
0.6% of residents speak Asian or Pacific Island language at home (100% well).
0.6% of residents speak other language at home (79% very well, 21% well).
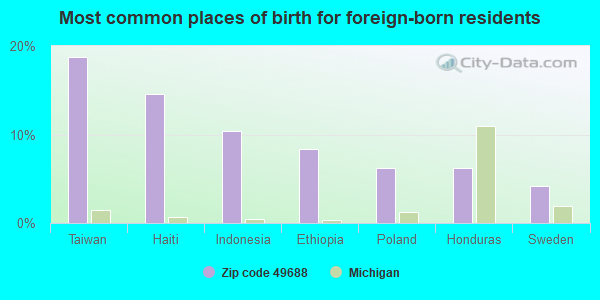
Foreign born population: 47 (2.1%) (47.1% of them are naturalized citizens)
This zip code:
2.1%
Whole state:
6.9%
19%Taiwan
15%Haiti
10%Indonesia
8%Ethiopia
6%Poland
6%Honduras
4%Sweden
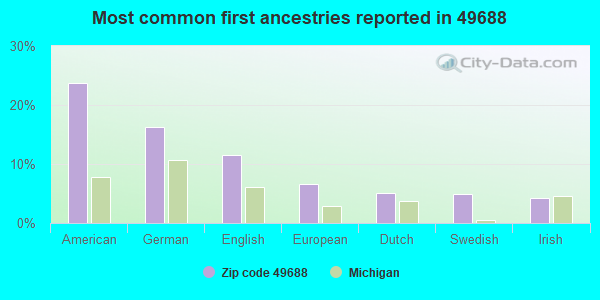
24%American
16%German
12%English
7%European
5%Dutch
5%Swedish
4%Irish
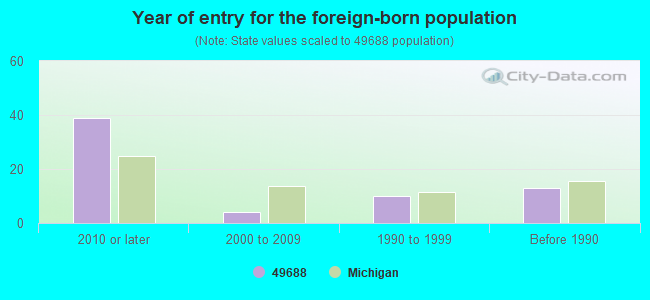
Year of entry for the foreign-born population
392010 or later
42000 to 2009
101990 to 1999
13Before 1990
Major facilities with environmental interests located in this zip code:
MI DEPT/TRANSPORTATION BRIDGE (US-131 UNDER MARION RD in TUSTIN, MI)
(Resource Conservation and Recovery Act (tracking hazardous waste)) Organizations: MICH DEPT OF TRANSPORTATION (CONTACT/OPERATOR)
Alternative names: MIDOT BRIDGE US-131 UNDER MARION RD
DIGHTON STORE (8075 N 130TH AVENUE in TUSTIN, MI)
(Resource Conservation and Recovery Act (tracking hazardous waste))
MI DEPT/TRANSPORTATION BRIDGE (LEROY TWP in TUSTIN, MI)
Conditionally Exempt Small Quantity Generators, less than 100 kg/month of hazardous waste (Resource Conservation and Recovery Act (tracking hazardous waste)) Organizations: MICH DEPT OF TRANSPORTATION (CONTACT/OPERATOR)
Housing units lacking complete plumbing facilities: 6.3% Housing units lacking complete kitchen facilities: 5.5%
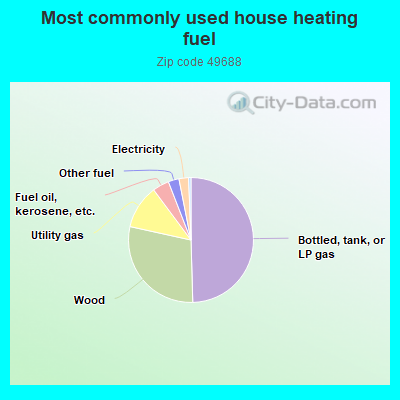
49.7%Bottled, tank, or LP gas
29.0%Wood
11.4%Utility gas
4.3%Fuel oil, kerosene, etc.
2.8%Other fuel
2.5%Electricity
0.6%No fuel used
Population in 1990: 1,213. Population change in the 1990s: +1,389 (+114.5%).
Place of birth for U.S.-born residents:
This state: 1,894
Northeast: 12
Midwest: 194
South: 106
West: 48
65% of the 49688 zip code residents lived in the same house 5 years ago. Out of people who lived in different houses, 33% lived in this county. Out of people who lived in different counties, 50% lived in Michigan.
92% of the 49688 zip code residents lived in the same house 1 year ago. Out of people who lived in different houses, 66% moved from this county. Out of people who lived in different houses, 15% moved from different county within same state. Out of people who lived in different houses, 8% moved from different state. Out of people who lived in different houses, 11% moved from abroad.
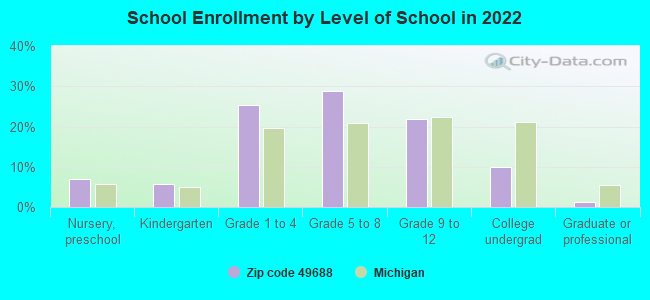
Private vs. public school enrollment:
Students in private schools in grades 1 to 8 (elementary and middle school): 59
Here:
22.0%
Michigan:
12.4%
Students in private schools in grades 9 to 12 (high school): 11
Here:
10.5%
Michigan:
9.8%
Students in private undergraduate colleges: 22
Here:
46.0%
Michigan:
14.9%
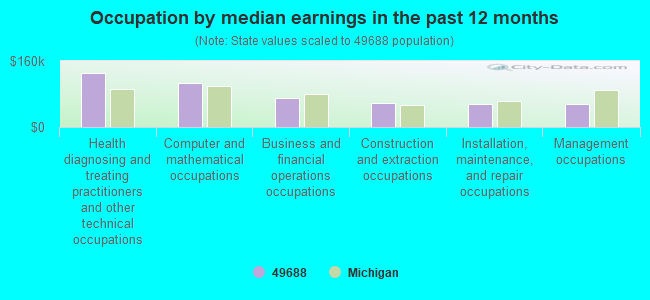
Occupation by median earnings in the past 12 months ($)
130,795Health diagnosing and treating practitioners and other technical occupations
105,594Computer and mathematical occupations
70,171Business and financial operations occupations
59,179Construction and extraction occupations
56,124Installation, maintenance, and repair occupations
56,054Management occupations
Top industries in this zip code by the number of employees in 2005:
Information: Television Broadcasting (100-249 employees: 1 establishment)
Accommodation and Food Services: Rooming and Boarding Houses (20-49: 1)
Accommodation and Food Services: Full-Service Restaurants (10-19: 1)
Finance and Insurance: Credit Unions (10-19: 1)
Wholesale Trade: Farm and Garden Machinery and Equipment Merchant Wholesalers (10-19: 1)
Construction: Drywall and Insulation Contractors (5-9: 1)
People in group quarters in 2010:
19 people in group homes intended for adults
4 people in correctional residential facilities
People in group quarters in 2000:
12 people in other group homes
2 people in other noninstitutional group quarters
Fatal accident statistics in 2014:
Fatal accident count: 1
Vehicles involved in fatal accidents: 2
Fatal accidents caused by drunken drivers: 0
Fatalities: 1
Persons involved in fatal accidents: 4
Pedestrians involved in fatal accidents: 0
Fatal accident statistics in 2013:
Fatal accident count: 2
Vehicles involved in fatal accidents: 3
Fatal accidents caused by drunken drivers: 2
Fatalities: 2
Persons involved in fatal accidents: 8
Pedestrians involved in fatal accidents: 0
2002 - 2018 National Fire Incident Reporting System (NFIRS) incidents
According to the data from the years 2002 - 2018 the average number of fires per year is 18. The highest number of reported fire incidents - 32 took place in 2003, and the least - 1 in 2013. The data has a growing trend.
When looking into fire subcategories, the most incidents belonged to: Outside Fires (40.3%), and Structure Fires (38.3%).
Fire incident types reported to NFIRS in Zip Code 49688

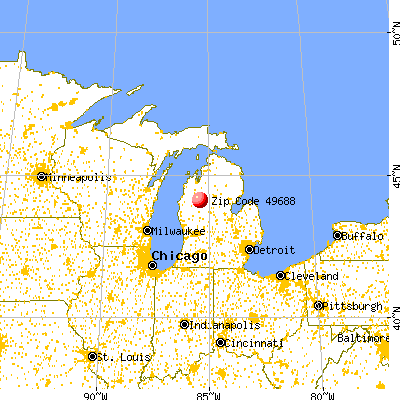


 Nearest zip codes: 49655, 49601, 49618, 49677, 49656, 49639.


 According to the data from the years 2002 - 2018 the average number of fires per year is 18. The highest number of reported fire incidents - 32 took place in 2003, and the least - 1 in 2013. The data has a growing trend.
 When looking into fire subcategories, the most incidents belonged to: Outside Fires (40.3%), and Structure Fires (38.3%).