Estimated zip code population in 2022: 4,098 Zip code population in 2010: 4,413 Zip code population in 2000: 4,245
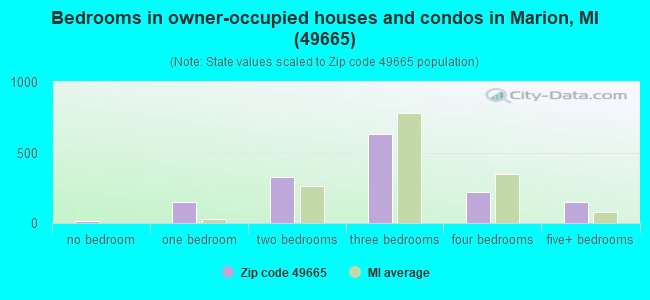
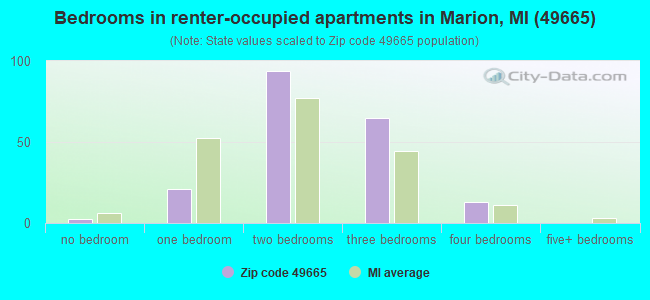
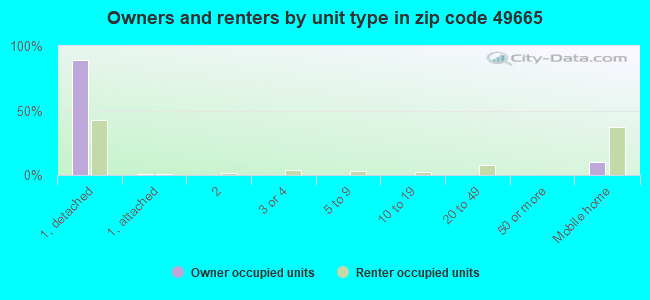
Houses and condos: 2,248 Renter-occupied apartments: 196
% of renters here:
12%
State:
27%
March 2022 cost of living index in zip code 49665: 80.9 (low, U.S. average is 100)
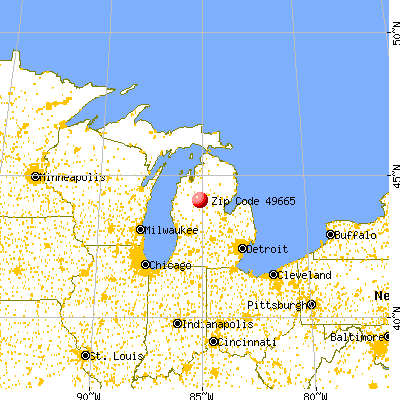
Land area: 157.1 sq. mi. Water area: 1.0 sq. mi.
Population density: 26 people per square mile
(very low).
OSM Map
General Map
Google Map
MSN Map
OSM Map
General Map
Google Map
MSN Map
OSM Map
General Map
Google Map
MSN Map
OSM Map
General Map
Google Map
MSN Map
Please wait while loading the map...
Real estate property taxes paid for housing units in 2022:
This zip code:
0.9% ($1,381)
Michigan:
1.2% ($2,746)
Median real estate property taxes paid for housing units with mortgages in 2022: $1,618 (0.9%) Median real estate property taxes paid for housing units with no mortgage in 2022: $1,200 (1.0%)
Business Search- 14 Million verified businesses
Males: 2,095
(51.1%)
Females: 2,002
(48.9%)
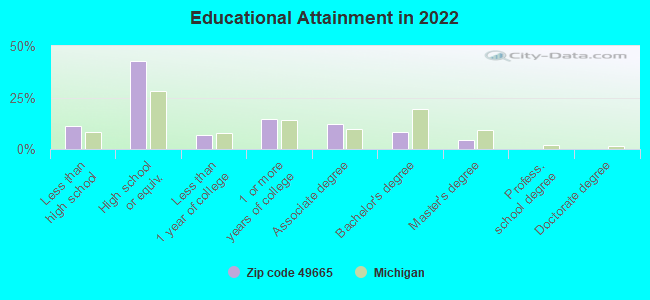
For population 25 years and over in 49665:
High school or higher: 87.6%
Bachelor's degree or higher: 12.8%
Graduate or professional degree: 4.7%
Unemployed: 4.3%
Mean travel time to work (commute): 26.0 minutes
For population 15 years and over in 49665:
Never married: 25.1%
Now married: 53.8%
Separated: 1.2%
Widowed: 4.9%
Divorced: 15.0%
Zip code 49665 compared to state average:
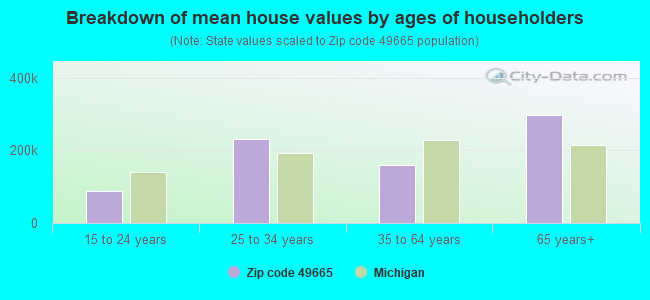
Median house value below state average.
Black race population percentage significantly below state average.
Hispanic race population percentage below state average.
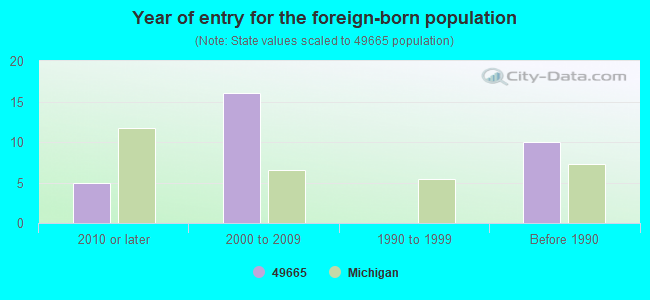
Foreign-born population percentage significantly below state average.
Renting percentage significantly below state average.
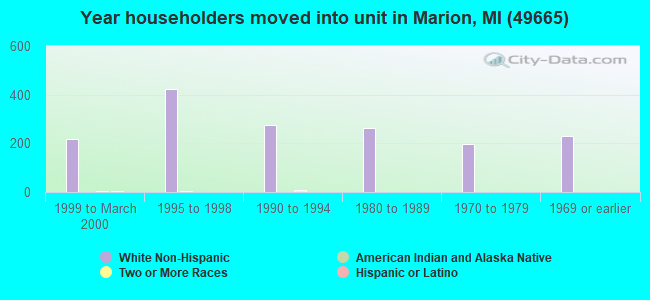
Length of stay since moving in above state average.
Number of college students significantly below state average.
Percentage of population with a bachelor's degree or higher significantly below state average.
Averages for the 2020 tax year for zip code 49665, filed in 2021:
Average Adjusted Gross Income (AGI) in 2020: $45,532 (Individual Income Tax Returns)
Here:
$45,532
State:
$68,945
Salary/wage: $38,373 (reported on 77.7% of returns)
Here:
$38,373
State:
$57,142
(% of AGI for various income ranges: 981.8% for AGIs below $25k, 3114.1% for AGIs $25k-50k, 5857.6% for AGIs $50k-75k, 9195.0% for AGIs $75k-100k, 15918.0% for AGIs $100k-200k)
Taxable interest for individuals: $840 (reported on 22.3% of returns)
This zip code:
$840
Michigan:
$1,630
(% of AGI for various income ranges: 17.4% for AGIs below $25k, 15.7% for AGIs $25k-50k, 39.5% for AGIs $50k-75k, 66.0% for AGIs $75k-100k, 48.0% for AGIs $100k-200k)
Ordinary dividends: $1,880 (reported on 10.6% of returns)
Here:
$1,880
State:
$6,972
(% of AGI for various income ranges: 17.2% for AGIs below $25k, 15.7% for AGIs $25k-50k, 34.3% for AGIs $50k-75k, 63.0% for AGIs $75k-100k, 86.0% for AGIs $100k-200k)
Net capital gain/loss in AGI: +$8,967 (reported on 11.2% of returns)
Here:
+$8,967
State:
+$20,064
(% of AGI for various income ranges: 15.0% for AGIs below $25k, 31.6% for AGIs $25k-50k, 218.6% for AGIs $50k-75k, 400.0% for AGIs $75k-100k, 810.0% for AGIs $100k-200k)
Profit/loss from business: +$9,787 (reported on 12.2% of returns)
Here:
+$9,787
State:
+$11,172
(% of AGI for various income ranges: 63.6% for AGIs below $25k, 116.8% for AGIs $25k-50k, 100.0% for AGIs $50k-75k, 307.0% for AGIs $75k-100k, 902.0% for AGIs $100k-200k)
Taxable individual retirement arrangement distribution: $11,950 (reported on 8.5% of returns)
49665:
$11,950
Michigan:
$19,803
(% of AGI for various income ranges: 86.2% for AGIs below $25k, 84.5% for AGIs $25k-50k, 321.4% for AGIs $50k-75k, 434.0% for AGIs $100k-200k)
Total itemized deductions: $31,550 (reported on 1.1% of returns)
Here:
$31,550
State:
$34,117
(% of AGI for various income ranges: 143.4% for AGIs $25k-50k)
Earned income credit: $2,303 (reported on 18.1% of returns)
Here:
$2,303
State:
$2,251
(% of AGI for various income ranges: 85.0% for AGIs below $25k, 81.4% for AGIs $25k-50k)
Percentage of individuals using paid preparers for their 2020 taxes: 93.1%
Here:
93%
State:
93%
(% for various income ranges: 94.3% for AGIs below $25k, 92.7% for AGIs $25k-50k, 93.1% for AGIs $50k-75k, 87.5% for AGIs $75k-100k, 94.4% for AGIs $100k-200k)
Averages for the 2012 tax year for zip code 49665, filed in 2013:
Average Adjusted Gross Income (AGI) in 2012: $35,483 (Individual Income Tax Returns)
Here:
$35,483
State:
$55,609
Salary/wage: $30,761 (reported on 79.7% of returns)
Here:
$30,761
State:
$46,782
(% of AGI for various income ranges: 66.4% for AGIs below $25k, 71.6% for AGIs $25k-50k, 77.4% for AGIs $50k-75k, 69.3% for AGIs $75k-100k, 57.4% for AGIs $100k-200k)
Taxable interest for individuals: $846 (reported on 27.9% of returns)
This zip code:
$846
Michigan:
$1,491
(% of AGI for various income ranges: 1.1% for AGIs below $25k, 0.6% for AGIs $25k-50k, 0.5% for AGIs $50k-75k, 0.8% for AGIs $75k-100k, 0.5% for AGIs $100k-200k)
Ordinary dividends: $1,350 (reported on 11.6% of returns)
Here:
$1,350
State:
$6,225
(% of AGI for various income ranges: 0.8% for AGIs below $25k, 0.5% for AGIs $25k-50k, 0.2% for AGIs $50k-75k, 0.4% for AGIs $75k-100k, 0.3% for AGIs $100k-200k)
Net capital gain/loss in AGI: +$7,976 (reported on 9.9% of returns)
Here:
+$7,976
State:
+$9,326
(% of AGI for various income ranges: 1.1% for AGIs below $25k, 2.6% for AGIs $25k-50k, 1.3% for AGIs $50k-75k, 3.5% for AGIs $75k-100k, 2.8% for AGIs $100k-200k)
Profit/loss from business: +$6,383 (reported on 14.0% of returns)
Here:
+$6,383
State:
+$11,523
(% of AGI for various income ranges: 5.4% for AGIs below $25k, 2.3% for AGIs $25k-50k, 2.1% for AGIs $50k-75k, 2.6% for AGIs $100k-200k)
Taxable individual retirement arrangement distribution: $10,668 (reported on 11.0% of returns)
49665:
$10,668
Michigan:
$15,298
(% of AGI for various income ranges: 5.0% for AGIs below $25k, 3.1% for AGIs $25k-50k, 2.6% for AGIs $50k-75k, 8.0% for AGIs $75k-100k)
Total itemized deductions: $17,344 (24% of AGI, reported on 14.5% of returns)
Here:
$17,344
State:
$21,628
Here:
23.8% of AGI
State:
18.4% of AGI
(% of AGI for various income ranges: 6.0% for AGIs below $25k, 5.3% for AGIs $25k-50k, 7.7% for AGIs $50k-75k, 6.8% for AGIs $75k-100k, 9.9% for AGIs $100k-200k)
Charity contributions: $3,100 (reported on 9.9% of returns)
Here:
$3,100
State:
$4,225
(% of AGI for various income ranges: 0.6% for AGIs $25k-50k, 1.0% for AGIs $50k-75k, 0.7% for AGIs $75k-100k, 1.7% for AGIs $100k-200k)
Taxes paid: $4,854 (reported on 14.0% of returns)
49665:
$4,854
State:
$8,327
(% of AGI for various income ranges: 0.8% for AGIs below $25k, 1.0% for AGIs $25k-50k, 2.0% for AGIs $50k-75k, 2.1% for AGIs $75k-100k, 3.8% for AGIs $100k-200k)
Earned income credit: $2,290 (reported on 23.3% of returns)
Here:
$2,290
State:
$2,306
(% of AGI for various income ranges: 7.2% for AGIs below $25k, 1.4% for AGIs $25k-50k)
Percentage of individuals using paid preparers for their 2012 taxes: 59.9%
Here:
60%
State:
57%
(% for various income ranges: 54.8% for AGIs below $25k, 60.9% for AGIs $25k-50k, 66.7% for AGIs $50k-75k, 70.0% for AGIs $75k-100k, 75.0% for AGIs $100k-200k)
Averages for the 2004 tax year for zip code 49665, filed in 2005:
Average Adjusted Gross Income (AGI) in 2004: $28,285 (Individual Income Tax Returns)
Here:
$28,285
State:
$48,204
Salary/wage: $25,990 (reported on 82.4% of returns)
Here:
$25,990
State:
$42,791
(% of AGI for various income ranges: 104.2% for AGIs below $10k, 66.0% for AGIs $10k-25k, 74.1% for AGIs $25k-50k, 83.8% for AGIs $50k-75k, 80.8% for AGIs $75k-100k, 55.1% for AGIs over 100k)
Taxable interest for individuals: $1,333 (reported on 37.8% of returns)
This zip code:
$1,333
Michigan:
$1,725
(% of AGI for various income ranges: 5.9% for AGIs below $10k, 2.1% for AGIs $10k-25k, 1.7% for AGIs $25k-50k, 1.8% for AGIs $50k-75k, 1.0% for AGIs $75k-100k, 0.7% for AGIs over 100k)
Taxable dividends: $985 (reported on 14.1% of returns)
Here:
$985
State:
$3,420
(% of AGI for various income ranges: 3.4% for AGIs below $10k, 0.5% for AGIs $10k-25k, 0.5% for AGIs $25k-50k, 0.2% for AGIs $50k-75k, 0.5% for AGIs $75k-100k, 0.2% for AGIs over 100k)
Net capital gain/loss: +$5,345 (reported on 12.3% of returns)
Here:
+$5,345
State:
+$8,532
(% of AGI for various income ranges: 4.0% for AGIs below $10k, 1.1% for AGIs $10k-25k, 2.4% for AGIs $25k-50k, 2.6% for AGIs $50k-75k, 2.6% for AGIs $75k-100k, 2.5% for AGIs over 100k)
Profit/loss from business: +$3,866 (reported on 17.0% of returns)
Here:
+$3,866
State:
+$9,547
(% of AGI for various income ranges: 10.5% for AGIs below $10k, 4.7% for AGIs $10k-25k, 3.2% for AGIs $25k-50k, 0.8% for AGIs $50k-75k, -1.1% for AGIs $75k-100k)
IRA payment deduction: $2,851 (reported on 2.6% of returns)
49665:
$2,851
Michigan:
$2,875
Total itemized deductions: $14,187 (28% of AGI, reported on 18.0% of returns)
Here:
$14,187
State:
$18,509
Here:
28.1% of AGI
State:
20.7% of AGI
(% of AGI for various income ranges: 11.2% for AGIs below $10k, 6.8% for AGIs $10k-25k, 8.2% for AGIs $25k-50k, 8.4% for AGIs $50k-75k, 11.8% for AGIs $75k-100k, 15.2% for AGIs over 100k)
Charity contributions deductions: $2,648 (5% of AGI, reported on 13.7% of returns)
Here:
$2,648
State:
$3,365
Here:
5.0% of AGI
State:
3.6% of AGI
(% of AGI for various income ranges: 0.6% for AGIs below $10k, 0.5% for AGIs $10k-25k, 1.1% for AGIs $25k-50k, 1.1% for AGIs $50k-75k, 1.9% for AGIs $75k-100k, 4.0% for AGIs over 100k)
Total tax: $2,881 (reported on 66.3% of returns)
49665:
$2,881
State:
$7,691
(% of AGI for various income ranges: 3.1% for AGIs below $10k, 3.8% for AGIs $10k-25k, 5.7% for AGIs $25k-50k, 7.5% for AGIs $50k-75k, 9.3% for AGIs $75k-100k, 14.1% for AGIs over 100k)
Earned income credit: $1,626 (reported on 19.6% of returns)
Here:
$1,626
State:
$1,737
Percentage of individuals using paid preparers for their 2004 taxes: 60.8%
Here:
61%
State:
60%
(% for various income ranges: 54.2% for AGIs below $10k, 58.0% for AGIs $10k-25k, 64.3% for AGIs $25k-50k, 67.0% for AGIs $50k-75k, 74.0% for AGIs $75k-100k, 80.8% for AGIs over 100k)
Household received Food Stamps/SNAP in the past 12 months: 259 Household did not receive Food Stamps/SNAP in the past 12 months: 1,416
Women who had a birth in the past 12 months: 89 (77 now married, 13 unmarried) Women who did not have a birth in the past 12 months: 674 (288 now married, 385 unmarried)
Housing units in zip code 49665 with a mortgage: 717 (24 second mortgage, 19 both second mortgage and home equity loan) Houses without a mortgage: 6
Median monthly owner costs for units with a mortgage: $1,099 Median monthly owner costs for units without a mortgage: $400
Residents with income below the poverty level in 2022:
This zip code:
19.1%
Whole state:
13.4%
Residents with income below 50% of the poverty level in 2022:
This zip code:
13.2%
Whole state:
6.9%
Median number of rooms in houses and condos:
Here:
5.7
State:
6.5
Median number of rooms in apartments:
Here:
4.5
State:
4.3
Notable locations in this zip code not listed on our city pages
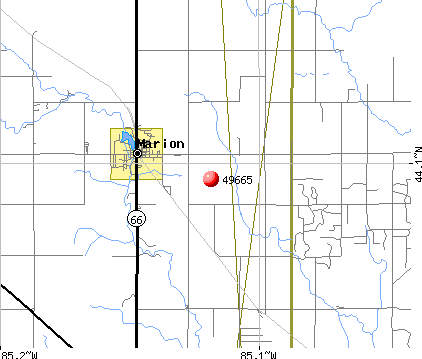
Notable locations in zip code 49665: Pennock Station (A), Old Log Resort and Campground (B), Marion Station (C), Marion Fairgrounds (D), Park Lake Station (E), Marion Community Fire Department (F), Redding Township Hall (G), Marion Public Libary (H), Marion Area Historical Museum (I). Display/hide their locations on the map
Churches in zip code 49665 include: Pisgah Heights Wesleyan Church (A), Community of Christ Church (B), Bible Missionary Church (C), Marion Seventh Day Adventist Church (D), Marion United Methodist Church (E), Saint Agnes Church (F), Middle Branch Church (G), Marion Baptist Church (H), Marion Full Gospel Church (I). Display/hide their locations on the map
Cemeteries: Vogel Center Cemetery (1), Watson Road Cemetery (2), Greenwood Cemetery (3), Methodist Episcopal Church Cemetery (4), Park Lake Cemetery (5), Middle Branch Township Cemetery (6), Hillside Cemetery (7). Display/hide their locations on the map
Rivers and creeks: Franz Creek (A), Giss-I-Was Creek (B), Beebe Creek (C), Grindstone Creek (D), Appleby Creek (E), Clam River (F), Cranberry Creek (G), Middle Branch Creek (H), Middle Branch River (I). Display/hide their locations on the map
Parks in zip code 49665 include: Founding of Marion Historical Marker (1), Marion Millpond and Dam Historical Marker (2). Display/hide their locations on the map
523 married couples with children.
300 single-parent households (128 men, 172 women).
93.4% of residents of 49665 zip code speak English at home.
0.6% of residents speak Spanish at home (78% very well, 22% well).
5.6% of residents speak other Indo-European language at home (72% very well, 28% well).
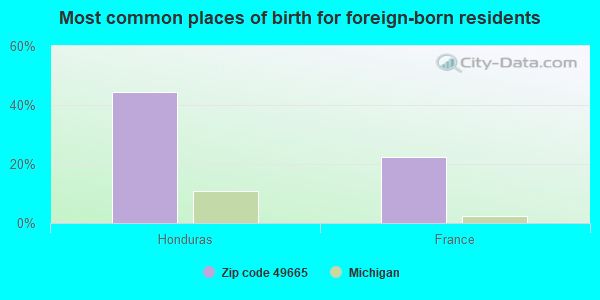
Foreign born population: 9 (0.2%) (56.8% of them are naturalized citizens)
This zip code:
0.2%
Whole state:
6.9%
44%Honduras
22%France
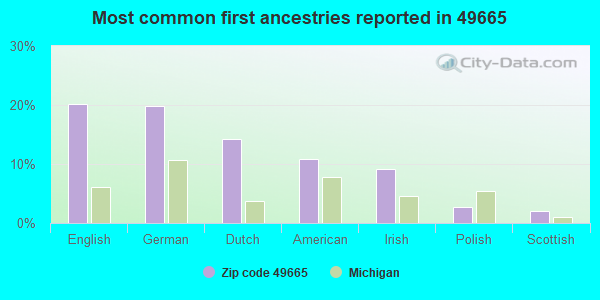
20%English
20%German
14%Dutch
11%American
9%Irish
3%Polish
2%Scottish
Year of entry for the foreign-born population
52010 or later
162000 to 2009
01990 to 1999
10Before 1990
Facilities with environmental interests located in this zip code:
MI DEPT/TRANSPORTATION BRIDGE (M-115 OVER MIDDLE BRANCH RIVER in MARION, MI)
(Resource Conservation and Recovery Act (tracking hazardous waste)) Organizations: MICH DEPT OF TRANSPORTATION (CONTACT/OPERATOR)
Alternative names: MIDOT BRIDGE M-115 OVER MIDDLE BRANCH
MI DEPT/NATURAL RESOURCES (M-66 OVER MUSKEGON RIVER in MARION, MI)
(Resource Conservation and Recovery Act (tracking hazardous waste)) Alternative names: MIDNR M-66 OVER MUSKEGON RIVER
MI DEPT/TRANSPORTATION BRIDGE B01-67062 (M-61 OVER MID BR MUSKEGON RIVE in MARION, MI)
Conditionally Exempt Small Quantity Generators, less than 100 kg/month of hazardous waste (Resource Conservation and Recovery Act (tracking hazardous waste)) Organizations: MICH DEPT OF TRANSPORTATION (CONTACT/OPERATOR)
MI DEPT/TRANSPORTATION BRIDGE B04-67032 (M-66 OVER MIDDLE BRANCH RIVER in MARION, MI)
Conditionally Exempt Small Quantity Generators, less than 100 kg/month of hazardous waste (Resource Conservation and Recovery Act (tracking hazardous waste)) Organizations: MICH DEPT OF TRANSPORTATION (CONTACT/OPERATOR)
Housing units lacking complete plumbing facilities: 6.1% Housing units lacking complete kitchen facilities: 5.2%
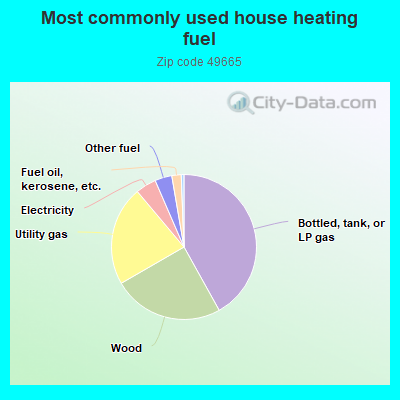
41.9%Bottled, tank, or LP gas
24.7%Wood
22.2%Utility gas
4.6%Electricity
3.8%Other fuel
2.1%Fuel oil, kerosene, etc.
0.6%No fuel used
Population in 1990: 5,710.
Place of birth for U.S.-born residents:
This state: 3,537
Northeast: 90
Midwest: 234
South: 126
West: 74
61% of the 49665 zip code residents lived in the same house 5 years ago. Out of people who lived in different houses, 44% lived in this county. Out of people who lived in different counties, 50% lived in Michigan.
93% of the 49665 zip code residents lived in the same house 1 year ago. Out of people who lived in different houses, 31% moved from this county. Out of people who lived in different houses, 44% moved from different county within same state. Out of people who lived in different houses, 29% moved from different state.
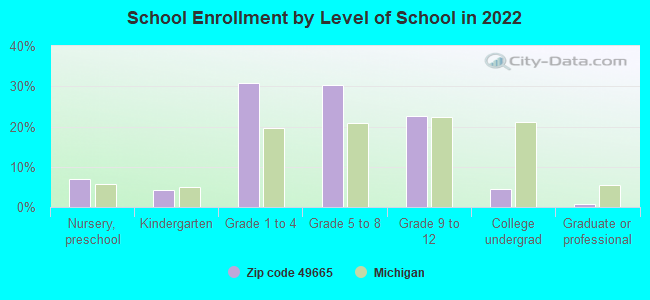
Private vs. public school enrollment:
Students in private schools in grades 1 to 8 (elementary and middle school): 69
Here:
15.6%
Michigan:
12.4%
Students in private schools in grades 9 to 12 (high school): 10
Here:
6.3%
Michigan:
9.8%
Students in private undergraduate colleges: 7
Here:
22.1%
Michigan:
14.9%
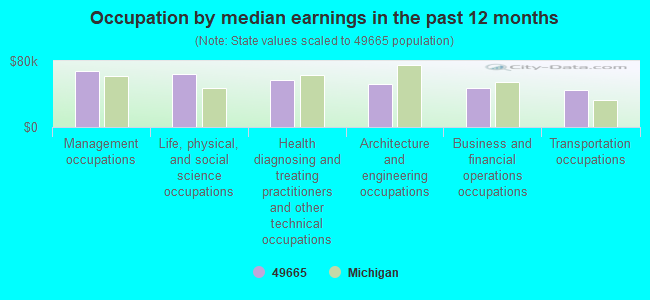
Occupation by median earnings in the past 12 months ($)
68,443Management occupations
64,099Life, physical, and social science occupations
57,038Health diagnosing and treating practitioners and other technical occupations
52,615Architecture and engineering occupations
47,184Business and financial operations occupations
45,298Transportation occupations
Top industries in this zip code by the number of employees in 2005:
Utilities: Electric Power Distribution (20-49 employees: 1 establishment, 10-19 employees: 1 establishment)
Accommodation and Food Services: Full-Service Restaurants (5-9: 4)
Other Services (except Public Administration): Religious Organizations (10-19: 1, 5-9: 1, 1-4: 2)
Construction: Electrical Contractors (10-19: 1)
Construction: Commercial and Institutional Building Construction (5-9: 2)
Finance and Insurance: Insurance Agencies and Brokerages (5-9: 1, 1-4: 1)
People in group quarters in 2010:
14 people in group homes intended for adults
7 people in workers' group living quarters and job corps centers
People in group quarters in 2000:
8 people in other group homes
5 people in homes for the mentally retarded
Fatal accident statistics in 2014:
Fatal accident count: 1
Vehicles involved in fatal accidents: 1
Fatal accidents caused by drunken drivers: 1
Fatalities: 1
Persons involved in fatal accidents: 3
Pedestrians involved in fatal accidents: 0
Fatal accident statistics in 2013:
Fatal accident count: 1
Vehicles involved in fatal accidents: 1
Fatal accidents caused by drunken drivers: 0
Fatalities: 1
Persons involved in fatal accidents: 4
Pedestrians involved in fatal accidents: 0
2002 - 2018 National Fire Incident Reporting System (NFIRS) incidents
According to the data from the years 2002 - 2018 the average number of fires per year is 21. The highest number of reported fire incidents - 37 took place in 2003, and the least - 7 in 2013. The data has a constant trend.
When looking into fire subcategories, the most reports belonged to: Structure Fires (42.0%), and Outside Fires (41.7%).
Fire incident types reported to NFIRS in Zip Code 49665


 Nearest zip codes: 49657, 49632, 49679, 49631, 48633, 48632.


 According to the data from the years 2002 - 2018 the average number of fires per year is 21. The highest number of reported fire incidents - 37 took place in 2003, and the least - 7 in 2013. The data has a constant trend.
 When looking into fire subcategories, the most reports belonged to: Structure Fires (42.0%), and Outside Fires (41.7%).