Estimated zip code population in 2022: 6,130 Zip code population in 2010: 6,420 Zip code population in 2000: 6,685
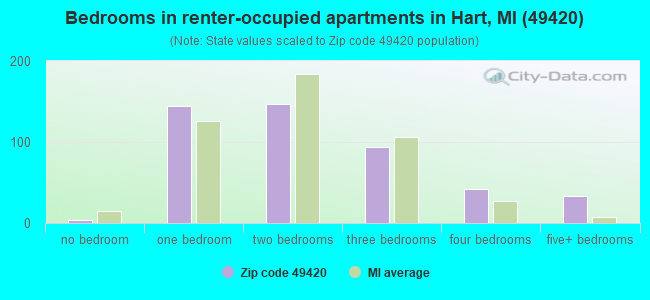
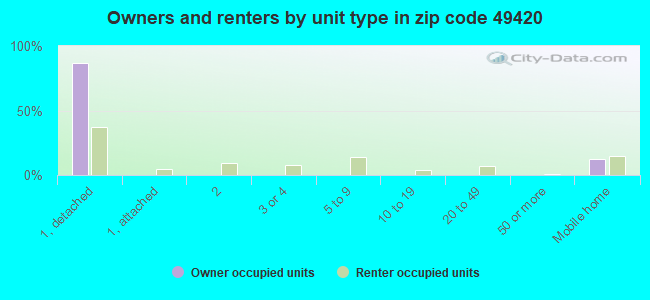
Houses and condos: 2,916 Renter-occupied apartments: 458
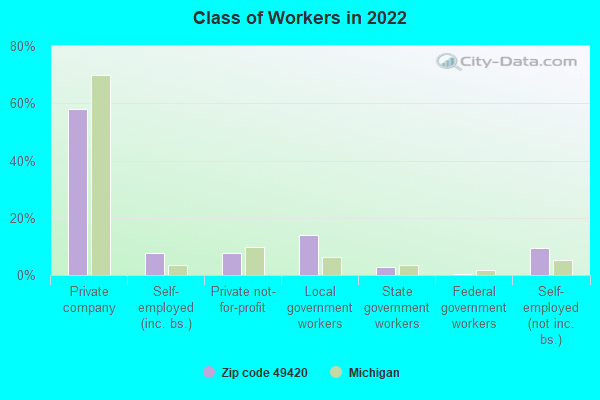
% of renters here:
19%
State:
27%
March 2022 cost of living index in zip code 49420: 81.0 (low, U.S. average is 100)
Land area: 112.0 sq. mi. Water area: 7.0 sq. mi.
Population density: 55 people per square mile
(very low).
OSM Map
General Map
Google Map
MSN Map
OSM Map
General Map
Google Map
MSN Map
OSM Map
General Map
Google Map
MSN Map
OSM Map
General Map
Google Map
MSN Map
Please wait while loading the map...
Real estate property taxes paid for housing units in 2022:
This zip code:
1.2% ($1,846)
Michigan:
1.2% ($2,746)
Median real estate property taxes paid for housing units with mortgages in 2022: $2,113 (1.3%) Median real estate property taxes paid for housing units with no mortgage in 2022: $1,542 (1.0%)
Business Search- 14 Million verified businesses
Males: 3,240
(52.9%)
Females: 2,889
(47.1%)
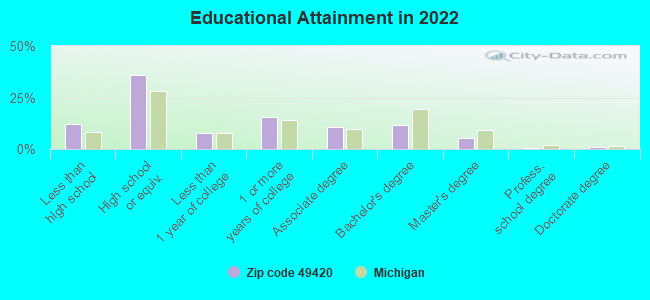
For population 25 years and over in 49420:
High school or higher: 86.9%
Bachelor's degree or higher: 17.7%
Graduate or professional degree: 6.4%
Unemployed: 2.6%
Mean travel time to work (commute): 18.3 minutes
For population 15 years and over in 49420:
Never married: 28.8%
Now married: 51.8%
Separated: 1.1%
Widowed: 5.7%
Divorced: 12.5%
Zip code 49420 compared to state average:
Unemployed percentage below state average.
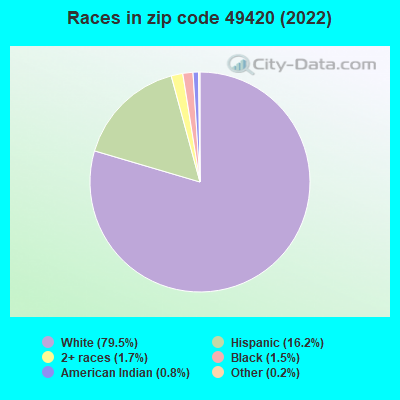
Black race population percentage significantly below state average.
Hispanic race population percentage significantly above state average.
Median age above state average.
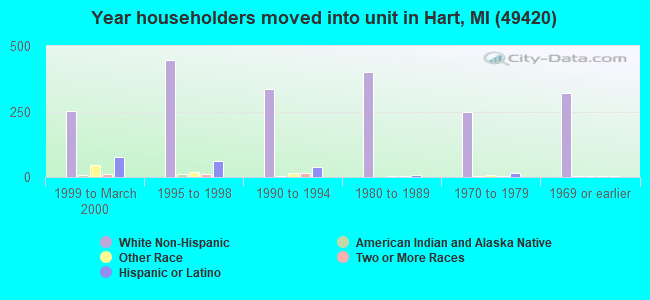
Length of stay since moving in significantly above state average.
Number of college students below state average.
Percentage of population with a bachelor's degree or higher below state average.
Averages for the 2020 tax year for zip code 49420, filed in 2021:
Average Adjusted Gross Income (AGI) in 2020: $48,659 (Individual Income Tax Returns)
Here:
$48,659
State:
$68,945
Salary/wage: $38,191 (reported on 80.6% of returns)
Here:
$38,191
State:
$57,142
(% of AGI for various income ranges: 1107.4% for AGIs below $25k, 3645.2% for AGIs $25k-50k, 6267.7% for AGIs $50k-75k, 9030.6% for AGIs $75k-100k, 15973.6% for AGIs $100k-200k)
Taxable interest for individuals: $1,048 (reported on 24.7% of returns)
This zip code:
$1,048
Michigan:
$1,630
(% of AGI for various income ranges: 13.2% for AGIs below $25k, 24.8% for AGIs $25k-50k, 31.3% for AGIs $50k-75k, 93.5% for AGIs $75k-100k, 122.1% for AGIs $100k-200k)
Ordinary dividends: $4,157 (reported on 12.2% of returns)
Here:
$4,157
State:
$6,972
(% of AGI for various income ranges: 19.4% for AGIs below $25k, 36.2% for AGIs $25k-50k, 84.8% for AGIs $50k-75k, 115.9% for AGIs $75k-100k, 255.7% for AGIs $100k-200k)
Net capital gain/loss in AGI: +$12,353 (reported on 11.2% of returns)
Here:
+$12,353
State:
+$20,064
(% of AGI for various income ranges: 3.4% for AGIs below $25k, 36.2% for AGIs $25k-50k, 118.7% for AGIs $50k-75k, 107.1% for AGIs $75k-100k, 913.6% for AGIs $100k-200k)
Profit/loss from business: +$10,034 (reported on 11.5% of returns)
Here:
+$10,034
State:
+$11,172
(% of AGI for various income ranges: 60.5% for AGIs below $25k, 121.3% for AGIs $25k-50k, 214.2% for AGIs $50k-75k, 254.7% for AGIs $75k-100k, 850.7% for AGIs $100k-200k)
Taxable individual retirement arrangement distribution: $12,314 (reported on 9.2% of returns)
49420:
$12,314
Michigan:
$19,803
(% of AGI for various income ranges: 83.1% for AGIs below $25k, 88.0% for AGIs $25k-50k, 191.0% for AGIs $50k-75k, 290.0% for AGIs $75k-100k, 829.3% for AGIs $100k-200k)
Total itemized deductions: $38,071 (reported on 2.3% of returns)
Here:
$38,071
State:
$34,117
(% of AGI for various income ranges: 197.9% for AGIs $25k-50k, 1041.4% for AGIs $100k-200k)
Charity contributions: $11,200 (reported on 1.6% of returns)
Here:
$11,200
State:
$13,548
(% of AGI for various income ranges: 400.0% for AGIs $100k-200k)
Taxes paid: $6,986 (reported on 2.3% of returns)
49420:
$6,986
State:
$7,972
(% of AGI for various income ranges: 26.6% for AGIs $25k-50k, 233.6% for AGIs $100k-200k)
Earned income credit: $2,159 (reported on 19.1% of returns)
Here:
$2,159
State:
$2,251
(% of AGI for various income ranges: 84.0% for AGIs below $25k, 95.1% for AGIs $25k-50k)
Percentage of individuals using paid preparers for their 2020 taxes: 93.8%
Here:
94%
State:
93%
(% for various income ranges: 94.3% for AGIs below $25k, 92.7% for AGIs $25k-50k, 93.3% for AGIs $50k-75k, 95.8% for AGIs $75k-100k, 92.0% for AGIs $100k-200k, 100.0% for AGIs over 200k)
Averages for the 2012 tax year for zip code 49420, filed in 2013:
Average Adjusted Gross Income (AGI) in 2012: $38,057 (Individual Income Tax Returns)
Here:
$38,057
State:
$55,609
Salary/wage: $29,871 (reported on 83.3% of returns)
Here:
$29,871
State:
$46,782
(% of AGI for various income ranges: 71.1% for AGIs below $25k, 76.2% for AGIs $25k-50k, 74.4% for AGIs $50k-75k, 69.6% for AGIs $75k-100k, 63.3% for AGIs $100k-200k, 23.0% for AGIs over 200k)
Taxable interest for individuals: $1,380 (reported on 25.8% of returns)
This zip code:
$1,380
Michigan:
$1,491
(% of AGI for various income ranges: 1.4% for AGIs below $25k, 0.8% for AGIs $25k-50k, 0.6% for AGIs $50k-75k, 0.5% for AGIs $75k-100k, 1.5% for AGIs $100k-200k, 0.9% for AGIs over 200k)
Ordinary dividends: $3,368 (reported on 13.5% of returns)
Here:
$3,368
State:
$6,225
(% of AGI for various income ranges: 1.0% for AGIs below $25k, 0.9% for AGIs $25k-50k, 1.2% for AGIs $50k-75k, 1.2% for AGIs $75k-100k, 3.0% for AGIs $100k-200k)
Net capital gain/loss in AGI: +$5,490 (reported on 10.9% of returns)
Here:
+$5,490
State:
+$9,326
(% of AGI for various income ranges: 0.8% for AGIs $25k-50k, 1.1% for AGIs $50k-75k, 1.2% for AGIs $75k-100k, 1.8% for AGIs $100k-200k, 5.8% for AGIs over 200k)
Profit/loss from business: +$7,895 (reported on 13.8% of returns)
Here:
+$7,895
State:
+$11,523
(% of AGI for various income ranges: 5.4% for AGIs below $25k, 2.8% for AGIs $25k-50k, 1.2% for AGIs $50k-75k, 2.6% for AGIs $75k-100k, 5.5% for AGIs $100k-200k)
Taxable individual retirement arrangement distribution: $10,103 (reported on 10.5% of returns)
49420:
$10,103
Michigan:
$15,298
(% of AGI for various income ranges: 3.4% for AGIs below $25k, 3.1% for AGIs $25k-50k, 3.1% for AGIs $50k-75k, 2.7% for AGIs $75k-100k, 3.9% for AGIs $100k-200k)
Total itemized deductions: $18,463 (21% of AGI, reported on 15.6% of returns)
Here:
$18,463
State:
$21,628
Here:
21.0% of AGI
State:
18.4% of AGI
(% of AGI for various income ranges: 5.1% for AGIs below $25k, 5.2% for AGIs $25k-50k, 7.9% for AGIs $50k-75k, 9.8% for AGIs $75k-100k, 12.4% for AGIs $100k-200k, 7.0% for AGIs over 200k)
Charity contributions: $3,359 (reported on 11.6% of returns)
Here:
$3,359
State:
$4,225
(% of AGI for various income ranges: 0.3% for AGIs below $25k, 0.7% for AGIs $25k-50k, 0.9% for AGIs $50k-75k, 1.4% for AGIs $75k-100k, 2.1% for AGIs $100k-200k, 1.1% for AGIs over 200k)
Taxes paid: $5,988 (reported on 15.6% of returns)
49420:
$5,988
State:
$8,327
(% of AGI for various income ranges: 0.9% for AGIs below $25k, 1.1% for AGIs $25k-50k, 2.2% for AGIs $50k-75k, 3.3% for AGIs $75k-100k, 4.2% for AGIs $100k-200k, 4.3% for AGIs over 200k)
Earned income credit: $2,506 (reported on 23.6% of returns)
Here:
$2,506
State:
$2,306
(% of AGI for various income ranges: 7.4% for AGIs below $25k, 1.7% for AGIs $25k-50k)
Percentage of individuals using paid preparers for their 2012 taxes: 62.5%
Here:
63%
State:
57%
(% for various income ranges: 56.8% for AGIs below $25k, 65.7% for AGIs $25k-50k, 68.6% for AGIs $50k-75k, 70.6% for AGIs $75k-100k, 72.7% for AGIs $100k-200k, 100.0% for AGIs over 200k)
Averages for the 2004 tax year for zip code 49420, filed in 2005:
Average Adjusted Gross Income (AGI) in 2004: $30,280 (Individual Income Tax Returns)
Here:
$30,280
State:
$48,204
Salary/wage: $26,483 (reported on 84.7% of returns)
Here:
$26,483
State:
$42,791
(% of AGI for various income ranges: 144.7% for AGIs below $10k, 74.5% for AGIs $10k-25k, 80.6% for AGIs $25k-50k, 76.7% for AGIs $50k-75k, 80.6% for AGIs $75k-100k, 39.9% for AGIs over 100k)
Taxable interest for individuals: $2,041 (reported on 37.3% of returns)
This zip code:
$2,041
Michigan:
$1,725
(% of AGI for various income ranges: 9.7% for AGIs below $10k, 2.5% for AGIs $10k-25k, 2.2% for AGIs $25k-50k, 1.4% for AGIs $50k-75k, 1.3% for AGIs $75k-100k, 5.0% for AGIs over 100k)
Taxable dividends: $1,926 (reported on 17.2% of returns)
Here:
$1,926
State:
$3,420
(% of AGI for various income ranges: 4.5% for AGIs below $10k, 0.9% for AGIs $10k-25k, 0.9% for AGIs $25k-50k, 0.7% for AGIs $50k-75k, 1.4% for AGIs $75k-100k, 1.6% for AGIs over 100k)
Net capital gain/loss: +$10,618 (reported on 15.0% of returns)
Here:
+$10,618
State:
+$8,532
(% of AGI for various income ranges: 8.8% for AGIs below $10k, 1.6% for AGIs $10k-25k, 2.0% for AGIs $25k-50k, 3.0% for AGIs $50k-75k, 3.9% for AGIs $75k-100k, 20.3% for AGIs over 100k)
Profit/loss from business: +$6,953 (reported on 15.0% of returns)
Here:
+$6,953
State:
+$9,547
(% of AGI for various income ranges: 6.9% for AGIs below $10k, 4.5% for AGIs $10k-25k, 2.6% for AGIs $25k-50k, 2.3% for AGIs $50k-75k, 1.0% for AGIs $75k-100k, 7.6% for AGIs over 100k)
IRA payment deduction: $2,930 (reported on 2.7% of returns)
49420:
$2,930
Michigan:
$2,875
(% of AGI for various income ranges: 0.2% for AGIs $10k-25k, 0.4% for AGIs $25k-50k, 0.3% for AGIs $50k-75k, 0.4% for AGIs $75k-100k)
Self-employed pension: $8,667 (reported on 0.4% of returns)
Here:
$8,667
Michigan:
$13,826
Total itemized deductions: $15,554 (25% of AGI, reported on 18.4% of returns)
Here:
$15,554
State:
$18,509
Here:
24.8% of AGI
State:
20.7% of AGI
(% of AGI for various income ranges: 9.7% for AGIs below $10k, 6.2% for AGIs $10k-25k, 8.3% for AGIs $25k-50k, 10.3% for AGIs $50k-75k, 10.6% for AGIs $75k-100k, 12.7% for AGIs over 100k)
Charity contributions deductions: $2,781 (4% of AGI, reported on 15.0% of returns)
Here:
$2,781
State:
$3,365
Here:
4.2% of AGI
State:
3.6% of AGI
(% of AGI for various income ranges: 1.0% for AGIs $10k-25k, 1.0% for AGIs $25k-50k, 1.2% for AGIs $50k-75k, 1.5% for AGIs $75k-100k, 2.9% for AGIs over 100k)
Total tax: $3,749 (reported on 63.5% of returns)
49420:
$3,749
State:
$7,691
(% of AGI for various income ranges: 3.6% for AGIs below $10k, 3.5% for AGIs $10k-25k, 5.7% for AGIs $25k-50k, 8.0% for AGIs $50k-75k, 9.7% for AGIs $75k-100k, 15.7% for AGIs over 100k)
Earned income credit: $1,934 (reported on 20.8% of returns)
Here:
$1,934
State:
$1,737
Percentage of individuals using paid preparers for their 2004 taxes: 59.6%
Here:
60%
State:
60%
(% for various income ranges: 49.9% for AGIs below $10k, 57.5% for AGIs $10k-25k, 64.6% for AGIs $25k-50k, 65.7% for AGIs $50k-75k, 69.2% for AGIs $75k-100k, 86.7% for AGIs over 100k)
Likely homosexual households (counted as self-reported same-sex unmarried-partner households)
Lesbian couples: 0.0% of all households
Gay men: 0.1% of all households
Household received Food Stamps/SNAP in the past 12 months: 324 Household did not receive Food Stamps/SNAP in the past 12 months: 2,113
Women who had a birth in the past 12 months: 83 (30 now married, 50 unmarried) Women who did not have a birth in the past 12 months: 1,001 (432 now married, 567 unmarried)
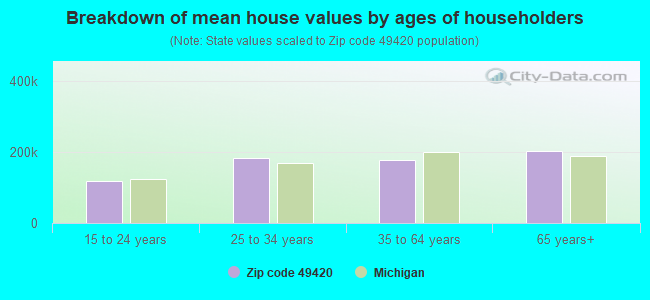
Housing units in zip code 49420 with a mortgage: 956 (84 second mortgage, 85 both second mortgage and home equity loan) Houses without a mortgage: 32
Median monthly owner costs for units with a mortgage: $1,183 Median monthly owner costs for units without a mortgage: $455
Residents with income below the poverty level in 2022:
This zip code:
14.7%
Whole state:
13.4%
Residents with income below 50% of the poverty level in 2022:
This zip code:
8.5%
Whole state:
6.9%
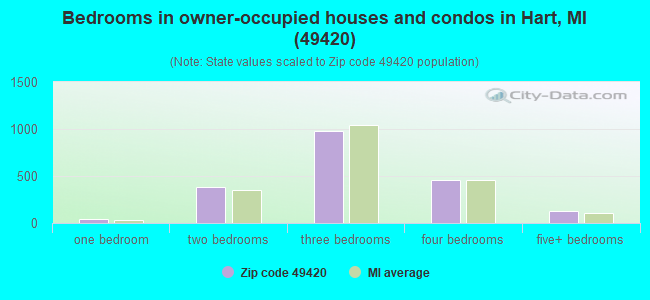
Median number of rooms in houses and condos:
Here:
6.5
State:
6.5
Median number of rooms in apartments:
Here:
4.2
State:
4.3
Notable locations in this zip code not listed on our city pages
Notable locations in zip code 49420: Halls Corners (A), Smith Corners (B), Twin Bridges Corners (C), Colonial Golf Courses (D), Oceana County Fairgrounds (E), Crystal Township Fire Department (F), Hart Fire Department (G), Oceana County Emergency Ambulance Service Headquarters (H), Hart Public Library (I), Hart City Hall (J), Hart Township Hall (K), Oceana County Sheriff Department (L), Oceana County Courthouse (M). Display/hide their locations on the map
Churches in zip code 49420 include: First Baptist Church (A), Church of Jesus Christ of Latter Day Saints (B), Saint Gregory's Parish (C), Hart Wesleyan Church (D), Hart United Methodist Church (E), Congregational United Church (F), Our Savior Lutheran Church (G), Jehovah's Witnesses (H), Crystal Valley Methodist Church (I). Display/hide their locations on the map
Cemeteries: Elbridge Township Cemetery (1), Indian Cemetery (2), Saint Joseph's Catholic Cemetery (3), Indian Cemetery (4), Hart Cemetery (5), Lever Cemetery (6), North Hart Cemetery (7). Display/hide their locations on the map
Lakes and reservoirs: Cobmoosa Lake (A), Evans Lake (B), Gales Pond (C), Wyckoff Lake (D), Crystal Lake (E), Hart Lake (F). Display/hide their locations on the map
Streams, rivers, and creeks: Knox Creek (A), Makins Creek (B), Huftile Creek (C), Hodges Creek (D), Donaldson Creek (E), Waldron Drain (F), Crystal Creek (G), Cleveland Creek (H), Mud Creek (I). Display/hide their locations on the map
686 married couples with children.
399 single-parent households (195 men, 204 women).
88.1% of residents of 49420 zip code speak English at home.
11.7% of residents speak Spanish at home (54% very well, 26% well, 8% not well, 12% not at all).
0.2% of residents speak other Indo-European language at home (42% very well, 58% well).
0.1% of residents speak Asian or Pacific Island language at home (62% very well, 38% not at all).
0.1% of residents speak other language at home (100% very well).
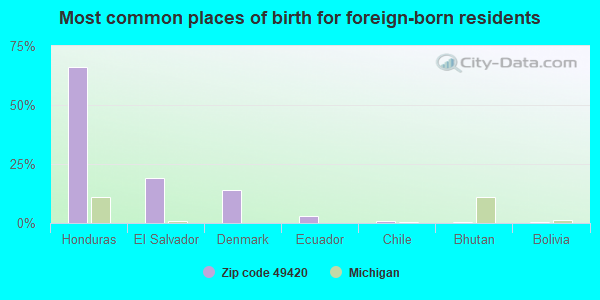
Foreign born population: 381 (6.2%) (13.7% of them are naturalized citizens)
This zip code:
6.2%
Whole state:
6.9%
66%Honduras
19%El Salvador
14%Denmark
3%Ecuador
1%Chile
1%Bhutan
1%Bolivia
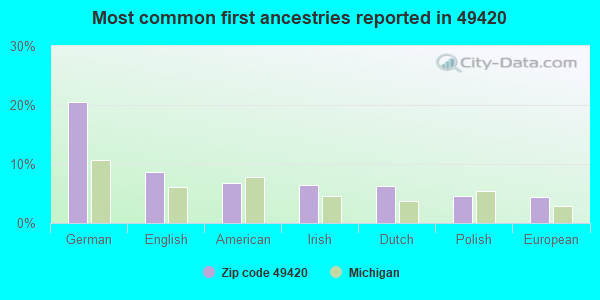
21%German
9%English
7%American
6%Irish
6%Dutch
5%Polish
4%European
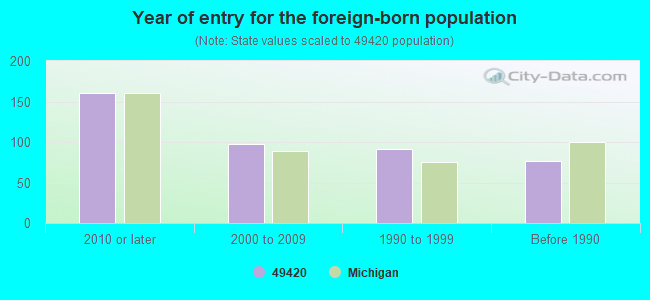
Year of entry for the foreign-born population
1602010 or later
982000 to 2009
911990 to 1999
76Before 1990
Facilities with environmental interests located in this zip code:
DEVELOPMENTAL CENTER (300 W. JOHNSON STREET in HART, MI)
(National Center for Education Statistics) - STATE ID-07574 Organizations: OCEANA ISD (SCHOOL DISTRICT)
ELBRIDGE SCHOOL (2266 E. POLK ROAD in HART, MI)
(National Center for Education Statistics) - STATE ID-01101 Organizations: HART PUBLIC SCHOOL DISTRICT (SCHOOL DISTRICT)
GEORGE PERRY EXPLORATION & PRODUCTION (OCEANA DR RT 1 in HART, MI)
(Integrated Compliance Information System) - ICIS-05-1993-0506, FORMAL ENFORCEMENT ACTION
MI DEPT/TRANSPORTATION BRIDGE B01-64015 (US-31 OVER PENTWATER RIVER in HART, MI)
(Resource Conservation and Recovery Act (tracking hazardous waste)) Organizations: MICH DEPT OF TRANSPORTATION (CONTACT/OPERATOR)
Alternative names: MIDOT BRIDGE US-31 OVER S BR PENTWATER R
GRAY & COMPANY (3325 POLK RD in HART, MI)
(Resource Conservation and Recovery Act (tracking hazardous waste)) Business NAICS classification: SPECIALTY CANNING.
EAST HART PARTY STORE (1324 OCEANA DR in HART, MI)
MI DEPT/AGRICULTURE (POLK ROAD FACILITY in HART, MI)
(Resource Conservation and Recovery Act (tracking hazardous waste))
MI DEPT/STATE POLICE (136TH & FILMORE in HART, MI)
(Resource Conservation and Recovery Act (tracking hazardous waste)) Alternative names: MI DEPT/STATE POLICE (E)
FREMONT COOPERATIVE PRODUCE INC (17 EAST MAIN in HART, MI)
Small Quantity Generators, between 100 kg and 1000 kg of hazardous waste/month (Resource Conservation and Recovery Act (tracking hazardous waste)) Business NAICS classification: ALL OTHER MISCELLANEOUS CROP FARMING. Organizations: BILLS STARTER (CONTACT/OPERATOR)
, FREEMONT COOPERATIVE PRODUCE INC (CONTACT/OWNER)
GHSP HART PLASTICS (1500 INDUSTRIAL PARK DR in HART, MI)
Conditionally Exempt Small Quantity Generators, less than 100 kg/month of hazardous waste (Resource Conservation and Recovery Act (tracking hazardous waste)) Organizations: JSJ CORP (CONTACT/OWNER)
, JSJ PLASTICS GROUP INC (CONTACT/OWNER)
Alternative names: GHSP-HART
Housing units lacking complete plumbing facilities: 4.4% Housing units lacking complete kitchen facilities: 3.0%
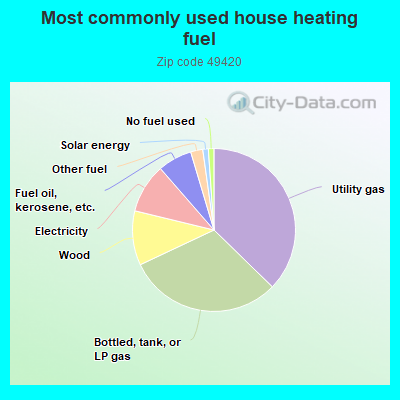
37.3%Utility gas
30.7%Bottled, tank, or LP gas
10.8%Wood
9.8%Electricity
6.8%Fuel oil, kerosene, etc.
2.4%Other fuel
1.1%Solar energy
1.1%No fuel used
Population in 1990: 5,548. Population change in the 1990s: +1,137 (+20.5%).
Place of birth for U.S.-born residents:
This state: 4,801
Northeast: 82
Midwest: 296
South: 392
West: 124
62% of the 49420 zip code residents lived in the same house 5 years ago. Out of people who lived in different houses, 63% lived in this county. Out of people who lived in different counties, 50% lived in Michigan.
91% of the 49420 zip code residents lived in the same house 1 year ago. Out of people who lived in different houses, 53% moved from this county. Out of people who lived in different houses, 36% moved from different county within same state. Out of people who lived in different houses, 10% moved from different state.
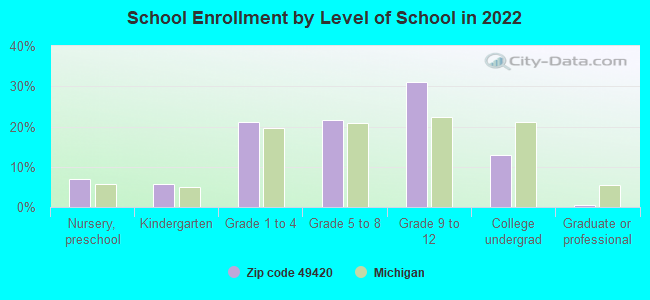
Private vs. public school enrollment:
Students in private schools in grades 1 to 8 (elementary and middle school): 74
Here:
16.3%
Michigan:
12.4%
Students in private schools in grades 9 to 12 (high school): 53
Here:
16.4%
Michigan:
9.8%
Students in private undergraduate colleges: 14
Here:
10.5%
Michigan:
14.9%
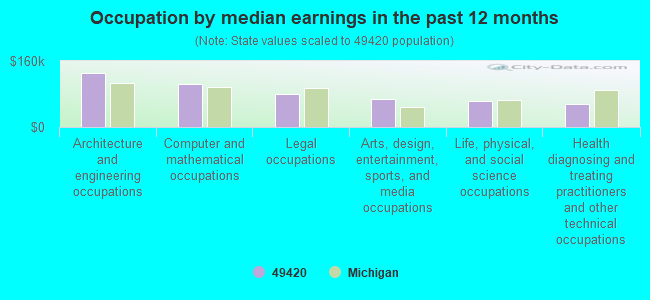
Occupation by median earnings in the past 12 months ($)
130,274Architecture and engineering occupations
104,517Computer and mathematical occupations
80,221Legal occupations
68,346Arts, design, entertainment, sports, and media occupations
63,455Life, physical, and social science occupations
55,898Health diagnosing and treating practitioners and other technical occupations
Top industries in this zip code by the number of employees in 2005:
Health Care and Social Assistance: Nursing Care Facilities (100-249 employees: 1 establishment)
Health Care and Social Assistance: Child Day Care Services (20-49: 1, 10-19: 2)
Accommodation and Food Services: Hotels (except Casino Hotels) and Motels (20-49: 1, 1-4: 1)
Health Care and Social Assistance: Offices of Physicians (except Mental Health Specialists) (20-49: 1, 1-4: 1)
People in group quarters in 2010:
123 people in nursing facilities/skilled-nursing facilities
49 people in local jails and other municipal confinement facilities
25 people in workers' group living quarters and job corps centers
11 people in residential treatment centers for juveniles (non-correctional)
People in group quarters in 2000:
198 people in agriculture workers' dormitories on farms
134 people in nursing homes
57 people in unknown juvenile institutions
55 people in local jails and other confinement facilities (including police lockups)
32 people in other group homes
18 people in homes for the mentally ill
18 people in religious group quarters
16 people in other workers' dormitories
11 people in other nonhousehold living situations
Fatal accident statistics in 2014:
Fatal accident count: 1
Vehicles involved in fatal accidents: 1
Fatal accidents caused by drunken drivers: 1
Fatalities: 1
Persons involved in fatal accidents: 1
Pedestrians involved in fatal accidents: 0
Fatal accident statistics in 2010:
Fatal accident count: 2
Vehicles involved in fatal accidents: 2
Fatal accidents caused by drunken drivers: 1
Fatalities: 2
Persons involved in fatal accidents: 2
Pedestrians involved in fatal accidents: 0
2002 - 2018 National Fire Incident Reporting System (NFIRS) incidents
Based on the data from the years 2002 - 2018 the average number of fire incidents per year is 23. The highest number of reported fires - 54 took place in 2018, and the least - 5 in 2013. The data has a growing trend.
When looking into fire subcategories, the most incidents belonged to: Structure Fires (49.7%), and Outside Fires (28.9%).
Fire incident types reported to NFIRS in Zip Code 49420

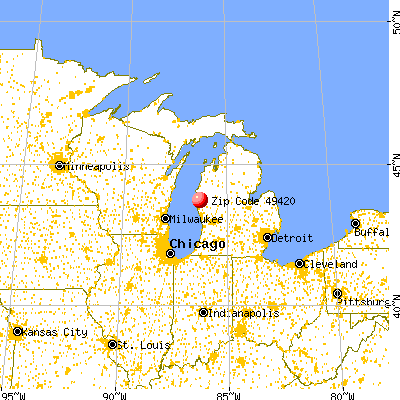


 Nearest zip codes: 49449, 49455, 49459, 49436, 49446, 49452.


 Based on the data from the years 2002 - 2018 the average number of fire incidents per year is 23. The highest number of reported fires - 54 took place in 2018, and the least - 5 in 2013. The data has a growing trend.
 When looking into fire subcategories, the most incidents belonged to: Structure Fires (49.7%), and Outside Fires (28.9%).