Estimated zip code population in 2022: 2,343 Zip code population in 2010: 2,321 Zip code population in 2000: 2,294
Houses and condos: 1,118 Renter-occupied apartments: 111
% of renters here:
14%
State:
27%
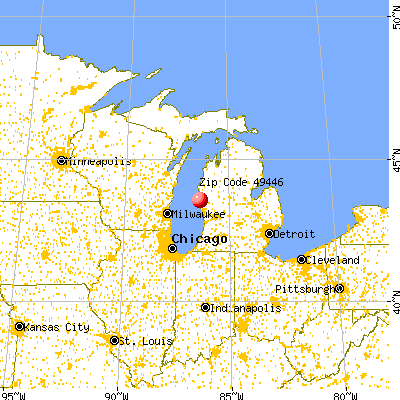
March 2022 cost of living index in zip code 49446: 81.2 (low, U.S. average is 100)
Land area: 31.8 sq. mi. Water area: 1.1 sq. mi.
Population density: 74 people per square mile
(very low).
OSM Map
General Map
Google Map
MSN Map
OSM Map
General Map
Google Map
MSN Map
OSM Map
General Map
Google Map
MSN Map
OSM Map
General Map
Google Map
MSN Map
Please wait while loading the map...
Real estate property taxes paid for housing units in 2022:
This zip code:
1.0% ($1,813)
Michigan:
1.2% ($2,746)
Median real estate property taxes paid for housing units with mortgages in 2022: $2,059 (1.1%) Median real estate property taxes paid for housing units with no mortgage in 2022: $1,636 (0.9%)
Business Search- 14 Million verified businesses
Males: 1,185
(50.6%)
Females: 1,157
(49.4%)
For population 25 years and over in 49446:
High school or higher: 89.2%
Bachelor's degree or higher: 21.1%
Graduate or professional degree: 9.5%
Unemployed: 2.5%
Mean travel time to work (commute): 23.5 minutes
For population 15 years and over in 49446:
Never married: 31.9%
Now married: 53.1%
Separated: 0.8%
Widowed: 5.4%
Divorced: 8.8%
Zip code 49446 compared to state average:
Unemployed percentage below state average.
Black race population percentage significantly below state average.
Hispanic race population percentage significantly above state average.
Renting percentage below state average.
Length of stay since moving in significantly above state average.
Number of college students significantly below state average.
Percentage of population with a bachelor's degree or higher below state average.
Averages for the 2020 tax year for zip code 49446, filed in 2021:
Average Adjusted Gross Income (AGI) in 2020: $54,108 (Individual Income Tax Returns)
Here:
$54,108
State:
$68,945
Salary/wage: $42,862 (reported on 78.6% of returns)
Here:
$42,862
State:
$57,142
(% of AGI for various income ranges: 1126.2% for AGIs below $25k, 3405.2% for AGIs $25k-50k, 5968.2% for AGIs $50k-75k, 7730.0% for AGIs $75k-100k, 14107.5% for AGIs $100k-200k)
Taxable interest for individuals: $894 (reported on 28.6% of returns)
This zip code:
$894
Michigan:
$1,630
(% of AGI for various income ranges: 12.1% for AGIs below $25k, 26.1% for AGIs $25k-50k, 62.7% for AGIs $50k-75k, 56.2% for AGIs $75k-100k, 103.8% for AGIs $100k-200k)
Ordinary dividends: $2,156 (reported on 14.3% of returns)
Here:
$2,156
State:
$6,972
(% of AGI for various income ranges: 29.2% for AGIs below $25k, 61.8% for AGIs $50k-75k, 60.0% for AGIs $75k-100k, 198.8% for AGIs $100k-200k)
Net capital gain/loss in AGI: +$5,540 (reported on 13.4% of returns)
Here:
+$5,540
State:
+$20,064
(% of AGI for various income ranges: 32.1% for AGIs below $25k, 45.5% for AGIs $50k-75k, 282.5% for AGIs $75k-100k, 597.5% for AGIs $100k-200k)
Profit/loss from business: +$8,121 (reported on 12.5% of returns)
Here:
+$8,121
State:
+$11,172
(% of AGI for various income ranges: 89.6% for AGIs below $25k, 57.4% for AGIs $25k-50k, 510.0% for AGIs $50k-75k, 286.2% for AGIs $100k-200k)
Taxable individual retirement arrangement distribution: $16,915 (reported on 11.6% of returns)
49446:
$16,915
Michigan:
$19,803
(% of AGI for various income ranges: 102.9% for AGIs below $25k, 170.0% for AGIs $25k-50k, 863.6% for AGIs $50k-75k, 763.8% for AGIs $100k-200k)
Total itemized deductions: $30,833 (reported on 2.7% of returns)
Here:
$30,833
State:
$34,117
(% of AGI for various income ranges: 1156.2% for AGIs $75k-100k)
Charity contributions: $8,333 (reported on 2.7% of returns)
Here:
$8,333
State:
$13,548
(% of AGI for various income ranges: 227.3% for AGIs $50k-75k)
Taxes paid: $7,367 (reported on 2.7% of returns)
49446:
$7,367
State:
$7,972
(% of AGI for various income ranges: 276.2% for AGIs $75k-100k)
Earned income credit: $2,100 (reported on 14.3% of returns)
Here:
$2,100
State:
$2,251
(% of AGI for various income ranges: 74.6% for AGIs below $25k, 68.3% for AGIs $25k-50k)
Percentage of individuals using paid preparers for their 2020 taxes: 92.9%
Here:
93%
State:
93%
(% for various income ranges: 92.5% for AGIs below $25k, 93.1% for AGIs $25k-50k, 94.1% for AGIs $50k-75k, 90.9% for AGIs $75k-100k, 92.3% for AGIs $100k-200k, 100.0% for AGIs over 200k)
Averages for the 2012 tax year for zip code 49446, filed in 2013:
Average Adjusted Gross Income (AGI) in 2012: $42,843 (Individual Income Tax Returns)
Here:
$42,843
State:
$55,609
Salary/wage: $35,631 (reported on 80.0% of returns)
Here:
$35,631
State:
$46,782
(% of AGI for various income ranges: 69.6% for AGIs below $25k, 74.1% for AGIs $25k-50k, 74.3% for AGIs $50k-75k, 70.2% for AGIs $75k-100k, 50.5% for AGIs $100k-200k)
Taxable interest for individuals: $1,150 (reported on 32.0% of returns)
This zip code:
$1,150
Michigan:
$1,491
(% of AGI for various income ranges: 1.1% for AGIs below $25k, 1.3% for AGIs $25k-50k, 0.8% for AGIs $50k-75k, 1.0% for AGIs $75k-100k, 0.4% for AGIs $100k-200k)
Ordinary dividends: $1,488 (reported on 17.0% of returns)
Here:
$1,488
State:
$6,225
(% of AGI for various income ranges: 1.3% for AGIs below $25k, 0.6% for AGIs $25k-50k, 0.5% for AGIs $50k-75k, 0.5% for AGIs $75k-100k, 0.4% for AGIs $100k-200k)
Net capital gain/loss in AGI: +$964 (reported on 11.0% of returns)
Here:
+$964
State:
+$9,326
(% of AGI for various income ranges: 0.4% for AGIs $50k-75k, 0.5% for AGIs $75k-100k, 0.5% for AGIs $100k-200k)
Profit/loss from business: +$5,040 (reported on 15.0% of returns)
Here:
+$5,040
State:
+$11,523
(% of AGI for various income ranges: 4.7% for AGIs below $25k, 2.6% for AGIs $25k-50k, 0.5% for AGIs $50k-75k, 3.2% for AGIs $75k-100k)
Taxable individual retirement arrangement distribution: $12,133 (reported on 12.0% of returns)
49446:
$12,133
Michigan:
$15,298
(% of AGI for various income ranges: 6.4% for AGIs below $25k, 4.5% for AGIs $25k-50k, 2.9% for AGIs $50k-75k, 5.9% for AGIs $75k-100k)
Total itemized deductions: $17,583 (20% of AGI, reported on 23.0% of returns)
Here:
$17,583
State:
$21,628
Here:
20.2% of AGI
State:
18.4% of AGI
(% of AGI for various income ranges: 6.6% for AGIs below $25k, 8.4% for AGIs $25k-50k, 8.7% for AGIs $50k-75k, 10.5% for AGIs $75k-100k, 11.3% for AGIs $100k-200k)
Charity contributions: $4,979 (reported on 19.0% of returns)
Here:
$4,979
State:
$4,225
(% of AGI for various income ranges: 2.0% for AGIs $25k-50k, 1.5% for AGIs $50k-75k, 2.5% for AGIs $75k-100k, 3.7% for AGIs $100k-200k)
Taxes paid: $5,530 (reported on 23.0% of returns)
49446:
$5,530
State:
$8,327
(% of AGI for various income ranges: 2.6% for AGIs $25k-50k, 2.4% for AGIs $50k-75k, 3.7% for AGIs $75k-100k, 4.4% for AGIs $100k-200k)
Earned income credit: $2,206 (reported on 17.0% of returns)
Here:
$2,206
State:
$2,306
(% of AGI for various income ranges: 5.3% for AGIs below $25k, 1.5% for AGIs $25k-50k)
Percentage of individuals using paid preparers for their 2012 taxes: 57.0%
Here:
57%
State:
57%
(% for various income ranges: 51.1% for AGIs below $25k, 56.5% for AGIs $25k-50k, 62.5% for AGIs $50k-75k, 60.0% for AGIs $75k-100k, 83.3% for AGIs $100k-200k)
Averages for the 2004 tax year for zip code 49446, filed in 2005:
Average Adjusted Gross Income (AGI) in 2004: $37,893 (Individual Income Tax Returns)
Here:
$37,893
State:
$48,204
Salary/wage: $33,023 (reported on 84.2% of returns)
Here:
$33,023
State:
$42,791
(% of AGI for various income ranges: 94.8% for AGIs below $10k, 69.8% for AGIs $10k-25k, 78.4% for AGIs $25k-50k, 80.0% for AGIs $50k-75k, 84.0% for AGIs $75k-100k, 51.8% for AGIs over 100k)
Taxable interest for individuals: $1,428 (reported on 48.1% of returns)
This zip code:
$1,428
Michigan:
$1,725
(% of AGI for various income ranges: 6.6% for AGIs below $10k, 3.2% for AGIs $10k-25k, 1.8% for AGIs $25k-50k, 1.6% for AGIs $50k-75k, 1.1% for AGIs $75k-100k, 1.4% for AGIs over 100k)
Taxable dividends: $1,447 (reported on 21.7% of returns)
Here:
$1,447
State:
$3,420
(% of AGI for various income ranges: 3.1% for AGIs below $10k, 1.6% for AGIs $10k-25k, 1.1% for AGIs $25k-50k, 0.9% for AGIs $50k-75k, 0.2% for AGIs $75k-100k, 0.3% for AGIs over 100k)
Net capital gain/loss: +$9,337 (reported on 15.7% of returns)
Here:
+$9,337
State:
+$8,532
(% of AGI for various income ranges: -2.8% for AGIs below $10k, -0.8% for AGIs $10k-25k, 1.0% for AGIs $25k-50k, 0.7% for AGIs $50k-75k, 1.7% for AGIs $75k-100k, 14.9% for AGIs over 100k)
Profit/loss from business: +$5,484 (reported on 14.7% of returns)
Here:
+$5,484
State:
+$9,547
(% of AGI for various income ranges: -8.2% for AGIs below $10k, 3.4% for AGIs $10k-25k, 3.3% for AGIs $25k-50k, 3.8% for AGIs $50k-75k, 1.8% for AGIs $75k-100k)
IRA payment deduction: $2,839 (reported on 3.0% of returns)
49446:
$2,839
Michigan:
$2,875
Total itemized deductions: $15,085 (23% of AGI, reported on 27.0% of returns)
Here:
$15,085
State:
$18,509
Here:
22.5% of AGI
State:
20.7% of AGI
(% of AGI for various income ranges: 15.5% for AGIs below $10k, 9.0% for AGIs $10k-25k, 12.2% for AGIs $25k-50k, 9.8% for AGIs $50k-75k, 10.2% for AGIs $75k-100k, 10.8% for AGIs over 100k)
Charity contributions deductions: $3,342 (5% of AGI, reported on 22.2% of returns)
Here:
$3,342
State:
$3,365
Here:
4.9% of AGI
State:
3.6% of AGI
(% of AGI for various income ranges: 1.4% for AGIs $10k-25k, 2.0% for AGIs $25k-50k, 1.7% for AGIs $50k-75k, 2.4% for AGIs $75k-100k, 2.4% for AGIs over 100k)
Total tax: $5,114 (reported on 68.6% of returns)
49446:
$5,114
State:
$7,691
(% of AGI for various income ranges: 1.8% for AGIs below $10k, 3.8% for AGIs $10k-25k, 5.6% for AGIs $25k-50k, 8.9% for AGIs $50k-75k, 10.7% for AGIs $75k-100k, 15.9% for AGIs over 100k)
Earned income credit: $1,707 (reported on 13.5% of returns)
Here:
$1,707
State:
$1,737
Percentage of individuals using paid preparers for their 2004 taxes: 58.4%
Here:
58%
State:
60%
(% for various income ranges: 43.0% for AGIs below $10k, 62.1% for AGIs $10k-25k, 65.6% for AGIs $25k-50k, 61.8% for AGIs $50k-75k, 58.4% for AGIs $75k-100k, 78.4% for AGIs over 100k)
Household received Food Stamps/SNAP in the past 12 months: 111 Household did not receive Food Stamps/SNAP in the past 12 months: 686
Women who had a birth in the past 12 months: 11 (11 now married, 0 unmarried) Women who did not have a birth in the past 12 months: 456 (147 now married, 309 unmarried)
Housing units in zip code 49446 with a mortgage: 394 (88 second mortgage, 91 both second mortgage and home equity loan) Houses without a mortgage: 16
Median monthly owner costs for units with a mortgage: $1,277 Median monthly owner costs for units without a mortgage: $492
Residents with income below the poverty level in 2022:
This zip code:
16.2%
Whole state:
13.4%
Residents with income below 50% of the poverty level in 2022:
This zip code:
9.2%
Whole state:
6.9%
Median number of rooms in houses and condos:
Here:
6.7
State:
6.5
Median number of rooms in apartments:
Here:
4.7
State:
4.3
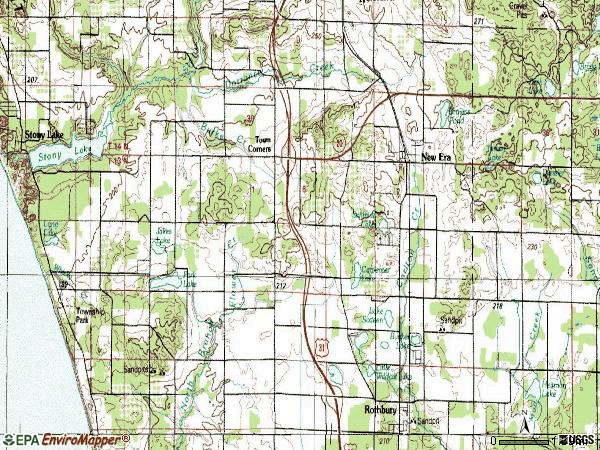
Notable locations in this zip code not listed on our city pages
Churches in zip code 49446 include: New Era Christian Reformed Church (A), New Era Reformed Church (B), New Era Bible Church (C), Trinity Church (D). Display/hide their locations on the map
Cemeteries: Trinity Lutheran Cemetery (1), New Era Cemetery (2), Eagle Cemetery (3), Cranston Cemetery (4), Pine Grove Cemetery (5). Display/hide their locations on the map
Lakes and swamps: Browns Pond (A), Carpenter Lake (B), Chase Lake (C), Inman Lake (D), Jakes Lake (E), Long Lake (F), Schmidt Lake (G), Zeek Lake (H). Display/hide their locations on the map
In group quarters: 36 (-1 institutionalized population)
Size of family households: 301 2-persons, 114 3-persons, 101 4-persons, 71 5-persons, 20 6-persons, 8 7-or-more-persons
Size of nonfamily households: 146 1-person, 21 2-persons, 8 3-persons
335 married couples with children.
145 single-parent households (20 men, 125 women).
86.1% of residents of 49446 zip code speak English at home.
12.9% of residents speak Spanish at home (64% very well, 15% well, 16% not well, 5% not at all).
0.9% of residents speak other Indo-European language at home (100% very well).
0.2% of residents speak other language at home (100% not at all).
Foreign born population: 202 (8.6%) (14.6% of them are naturalized citizens)
This zip code:
8.6%
Whole state:
6.9%
79%Honduras
9%France
5%Sweden
4%United Kingdom, excluding England and Scotland
4%El Salvador
18%American
17%German
13%Dutch
10%English
4%Irish
3%Norwegian
2%Italian
Year of entry for the foreign-born population
212010 or later
1332000 to 2009
121990 to 1999
33Before 1990
Facilities with environmental interests located in this zip code:
MI DEPT/TRANSPORTATION BRIDGE (US-31 AT M-20 EXT W OF in NEW ERA, MI)
(Resource Conservation and Recovery Act (tracking hazardous waste)) Organizations: MICH DEPT OF TRANSPORTATION (CONTACT/OPERATOR)
F&F SERVICE STATION (US 31 in NEW ERA, MI)
(Resource Conservation and Recovery Act (tracking hazardous waste)) Organizations: FF SERVICE STATION (CONTACT/OPERATOR)
MI DEPT/STATE POLICE (5662 SAGOLA TRAIL in NEW ERA, MI)
(Resource Conservation and Recovery Act (tracking hazardous waste)) Alternative names: MI DEPT/STATE POLICE (E)
Housing units lacking complete plumbing facilities: 7.3% Housing units lacking complete kitchen facilities: 7.6%
47.7%Bottled, tank, or LP gas
27.7%Utility gas
7.3%Wood
6.4%Fuel oil, kerosene, etc.
5.6%Electricity
4.1%Other fuel
1.3%No fuel used
Population in 1990: 2,539.
Place of birth for U.S.-born residents:
This state: 1,768
Northeast: 43
Midwest: 200
South: 65
West: 57
69% of the 49446 zip code residents lived in the same house 5 years ago. Out of people who lived in different houses, 49% lived in this county. Out of people who lived in different counties, 50% lived in Michigan.
93% of the 49446 zip code residents lived in the same house 1 year ago. Out of people who lived in different houses, 36% moved from this county. Out of people who lived in different houses, 49% moved from different county within same state. Out of people who lived in different houses, 15% moved from different state.
Private vs. public school enrollment:
Students in private schools in grades 1 to 8 (elementary and middle school): 43
Here:
21.9%
Michigan:
12.4%
Students in private schools in grades 9 to 12 (high school): 27
Here:
11.5%
Michigan:
9.8%
Students in private undergraduate colleges: 4
Here:
25.4%
Michigan:
14.9%
Occupation by median earnings in the past 12 months ($)
88,226Architecture and engineering occupations
84,205Business and financial operations occupations
61,759Health diagnosing and treating practitioners and other technical occupations
49,058Installation, maintenance, and repair occupations
48,596Community and social service occupations
39,534Education, training, and library occupations
Top industries in this zip code by the number of employees in 2005:
Wholesale Trade: Farm and Garden Machinery and Equipment Merchant Wholesalers (20-49 employees: 1 establishment)
Other Services (except Public Administration): Religious Organizations (5-9: 2, 1-4: 2)
Accommodation and Food Services: Full-Service Restaurants (10-19: 1)
Accommodation and Food Services: Limited-Service Restaurants (10-19: 1)
Construction: New Single-Family Housing Construction (except Operative Builders) (5-9: 1, 1-4: 3)
Finance and Insurance: Commercial Banking (5-9: 1)
Other Services (except Public Administration): Pet Care (except Veterinary) Services (5-9: 1)
People in group quarters in 2010:
23 people in workers' group living quarters and job corps centers
People in group quarters in 2000:
22 people in agriculture workers' dormitories on farms
Fatal accident statistics in 2012:
Fatal accident count: 1
Vehicles involved in fatal accidents: 1
Fatal accidents caused by drunken drivers: 0
Fatalities: 1
Persons involved in fatal accidents: 1
Pedestrians involved in fatal accidents: 0
2002 - 2018 National Fire Incident Reporting System (NFIRS) incidents
According to the data from the years 2002 - 2018 the average number of fire incidents per year is 9. The highest number of reported fire incidents - 16 took place in 2006, and the least - 5 in 2004. The data has a rising trend.
When looking into fire subcategories, the most incidents belonged to: Structure Fires (34.6%), and Other (28.1%).
Fire incident types reported to NFIRS in Zip Code 49446


 Nearest zip codes: 49455, 49437, 49452, 49436, 49461, 49420.


 According to the data from the years 2002 - 2018 the average number of fire incidents per year is 9. The highest number of reported fire incidents - 16 took place in 2006, and the least - 5 in 2004. The data has a rising trend.
 When looking into fire subcategories, the most incidents belonged to: Structure Fires (34.6%), and Other (28.1%).