Estimated zip code population in 2022: 1,643 Zip code population in 2010: 1,351 Zip code population in 2000: 1,459
Houses and condos: 971 Renter-occupied apartments: 83
% of renters here:
16%
State:
27%
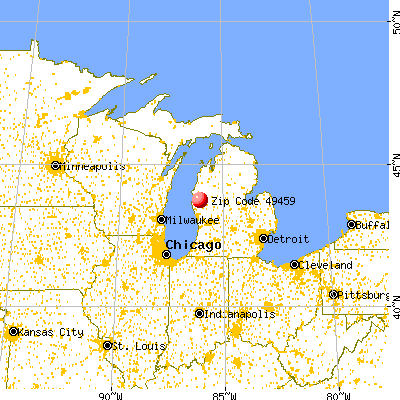
March 2022 cost of living index in zip code 49459: 80.9 (low, U.S. average is 100)
Land area: 69.5 sq. mi. Water area: 7.7 sq. mi.
Population density: 24 people per square mile
(very low).
OSM Map
General Map
Google Map
MSN Map
OSM Map
General Map
Google Map
MSN Map
OSM Map
General Map
Google Map
MSN Map
OSM Map
General Map
Google Map
MSN Map
Please wait while loading the map...
Real estate property taxes paid for housing units in 2022:
This zip code:
1.3% ($1,378)
Michigan:
1.2% ($2,746)
Median real estate property taxes paid for housing units with mortgages in 2022: $1,530 (1.2%) Median real estate property taxes paid for housing units with no mortgage in 2022: $1,287 (1.4%)
Business Search- 14 Million verified businesses
Males: 880
(53.6%)
Females: 762
(46.4%)
For population 25 years and over in 49459:
High school or higher: 85.0%
Bachelor's degree or higher: 13.6%
Graduate or professional degree: 2.3%
Unemployed: 7.6%
Mean travel time to work (commute): 29.4 minutes
For population 15 years and over in 49459:
Never married: 34.8%
Now married: 42.4%
Separated: 2.4%
Widowed: 6.8%
Divorced: 13.5%
Zip code 49459 compared to state average:
Median house value below state average.
Black race population percentage significantly below state average.
Hispanic race population percentage significantly above state average.
Renting percentage below state average.
Number of rooms per house below state average.
Percentage of population with a bachelor's degree or higher significantly below state average.
Averages for the 2020 tax year for zip code 49459, filed in 2021:
Average Adjusted Gross Income (AGI) in 2020: $39,336 (Individual Income Tax Returns)
Here:
$39,336
State:
$68,945
Salary/wage: $36,648 (reported on 78.0% of returns)
Here:
$36,648
State:
$57,142
(% of AGI for various income ranges: 975.3% for AGIs below $25k, 3502.9% for AGIs $25k-50k, 5480.0% for AGIs $50k-75k, 9970.0% for AGIs $75k-100k, 15216.7% for AGIs $100k-200k)
Taxable interest for individuals: $1,038 (reported on 22.0% of returns)
This zip code:
$1,038
Michigan:
$1,630
(% of AGI for various income ranges: 17.1% for AGIs below $25k, 37.9% for AGIs $25k-50k, 72.0% for AGIs $50k-75k, 56.7% for AGIs $75k-100k)
Ordinary dividends: $1,400 (reported on 8.5% of returns)
Here:
$1,400
State:
$6,972
(% of AGI for various income ranges: 28.2% for AGIs below $25k, 44.0% for AGIs $50k-75k)
Net capital gain/loss in AGI: +$2,450 (reported on 10.2% of returns)
Here:
+$2,450
State:
+$20,064
(% of AGI for various income ranges: 75.3% for AGIs below $25k, 38.0% for AGIs $50k-75k)
Profit/loss from business: +$3,771 (reported on 11.9% of returns)
Here:
+$3,771
State:
+$11,172
(% of AGI for various income ranges: 62.9% for AGIs below $25k, 112.1% for AGIs $25k-50k)
Taxable individual retirement arrangement distribution: $9,567 (reported on 10.2% of returns)
49459:
$9,567
Michigan:
$19,803
(% of AGI for various income ranges: 88.2% for AGIs below $25k, 302.9% for AGIs $25k-50k)
Earned income credit: $2,557 (reported on 23.7% of returns)
Here:
$2,557
State:
$2,251
(% of AGI for various income ranges: 120.6% for AGIs below $25k, 109.3% for AGIs $25k-50k)
Percentage of individuals using paid preparers for their 2020 taxes: 91.5%
Here:
92%
State:
93%
(% for various income ranges: 92.0% for AGIs below $25k, 94.4% for AGIs $25k-50k, 85.7% for AGIs $50k-75k, 80.0% for AGIs $75k-100k, 100.0% for AGIs $100k-200k)
Averages for the 2012 tax year for zip code 49459, filed in 2013:
Average Adjusted Gross Income (AGI) in 2012: $33,069 (Individual Income Tax Returns)
Here:
$33,069
State:
$55,609
Salary/wage: $30,556 (reported on 78.8% of returns)
Here:
$30,556
State:
$46,782
(% of AGI for various income ranges: 62.3% for AGIs below $25k, 78.5% for AGIs $25k-50k, 80.4% for AGIs $50k-75k, 141.2% for AGIs $75k-100k)
Taxable interest for individuals: $1,153 (reported on 28.8% of returns)
This zip code:
$1,153
Michigan:
$1,491
(% of AGI for various income ranges: 0.8% for AGIs below $25k, 0.9% for AGIs $25k-50k, 2.0% for AGIs $50k-75k, 1.2% for AGIs $75k-100k)
Ordinary dividends: $1,320 (reported on 9.6% of returns)
Here:
$1,320
State:
$6,225
Net capital gain/loss in AGI: +$500 (reported on 9.6% of returns)
Here:
+$500
State:
+$9,326
Profit/loss from business: +$3,643 (reported on 13.5% of returns)
Here:
+$3,643
State:
+$11,523
(% of AGI for various income ranges: 7.4% for AGIs below $25k, 0.3% for AGIs $25k-50k)
Taxable individual retirement arrangement distribution: $7,067 (reported on 11.5% of returns)
49459:
$7,067
Michigan:
$15,298
Total itemized deductions: $18,983 (27% of AGI, reported on 11.5% of returns)
Here:
$18,983
State:
$21,628
Here:
26.7% of AGI
State:
18.4% of AGI
Charity contributions: $2,960 (reported on 9.6% of returns)
Here:
$2,960
State:
$4,225
Taxes paid: $5,250 (reported on 11.5% of returns)
49459:
$5,250
State:
$8,327
Earned income credit: $2,520 (reported on 28.8% of returns)
Here:
$2,520
State:
$2,306
(% of AGI for various income ranges: 8.6% for AGIs below $25k, 2.0% for AGIs $25k-50k)
Percentage of individuals using paid preparers for their 2012 taxes: 65.4%
Here:
65%
State:
57%
(% for various income ranges: 61.5% for AGIs below $25k, 66.7% for AGIs $25k-50k, 66.7% for AGIs $50k-75k, 133.3% for AGIs $75k-100k)
Averages for the 2004 tax year for zip code 49459, filed in 2005:
Average Adjusted Gross Income (AGI) in 2004: $27,141 (Individual Income Tax Returns)
Here:
$27,141
State:
$48,204
Salary/wage: $24,442 (reported on 85.0% of returns)
Here:
$24,442
State:
$42,791
(% of AGI for various income ranges: 119.6% for AGIs below $10k, 80.9% for AGIs $10k-25k, 79.8% for AGIs $25k-50k, 70.6% for AGIs $50k-75k, 82.2% for AGIs $75k-100k, 52.7% for AGIs over 100k)
Taxable interest for individuals: $1,725 (reported on 31.0% of returns)
This zip code:
$1,725
Michigan:
$1,725
(% of AGI for various income ranges: 8.4% for AGIs below $10k, 2.5% for AGIs $10k-25k, 2.0% for AGIs $25k-50k, 1.7% for AGIs $50k-75k, 0.5% for AGIs $75k-100k, 0.6% for AGIs over 100k)
Taxable dividends: $847 (reported on 10.3% of returns)
Here:
$847
State:
$3,420
Net capital gain/loss: +$4,370 (reported on 9.4% of returns)
Here:
+$4,370
State:
+$8,532
Profit/loss from business: +$7,606 (reported on 12.3% of returns)
Here:
+$7,606
State:
+$9,547
(% of AGI for various income ranges: 4.5% for AGIs below $10k, 3.4% for AGIs $10k-25k, 2.7% for AGIs $25k-50k, 7.8% for AGIs $50k-75k)
IRA payment deduction: $538 (reported on 2.3% of returns)
49459:
$538
Michigan:
$2,875
Total itemized deductions: $16,443 (28% of AGI, reported on 12.2% of returns)
Here:
$16,443
State:
$18,509
Here:
27.5% of AGI
State:
20.7% of AGI
Charity contributions deductions: $1,796 (3% of AGI, reported on 9.4% of returns)
Here:
$1,796
State:
$3,365
Here:
3.0% of AGI
State:
3.6% of AGI
Total tax: $3,162 (reported on 60.0% of returns)
49459:
$3,162
State:
$7,691
(% of AGI for various income ranges: 2.1% for AGIs below $10k, 3.2% for AGIs $10k-25k, 5.5% for AGIs $25k-50k, 9.0% for AGIs $50k-75k, 8.7% for AGIs $75k-100k, 14.6% for AGIs over 100k)
Earned income credit: $1,811 (reported on 24.9% of returns)
Here:
$1,811
State:
$1,737
Percentage of individuals using paid preparers for their 2004 taxes: 59.7%
Here:
60%
State:
60%
(% for various income ranges: 54.5% for AGIs below $10k, 58.6% for AGIs $10k-25k, 58.0% for AGIs $25k-50k, 75.9% for AGIs $50k-75k, 61.1% for AGIs $75k-100k, 83.3% for AGIs over 100k)
Household received Food Stamps/SNAP in the past 12 months: 123 Household did not receive Food Stamps/SNAP in the past 12 months: 400
Women who had a birth in the past 12 months: 32 (19 now married, 12 unmarried) Women who did not have a birth in the past 12 months: 267 (120 now married, 147 unmarried)
Housing units in zip code 49459 with a mortgage: 168 (4 second mortgage, 3 both second mortgage and home equity loan) Median monthly owner costs for units with a mortgage: $1,202 Median monthly owner costs for units without a mortgage: $426
Residents with income below the poverty level in 2022:
This zip code:
27.7%
Whole state:
13.4%
Residents with income below 50% of the poverty level in 2022:
This zip code:
12.7%
Whole state:
6.9%
Median number of rooms in houses and condos:
Here:
5.4
State:
6.5
Median number of rooms in apartments:
Here:
5.4
State:
4.3
Notable locations in this zip code not listed on our city pages
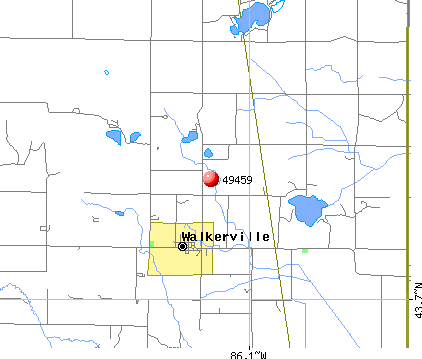
Notable locations in zip code 49459: Pine Haven Camp Ground (A), Walkerville Area Fire and Rescue (B), Walkerville Police Department (C). Display/hide their locations on the map
Cemeteries: Abson Cemetery (1), Walkerville Cemetery (2), Carpenter Cemetery (3), Colfax Cemetery (4), Troy Cemetery (5). Display/hide their locations on the map
Lakes and swamps: Black Lake (A), Campbell Lake (B), Fuller Lake (C), Gilbert Lake (D), Leavitt Lake (E), Little Campbell Lake (F), Little Pebawma Lake (G), Mud Lake (H). Display/hide their locations on the map
In group quarters: 118 (-1 institutionalized population)
Size of family households: 166 2-persons, 76 3-persons, 50 4-persons, 18 5-persons, 7 6-persons, 36 7-or-more-persons
Size of nonfamily households: 129 1-person, 29 2-persons, 7 4-persons
171 married couples with children.
132 single-parent households (14 men, 118 women).
85.3% of residents of 49459 zip code speak English at home.
14.9% of residents speak Spanish at home (58% very well, 4% well, 5% not well, 33% not at all).
0.5% of residents speak other Indo-European language at home (100% very well).
Foreign born population: 139 (8.5%) (13.2% of them are naturalized citizens)
This zip code:
8.5%
Whole state:
6.9%
91%El Salvador
24%Honduras
5%Eritrea
3%Serbia
11%American
10%English
9%German
8%Irish
1%European
1%Lithuanian
1%Polish
Year of entry for the foreign-born population
1022010 or later
272000 to 2009
81990 to 1999
20Before 1990
Facilities with environmental interests located in this zip code:
HOME TOWN TAVERN (161 MAIN ST. in WALKERVILLE, MI)
(Integrated Compliance Information System) - ICIS-05-2005-4833, ENFORCEMENT/COMPLIANCE ACTIVITY FORMAL ENFORCEMENT ACTION (Integrated Compliance Information System) - ICIS-05-2005-4833, ENFORCEMENT/COMPLIANCE ACTIVITY Business SIC classification: EATING PLACES
Housing units lacking complete plumbing facilities: 7.1% Housing units lacking complete kitchen facilities: 4.9%
47.6%Bottled, tank, or LP gas
26.8%Wood
11.0%Electricity
7.3%Other fuel
4.5%Fuel oil, kerosene, etc.
2.6%Utility gas
0.8%No fuel used
Population in 1990: 309. Population change in the 1990s: +1,150 (+372.2%).
Place of birth for U.S.-born residents:
This state: 1,277
Northeast: 21
Midwest: 71
South: 92
West: 26
56% of the 49459 zip code residents lived in the same house 5 years ago. Out of people who lived in different houses, 41% lived in this county. Out of people who lived in different counties, 50% lived in Michigan.
91% of the 49459 zip code residents lived in the same house 1 year ago. Out of people who lived in different houses, 49% moved from this county. Out of people who lived in different houses, 43% moved from different county within same state. Out of people who lived in different houses, 4% moved from different state.
Private vs. public school enrollment:
Students in private schools in grades 1 to 8 (elementary and middle school): 25
Here:
15.0%
Michigan:
12.4%
Students in private schools in grades 9 to 12 (high school): 5
Here:
8.2%
Michigan:
9.8%
Students in private undergraduate colleges: 1
Here:
15.4%
Michigan:
14.9%
Occupation by median earnings in the past 12 months ($)
91,339Health diagnosing and treating practitioners and other technical occupations
61,685Health technologists and technicians
56,054Management occupations
49,857Construction and extraction occupations
41,965Transportation occupations
40,203Production occupations
Companies with federal contracts located in this zip code:
CHASE FARMS, INC (6362 N 192ND AVE in WALKERVILLE, MI; small business) 50 employees, $5800000 revenue. : $3,103,000 in 9 contractsfrom 2000 to 2002
Contracts for Fruits and Vegetables, Dairy Foods and Eggs by Agricultural Marketing Service (disused code) Signed by year:2000: $622,000; 2001: $1,793,000; 2002: $688,000; 2003: $0; 2004: $0; 2005: $0; 2006: $0.
Biggest contracts:
$576,000 with Agricultural Marketing Service (disused code) for Fruits and Vegetables. Signed on 2001-07-15. Completion date: 2001-12-15.
$515,000, same as above.Signed on 2001-09-15. Completion date: 2002-02-15.
$412,000, same as above.Signed on 2001-01-15. Completion date: 2001-04-15.
$345,000 with Agricultural Marketing Service (disused code) for Dairy Foods and Eggs. Signed on 2000-07-15. Completion date: 2000-12-15.
Top industries in this zip code by the number of employees in 2005:
Administrative and Support and Waste Management and Remediation Services: Employment Placement Agencies (20-49: 1)
Real Estate and Rental and Leasing: Lessors of Miniwarehouses and Self-Storage Units (10-19: 1)
Construction: Power and Communication Line and Related Structures Construction (10-19: 1)
Accommodation and Food Services: Full-Service Restaurants (5-9: 1, 1-4: 1)
Real Estate and Rental and Leasing: Lessors of Residential Buildings and Dwellings (5-9: 1)
Construction: Water and Sewer Line and Related Structures Construction (5-9: 1)
Health Care and Social Assistance: Child Day Care Services (1-4: 2)
People in group quarters in 2010:
13 people in group homes intended for adults
People in group quarters in 2000:
39 people in homes for abused, dependent, and neglected children
18 people in agriculture workers' dormitories on farms
12 people in unknown juvenile institutions
2002 - 2018 National Fire Incident Reporting System (NFIRS) incidents
According to the data from the years 2002 - 2018 the average number of fire incidents per year is 9. The highest number of reported fire incidents - 21 took place in 2018, and the least - 0 in 2014. The data has a rising trend.
When looking into fire subcategories, the most incidents belonged to: Structure Fires (46.1%), and Outside Fires (37.5%).
Fire incident types reported to NFIRS in Zip Code 49459


 Nearest zip codes: 49421, 49420, 49458, 49405, 49402, 49309.


 According to the data from the years 2002 - 2018 the average number of fire incidents per year is 9. The highest number of reported fire incidents - 21 took place in 2018, and the least - 0 in 2014. The data has a rising trend.
 When looking into fire subcategories, the most incidents belonged to: Structure Fires (46.1%), and Outside Fires (37.5%).