Estimated zip code population in 2022: 10,826 Zip code population in 2010: 9,410 Zip code population in 2000: 7,817
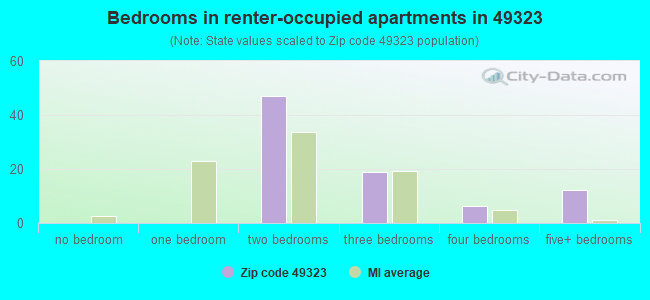
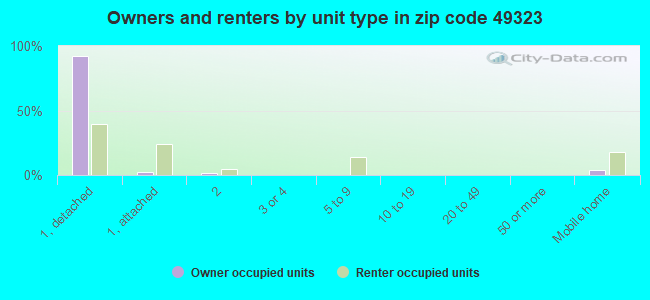
Houses and condos: 3,867 Renter-occupied apartments: 83
% of renters here:
2%
State:
27%
March 2022 cost of living index in zip code 49323: 82.4 (low, U.S. average is 100)
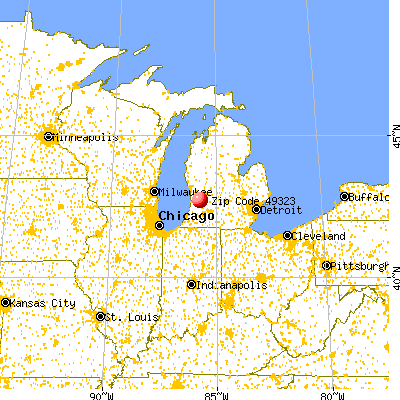
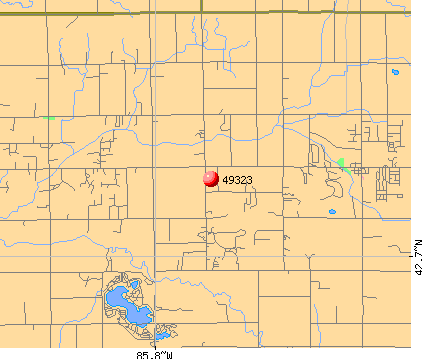
Land area: 49.1 sq. mi. Water area: 0.2 sq. mi.
Population density: 221 people per square mile
(very low).
OSM Map
General Map
Google Map
MSN Map
OSM Map
General Map
Google Map
MSN Map
OSM Map
General Map
Google Map
MSN Map
OSM Map
General Map
Google Map
MSN Map
Please wait while loading the map...
Real estate property taxes paid for housing units in 2022:
This zip code:
1.0% ($2,754)
Michigan:
1.2% ($2,746)
Median real estate property taxes paid for housing units with mortgages in 2022: $2,764 (1.0%) Median real estate property taxes paid for housing units with no mortgage in 2022: $2,764 (1.0%)
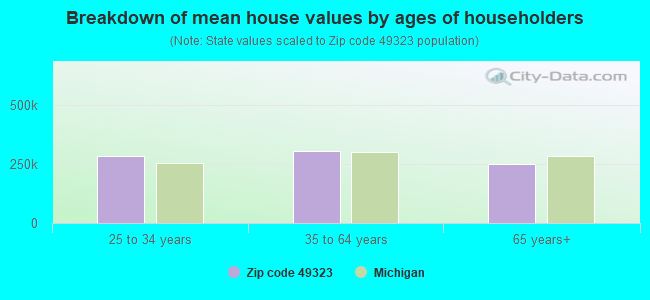
Estimated median house/condo value in 2022: $284,657
49323:
$284,657
Michigan:
$224,400
According to our research of Michigan and other state lists, there were 20 registered sex offenders living in 49323 zip code as of May 24, 2024. The ratio of all residents to sex offenders in zip code 49323 is 500 to 1. The ratio of registered sex offenders to all residents in this zip code is lower than the state average.
Median resident age:
This zip code:
36.5 years
Michigan median age:
40.3 years
Average household size:
This zip code:
2.9 people
Michigan:
2.4 people
Averages for the 2020 tax year for zip code 49323, filed in 2021:
Average Adjusted Gross Income (AGI) in 2020: $67,279 (Individual Income Tax Returns)
Here:
$67,279
State:
$68,945
Salary/wage: $60,283 (reported on 86.2% of returns)
Here:
$60,283
State:
$57,142
(% of AGI for various income ranges: 1132.0% for AGIs below $25k, 3516.2% for AGIs $25k-50k, 6682.6% for AGIs $50k-75k, 9451.6% for AGIs $75k-100k, 17165.1% for AGIs $100k-200k, 44744.0% for AGIs over 200k)
Taxable interest for individuals: $673 (reported on 40.9% of returns)
This zip code:
$673
Michigan:
$1,630
(% of AGI for various income ranges: 20.2% for AGIs below $25k, 20.0% for AGIs $25k-50k, 27.1% for AGIs $50k-75k, 26.7% for AGIs $75k-100k, 72.6% for AGIs $100k-200k, 540.0% for AGIs over 200k)
Ordinary dividends: $2,165 (reported on 17.3% of returns)
Here:
$2,165
State:
$6,972
(% of AGI for various income ranges: 17.7% for AGIs below $25k, 24.8% for AGIs $25k-50k, 32.6% for AGIs $50k-75k, 30.4% for AGIs $75k-100k, 86.4% for AGIs $100k-200k, 1190.0% for AGIs over 200k)
Net capital gain/loss in AGI: +$7,109 (reported on 15.4% of returns)
Here:
+$7,109
State:
+$20,064
(% of AGI for various income ranges: 9.8% for AGIs below $25k, 19.4% for AGIs $25k-50k, 69.2% for AGIs $50k-75k, 111.8% for AGIs $75k-100k, 293.3% for AGIs $100k-200k, 4658.0% for AGIs over 200k)
Profit/loss from business: +$13,345 (reported on 14.6% of returns)
Here:
+$13,345
State:
+$11,172
(% of AGI for various income ranges: 100.4% for AGIs below $25k, 160.1% for AGIs $25k-50k, 296.0% for AGIs $50k-75k, 369.8% for AGIs $75k-100k, 425.7% for AGIs $100k-200k, 2222.0% for AGIs over 200k)
Taxable individual retirement arrangement distribution: $16,752 (reported on 9.5% of returns)
49323:
$16,752
Michigan:
$19,803
(% of AGI for various income ranges: 80.9% for AGIs below $25k, 129.5% for AGIs $25k-50k, 164.8% for AGIs $50k-75k, 263.3% for AGIs $75k-100k, 603.6% for AGIs $100k-200k)
Total itemized deductions: $28,843 (reported on 4.3% of returns)
Here:
$28,843
State:
$34,117
(% of AGI for various income ranges: 193.7% for AGIs $50k-75k, 113.7% for AGIs $75k-100k, 362.3% for AGIs $100k-200k, 4178.0% for AGIs over 200k)
Charity contributions: $13,425 (reported on 3.3% of returns)
Here:
$13,425
State:
$13,548
(% of AGI for various income ranges: 38.5% for AGIs $50k-75k, 135.6% for AGIs $100k-200k, 2164.0% for AGIs over 200k)
Taxes paid: $7,790 (reported on 4.3% of returns)
49323:
$7,790
State:
$7,972
(% of AGI for various income ranges: 47.1% for AGIs $50k-75k, 40.6% for AGIs $75k-100k, 102.0% for AGIs $100k-200k, 1046.0% for AGIs over 200k)
Earned income credit: $2,085 (reported on 8.0% of returns)
Here:
$2,085
State:
$2,251
(% of AGI for various income ranges: 51.5% for AGIs below $25k, 48.3% for AGIs $25k-50k)
Percentage of individuals using paid preparers for their 2020 taxes: 94.0%
Here:
94%
State:
93%
(% for various income ranges: 92.2% for AGIs below $25k, 93.1% for AGIs $25k-50k, 95.2% for AGIs $50k-75k, 93.9% for AGIs $75k-100k, 95.8% for AGIs $100k-200k, 100.0% for AGIs over 200k)
Averages for the 2012 tax year for zip code 49323, filed in 2013:
Average Adjusted Gross Income (AGI) in 2012: $53,309 (Individual Income Tax Returns)
Here:
$53,309
State:
$55,609
Salary/wage: $46,971 (reported on 88.6% of returns)
Here:
$46,971
State:
$46,782
(% of AGI for various income ranges: 73.1% for AGIs below $25k, 80.8% for AGIs $25k-50k, 85.2% for AGIs $50k-75k, 87.0% for AGIs $75k-100k, 83.7% for AGIs $100k-200k, 34.8% for AGIs over 200k)
Taxable interest for individuals: $662 (reported on 38.8% of returns)
This zip code:
$662
Michigan:
$1,491
(% of AGI for various income ranges: 1.4% for AGIs below $25k, 0.6% for AGIs $25k-50k, 0.3% for AGIs $50k-75k, 0.3% for AGIs $75k-100k, 0.3% for AGIs $100k-200k, 0.7% for AGIs over 200k)
Ordinary dividends: $2,775 (reported on 16.4% of returns)
Here:
$2,775
State:
$6,225
(% of AGI for various income ranges: 1.1% for AGIs below $25k, 0.4% for AGIs $25k-50k, 0.3% for AGIs $50k-75k, 0.3% for AGIs $75k-100k, 0.8% for AGIs $100k-200k, 3.5% for AGIs over 200k)
Net capital gain/loss in AGI: +$2,902 (reported on 11.6% of returns)
Here:
+$2,902
State:
+$9,326
(% of AGI for various income ranges: 0.2% for AGIs $50k-75k, 0.4% for AGIs $75k-100k, 1.1% for AGIs $100k-200k, 2.7% for AGIs over 200k)
Profit/loss from business: +$8,883 (reported on 14.8% of returns)
Here:
+$8,883
State:
+$11,523
(% of AGI for various income ranges: 7.6% for AGIs below $25k, 3.5% for AGIs $25k-50k, 2.1% for AGIs $50k-75k, 1.9% for AGIs $75k-100k, 2.3% for AGIs $100k-200k)
Taxable individual retirement arrangement distribution: $11,483 (reported on 9.6% of returns)
49323:
$11,483
Michigan:
$15,298
(% of AGI for various income ranges: 3.7% for AGIs below $25k, 2.4% for AGIs $25k-50k, 1.9% for AGIs $50k-75k, 2.2% for AGIs $75k-100k, 2.4% for AGIs $100k-200k)
Total itemized deductions: $17,690 (19% of AGI, reported on 32.6% of returns)
Here:
$17,690
State:
$21,628
Here:
19.3% of AGI
State:
18.4% of AGI
(% of AGI for various income ranges: 7.1% for AGIs below $25k, 9.2% for AGIs $25k-50k, 11.1% for AGIs $50k-75k, 11.4% for AGIs $75k-100k, 12.8% for AGIs $100k-200k, 10.1% for AGIs over 200k)
Charity contributions: $3,521 (reported on 26.0% of returns)
Here:
$3,521
State:
$4,225
(% of AGI for various income ranges: 0.7% for AGIs below $25k, 1.2% for AGIs $25k-50k, 1.8% for AGIs $50k-75k, 1.8% for AGIs $75k-100k, 2.4% for AGIs $100k-200k, 1.4% for AGIs over 200k)
Taxes paid: $5,976 (reported on 32.6% of returns)
49323:
$5,976
State:
$8,327
(% of AGI for various income ranges: 1.3% for AGIs below $25k, 2.5% for AGIs $25k-50k, 3.4% for AGIs $50k-75k, 4.1% for AGIs $75k-100k, 5.1% for AGIs $100k-200k, 3.9% for AGIs over 200k)
Earned income credit: $2,025 (reported on 12.8% of returns)
Here:
$2,025
State:
$2,306
(% of AGI for various income ranges: 3.9% for AGIs below $25k, 1.3% for AGIs $25k-50k)
Percentage of individuals using paid preparers for their 2012 taxes: 56.4%
Here:
56%
State:
57%
(% for various income ranges: 54.0% for AGIs below $25k, 57.4% for AGIs $25k-50k, 56.0% for AGIs $50k-75k, 59.6% for AGIs $75k-100k, 56.1% for AGIs $100k-200k, 80.0% for AGIs over 200k)
Averages for the 2004 tax year for zip code 49323, filed in 2005:
Average Adjusted Gross Income (AGI) in 2004: $44,774 (Individual Income Tax Returns)
Here:
$44,774
State:
$48,204
Salary/wage: $42,580 (reported on 89.6% of returns)
Here:
$42,580
State:
$42,791
(% of AGI for various income ranges: 128.8% for AGIs below $10k, 73.2% for AGIs $10k-25k, 86.9% for AGIs $25k-50k, 89.5% for AGIs $50k-75k, 89.1% for AGIs $75k-100k, 73.4% for AGIs over 100k)
Taxable interest for individuals: $901 (reported on 46.2% of returns)
This zip code:
$901
Michigan:
$1,725
(% of AGI for various income ranges: 6.1% for AGIs below $10k, 2.6% for AGIs $10k-25k, 0.6% for AGIs $25k-50k, 0.5% for AGIs $50k-75k, 0.5% for AGIs $75k-100k, 1.5% for AGIs over 100k)
Taxable dividends: $904 (reported on 20.6% of returns)
Here:
$904
State:
$3,420
(% of AGI for various income ranges: 2.3% for AGIs below $10k, 1.0% for AGIs $10k-25k, 0.3% for AGIs $25k-50k, 0.3% for AGIs $50k-75k, 0.2% for AGIs $75k-100k, 0.6% for AGIs over 100k)
Net capital gain/loss: +$4,418 (reported on 13.7% of returns)
Here:
+$4,418
State:
+$8,532
(% of AGI for various income ranges: 0.8% for AGIs below $10k, 0.7% for AGIs $10k-25k, 0.7% for AGIs $25k-50k, 0.8% for AGIs $50k-75k, 1.3% for AGIs $75k-100k, 3.2% for AGIs over 100k)
Profit/loss from business: +$6,554 (reported on 16.2% of returns)
Here:
+$6,554
State:
+$9,547
(% of AGI for various income ranges: -0.1% for AGIs below $10k, 7.5% for AGIs $10k-25k, 2.8% for AGIs $25k-50k, 2.1% for AGIs $50k-75k, 2.5% for AGIs $75k-100k, 0.5% for AGIs over 100k)
IRA payment deduction: $2,689 (reported on 2.6% of returns)
49323:
$2,689
Michigan:
$2,875
(% of AGI for various income ranges: 0.2% for AGIs $10k-25k, 0.3% for AGIs $25k-50k, 0.1% for AGIs $50k-75k, 0.2% for AGIs $75k-100k)
Self-employed pension: $6,167 (reported on 0.5% of returns)
Here:
$6,167
Michigan:
$13,826
Total itemized deductions: $15,334 (22% of AGI, reported on 42.6% of returns)
Here:
$15,334
State:
$18,509
Here:
21.8% of AGI
State:
20.7% of AGI
(% of AGI for various income ranges: 10.2% for AGIs below $10k, 10.1% for AGIs $10k-25k, 14.1% for AGIs $25k-50k, 15.5% for AGIs $50k-75k, 15.9% for AGIs $75k-100k, 14.1% for AGIs over 100k)
Charity contributions deductions: $3,009 (4% of AGI, reported on 35.4% of returns)
Here:
$3,009
State:
$3,365
Here:
4.1% of AGI
State:
3.6% of AGI
(% of AGI for various income ranges: 1.1% for AGIs below $10k, 1.1% for AGIs $10k-25k, 1.6% for AGIs $25k-50k, 2.6% for AGIs $50k-75k, 2.4% for AGIs $75k-100k, 3.3% for AGIs over 100k)
Total tax: $5,239 (reported on 77.8% of returns)
49323:
$5,239
State:
$7,691
(% of AGI for various income ranges: 3.2% for AGIs below $10k, 4.7% for AGIs $10k-25k, 6.3% for AGIs $25k-50k, 7.2% for AGIs $50k-75k, 9.6% for AGIs $75k-100k, 16.3% for AGIs over 100k)
Earned income credit: $1,601 (reported on 8.8% of returns)
Here:
$1,601
State:
$1,737
Percentage of individuals using paid preparers for their 2004 taxes: 59.2%
Here:
59%
State:
60%
(% for various income ranges: 50.1% for AGIs below $10k, 60.4% for AGIs $10k-25k, 60.0% for AGIs $25k-50k, 62.9% for AGIs $50k-75k, 61.1% for AGIs $75k-100k, 64.6% for AGIs over 100k)
Household received Food Stamps/SNAP in the past 12 months: 67 Household did not receive Food Stamps/SNAP in the past 12 months: 3,653
Women who had a birth in the past 12 months: 129 (120 now married, 11 unmarried) Women who did not have a birth in the past 12 months: 2,343 (1,194 now married, 1,142 unmarried)
Housing units in zip code 49323 with a mortgage: 2,484 (266 second mortgage, 236 both second mortgage and home equity loan) Houses without a mortgage: 45
Median monthly owner costs for units with a mortgage: $1,318 Median monthly owner costs for units without a mortgage: $490
Residents with income below the poverty level in 2022:
This zip code:
4.1%
Whole state:
13.4%
Residents with income below 50% of the poverty level in 2022:
This zip code:
2.4%
Whole state:
6.9%
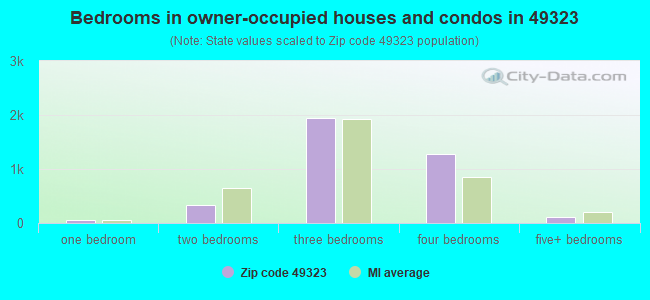
Median number of rooms in houses and condos:
Here:
6.8
State:
6.5
Median number of rooms in apartments:
Here:
5.5
State:
4.3
Notable locations in this zip code not listed on our city pages
Notable locations in zip code 49323: Hungry Horse Campground (A), Lake Monterey Golf Course (B), Wayland Area Ambulance Service (C), Salem Township Library (D), Salem Township Fire Department (E), Dorr Township Fire Department (F). Display/hide their locations on the map
Churches in zip code 49323 include: Saint Mary's Church (A), Market Street Church (B), Saint Stanislaus Church (C), Burnips United Methodist Church (D), Burnips Wesleyan Church (E), Open Door Reformed Church (F), Saint Peter's Lutheran Church (G), Ephinany Lutheran Church (H), Dorr Christian Reformed Church (I). Display/hide their locations on the map
Cemeteries: Burnips Cemetery (1), Tanner Cemetery (2), Saint Stanislaus' Catholic Cemetery (3), Dorr Cemetery (4), Saint Mary's Catholic Church of New Salem Cemetery (5). Display/hide their locations on the map
Streams, rivers, and creeks: Pigeon Creek (A), Black Creek (B), Little Rabbit River (C), Dorr and Byron Drain (D), Red Run (E), Winks Branch (F). Display/hide their locations on the map
In group quarters: 4 (-1 institutionalized population)
Size of family households: 1,231 2-persons, 457 3-persons, 616 4-persons, 601 5-persons, 87 6-persons, 6 7-or-more-persons
Size of nonfamily households: 466 1-person, 221 2-persons, 36 4-persons
1,975 married couples with children.
938 single-parent households (798 men, 140 women).
97.7% of residents of 49323 zip code speak English at home.
0.3% of residents speak Spanish at home (70% very well, 27% well, 3% not at all).
0.1% of residents speak other Indo-European language at home (100% very well).
0.8% of residents speak Asian or Pacific Island language at home (21% very well, 79% well).
Foreign born population: 64 (0.6%) (22.1% of them are naturalized citizens)
This zip code:
0.6%
Whole state:
6.9%
80%Taiwan
14%Singapore
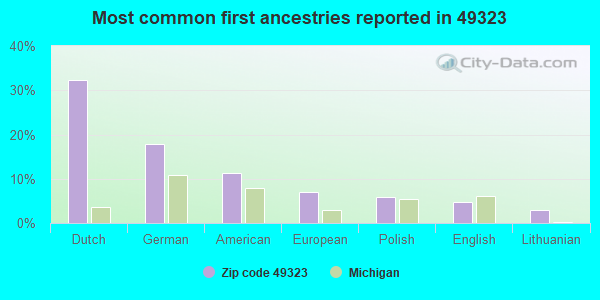
32%Dutch
18%German
11%American
7%European
6%Polish
5%English
3%Lithuanian
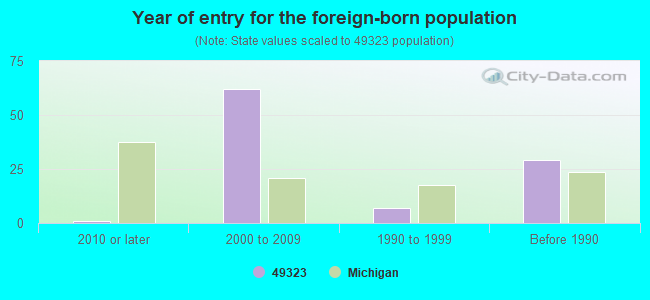
Year of entry for the foreign-born population
12010 or later
622000 to 2009
71990 to 1999
29Before 1990
Public elementary/middle schools in in zip code 49323 not listed on the city page:
Private elementary/middle school in in this zip code not listed on the city page:
ST STANISLAUS SCHOOL (Students: 94, Location: 1861 136TH AVE, Grades: PK-8)
Facilities with environmental interests located in this zip code:
DORR SCHOOL (4159 18TH STREET in DORR, MI)
(National Center for Education Statistics) - STATE ID-00936 Organizations: WAYLAND UNION SCHOOLS (SCHOOL DISTRICT)
DORR STANDARD SERVICE 24834 (1831 142ND AVE in DORR, MI)
(Resource Conservation and Recovery Act (tracking hazardous waste)) Organizations: AMOCO OIL COMPANY (CONTACT/OWNER)
, BP PRODUCTS NORTH AMERICA INC (CONTACT/OWNER)
MI DEPT/ENVIRONMENTAL QUALITY (9TH ST & 143RD ST in DORR, MI)
(Resource Conservation and Recovery Act (tracking hazardous waste)) Alternative names: MI DEPT/DEQ (E)
DORR TOWNSHIP OFFICES (4194 18TH ST in DORR, MI)
(Resource Conservation and Recovery Act (tracking hazardous waste))
DORR TOWNSHIP DUMP (140TH ST B/T 21ST & 18TH in DORR, MI)
CRITERIA AND HAZARDOUS AIR POLLUTANT INVENTORY (Inventory of air pollution sources) Business SIC classification: REFUSE SYSTEMS Business NAICS classification: SOLID WASTE LANDFILL.
Housing units lacking complete plumbing facilities: 1.4% Housing units lacking complete kitchen facilities: 1.4%
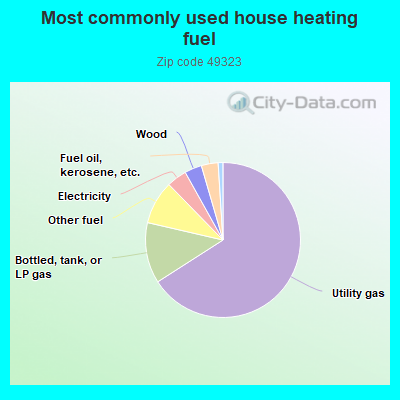
66.0%Utility gas
12.7%Bottled, tank, or LP gas
9.1%Other fuel
4.2%Electricity
3.6%Wood
3.5%Fuel oil, kerosene, etc.
1.0%No fuel used
Population in 1990: 7,782. Population change in the 1990s: +35 (+0.4%).
Place of birth for U.S.-born residents:
This state: 9,869
Northeast: 103
Midwest: 364
South: 145
West: 223
59% of the 49323 zip code residents lived in the same house 5 years ago. Out of people who lived in different houses, 46% lived in this county. Out of people who lived in different counties, 50% lived in Michigan.
96% of the 49323 zip code residents lived in the same house 1 year ago. Out of people who lived in different houses, 27% moved from this county. Out of people who lived in different houses, 77% moved from different county within same state.
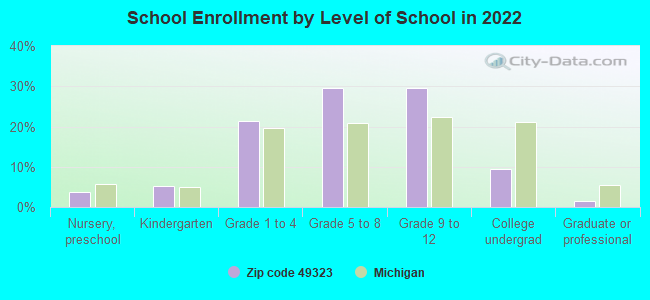
Private vs. public school enrollment:
Students in private schools in grades 1 to 8 (elementary and middle school): 207
Here:
14.0%
Michigan:
12.4%
Students in private schools in grades 9 to 12 (high school): 150
Here:
17.4%
Michigan:
9.8%
Students in private undergraduate colleges: 32
Here:
11.7%
Michigan:
14.9%
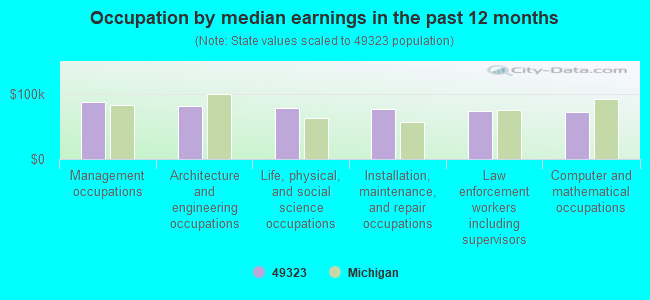
Occupation by median earnings in the past 12 months ($)
87,548Management occupations
81,023Architecture and engineering occupations
77,932Life, physical, and social science occupations
76,721Installation, maintenance, and repair occupations
74,247Law enforcement workers including supervisors
71,472Computer and mathematical occupations
Top industries in this zip code by the number of employees in 2005:
Detailed PMIC statistics for the following Tracts:0303.00
, 0304.01
2002 - 2018 National Fire Incident Reporting System (NFIRS) incidents
According to the data from the years 2002 - 2018 the average number of fire incidents per year is 31. The highest number of fires - 48 took place in 2004, and the least - 24 in 2005. The data has a decreasing trend.
When looking into fire subcategories, the most reports belonged to: Structure Fires (44.2%), and Outside Fires (34.3%).
Fire incident types reported to NFIRS in Zip Code 49323


 Nearest zip codes: 49315, 49328, 49335, 49418, 49426, 49519.


 (Location: 2163 142ND AVE, Grades: KG-5)


 According to the data from the years 2002 - 2018 the average number of fire incidents per year is 31. The highest number of fires - 48 took place in 2004, and the least - 24 in 2005. The data has a decreasing trend.
 When looking into fire subcategories, the most reports belonged to: Structure Fires (44.2%), and Outside Fires (34.3%).