Estimated zip code population in 2022: 40,314 Zip code population in 2010: 33,244 Zip code population in 2000: 27,015
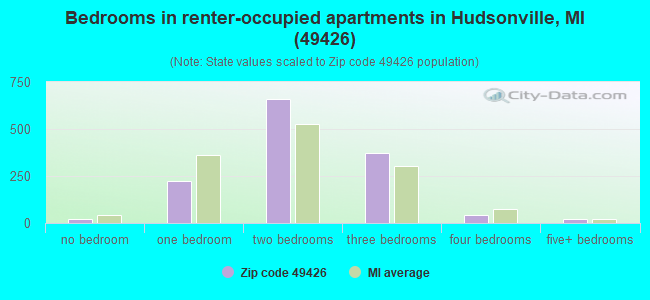
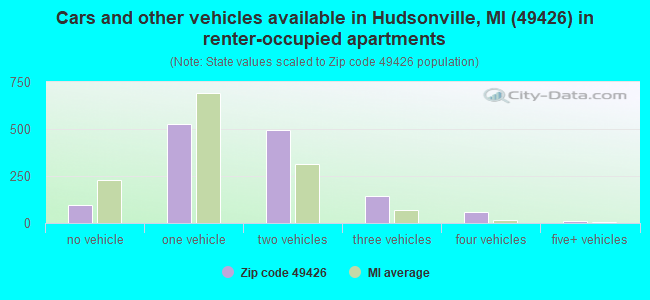
Houses and condos: 13,950 Renter-occupied apartments: 1,340
% of renters here:
10%
State:
27%
March 2022 cost of living index in zip code 49426: 85.0 (less than average, U.S. average is 100)
Land area: 62.5 sq. mi. Water area: 0.2 sq. mi.
Population density: 645 people per square mile
(low).
OSM Map
General Map
Google Map
MSN Map
OSM Map
General Map
Google Map
MSN Map
OSM Map
General Map
Google Map
MSN Map
OSM Map
General Map
Google Map
MSN Map
Please wait while loading the map...
Real estate property taxes paid for housing units in 2022:
This zip code:
0.9% ($3,263)
Michigan:
1.2% ($2,746)
Median real estate property taxes paid for housing units with mortgages in 2022: $3,490 (1.0%) Median real estate property taxes paid for housing units with no mortgage in 2022: $2,899 (0.9%)
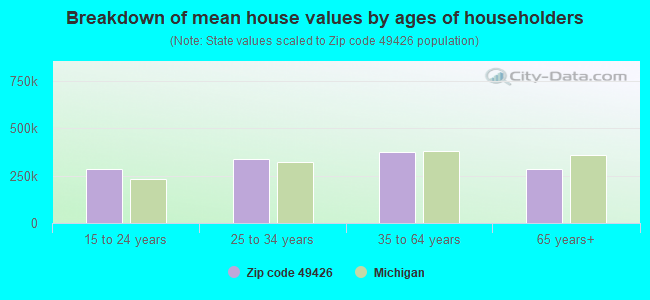
Estimated median house/condo value in 2022: $345,583
49426:
$345,583
Michigan:
$224,400
According to our research of Michigan and other state lists, there were 37 registered sex offenders living in 49426 zip code as of July 16, 2024. The ratio of all residents to sex offenders in zip code 49426 is 954 to 1. The ratio of registered sex offenders to all residents in this zip code is much lower than the state average.
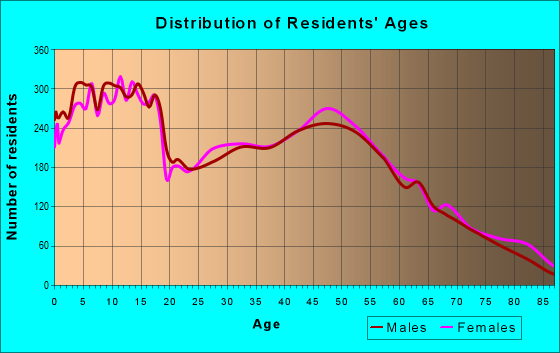
Median resident age:
This zip code:
35.0 years
Michigan median age:
40.3 years
Average household size:
This zip code:
2.9 people
Michigan:
2.4 people
Averages for the 2020 tax year for zip code 49426, filed in 2021:
Average Adjusted Gross Income (AGI) in 2020: $84,786 (Individual Income Tax Returns)
Here:
$84,786
State:
$68,945
Salary/wage: $67,553 (reported on 85.6% of returns)
Here:
$67,553
State:
$57,142
(% of AGI for various income ranges: 1142.4% for AGIs below $25k, 3482.7% for AGIs $25k-50k, 6247.2% for AGIs $50k-75k, 9441.0% for AGIs $75k-100k, 17643.4% for AGIs $100k-200k, 60486.9% for AGIs over 200k)
Taxable interest for individuals: $1,255 (reported on 47.9% of returns)
This zip code:
$1,255
Michigan:
$1,630
(% of AGI for various income ranges: 20.6% for AGIs below $25k, 27.2% for AGIs $25k-50k, 46.9% for AGIs $50k-75k, 60.6% for AGIs $75k-100k, 100.2% for AGIs $100k-200k, 1419.5% for AGIs over 200k)
Ordinary dividends: $3,489 (reported on 24.8% of returns)
Here:
$3,489
State:
$6,972
(% of AGI for various income ranges: 33.5% for AGIs below $25k, 43.1% for AGIs $25k-50k, 96.5% for AGIs $50k-75k, 104.9% for AGIs $75k-100k, 188.2% for AGIs $100k-200k, 1467.2% for AGIs over 200k)
Net capital gain/loss in AGI: +$23,330 (reported on 23.4% of returns)
Here:
+$23,330
State:
+$20,064
(% of AGI for various income ranges: 13.5% for AGIs below $25k, 48.3% for AGIs $25k-50k, 104.1% for AGIs $50k-75k, 160.1% for AGIs $75k-100k, 440.7% for AGIs $100k-200k, 22160.5% for AGIs over 200k)
Profit/loss from business: +$16,683 (reported on 16.1% of returns)
Here:
+$16,683
State:
+$11,172
(% of AGI for various income ranges: 66.9% for AGIs below $25k, 163.7% for AGIs $25k-50k, 322.7% for AGIs $50k-75k, 403.0% for AGIs $75k-100k, 664.1% for AGIs $100k-200k, 3688.7% for AGIs over 200k)
Taxable individual retirement arrangement distribution: $17,482 (reported on 12.0% of returns)
49426:
$17,482
Michigan:
$19,803
(% of AGI for various income ranges: 126.5% for AGIs below $25k, 200.3% for AGIs $25k-50k, 300.2% for AGIs $50k-75k, 359.2% for AGIs $75k-100k, 504.5% for AGIs $100k-200k, 1364.4% for AGIs over 200k)
Self-employed (Keogh) retirement plans: $18,973 (reported on 0.6% of returns)
49426:
$18,973
Michigan:
$25,132
(% of AGI for various income ranges: 5.3% for AGIs $25k-50k, 26.4% for AGIs $100k-200k, 323.8% for AGIs over 200k)
Total itemized deductions: $41,156 (reported on 9.0% of returns)
Here:
$41,156
State:
$34,117
(% of AGI for various income ranges: 36.8% for AGIs below $25k, 88.7% for AGIs $25k-50k, 226.9% for AGIs $50k-75k, 345.6% for AGIs $75k-100k, 768.7% for AGIs $100k-200k, 9606.7% for AGIs over 200k)
Charity contributions: $25,341 (reported on 8.0% of returns)
Here:
$25,341
State:
$13,548
(% of AGI for various income ranges: 4.4% for AGIs below $25k, 19.5% for AGIs $25k-50k, 64.6% for AGIs $50k-75k, 106.0% for AGIs $75k-100k, 315.8% for AGIs $100k-200k, 6901.8% for AGIs over 200k)
Taxes paid: $8,392 (reported on 9.0% of returns)
49426:
$8,392
State:
$7,972
(% of AGI for various income ranges: 5.0% for AGIs below $25k, 17.3% for AGIs $25k-50k, 51.4% for AGIs $50k-75k, 90.6% for AGIs $75k-100k, 225.2% for AGIs $100k-200k, 1400.5% for AGIs over 200k)
Earned income credit: $1,932 (reported on 6.3% of returns)
Here:
$1,932
State:
$2,251
(% of AGI for various income ranges: 31.0% for AGIs below $25k, 45.2% for AGIs $25k-50k, 1.7% for AGIs $50k-75k)
Percentage of individuals using paid preparers for their 2020 taxes: 93.9%
Here:
94%
State:
93%
(% for various income ranges: 91.2% for AGIs below $25k, 94.4% for AGIs $25k-50k, 94.8% for AGIs $50k-75k, 94.6% for AGIs $75k-100k, 95.4% for AGIs $100k-200k, 95.5% for AGIs over 200k)
Averages for the 2012 tax year for zip code 49426, filed in 2013:
Average Adjusted Gross Income (AGI) in 2012: $63,190 (Individual Income Tax Returns)
Here:
$63,190
State:
$55,609
Salary/wage: $54,281 (reported on 87.5% of returns)
Here:
$54,281
State:
$46,782
(% of AGI for various income ranges: 76.3% for AGIs below $25k, 78.0% for AGIs $25k-50k, 79.2% for AGIs $50k-75k, 81.2% for AGIs $75k-100k, 82.1% for AGIs $100k-200k, 52.3% for AGIs over 200k)
Taxable interest for individuals: $1,196 (reported on 46.8% of returns)
This zip code:
$1,196
Michigan:
$1,491
(% of AGI for various income ranges: 1.5% for AGIs below $25k, 0.8% for AGIs $25k-50k, 0.7% for AGIs $50k-75k, 0.5% for AGIs $75k-100k, 0.7% for AGIs $100k-200k, 1.7% for AGIs over 200k)
Ordinary dividends: $3,890 (reported on 24.2% of returns)
Here:
$3,890
State:
$6,225
(% of AGI for various income ranges: 2.2% for AGIs below $25k, 1.0% for AGIs $25k-50k, 1.0% for AGIs $50k-75k, 1.0% for AGIs $75k-100k, 0.8% for AGIs $100k-200k, 3.5% for AGIs over 200k)
Net capital gain/loss in AGI: +$6,603 (reported on 19.1% of returns)
Here:
+$6,603
State:
+$9,326
(% of AGI for various income ranges: 0.4% for AGIs $25k-50k, 0.3% for AGIs $50k-75k, 0.6% for AGIs $75k-100k, 1.0% for AGIs $100k-200k, 8.1% for AGIs over 200k)
Profit/loss from business: +$13,979 (reported on 15.7% of returns)
Here:
+$13,979
State:
+$11,523
(% of AGI for various income ranges: 4.5% for AGIs below $25k, 4.2% for AGIs $25k-50k, 3.3% for AGIs $50k-75k, 2.9% for AGIs $75k-100k, 3.5% for AGIs $100k-200k, 3.4% for AGIs over 200k)
Taxable individual retirement arrangement distribution: $13,317 (reported on 12.8% of returns)
49426:
$13,317
Michigan:
$15,298
(% of AGI for various income ranges: 6.7% for AGIs below $25k, 4.0% for AGIs $25k-50k, 3.0% for AGIs $50k-75k, 2.8% for AGIs $75k-100k, 2.4% for AGIs $100k-200k, 0.9% for AGIs over 200k)
Self-employment retirement plans: $16,444 (reported on 0.6% of returns)
49426:
$16,444
Michigan:
$20,834
(% of AGI for various income ranges: 0.2% for AGIs $50k-75k, 0.2% for AGIs $100k-200k, 0.3% for AGIs over 200k)
Total itemized deductions: $21,270 (20% of AGI, reported on 42.2% of returns)
Here:
$21,270
State:
$21,628
Here:
19.9% of AGI
State:
18.4% of AGI
(% of AGI for various income ranges: 11.3% for AGIs below $25k, 11.4% for AGIs $25k-50k, 14.4% for AGIs $50k-75k, 15.2% for AGIs $75k-100k, 15.5% for AGIs $100k-200k, 13.5% for AGIs over 200k)
Charity contributions: $6,614 (reported on 38.2% of returns)
Here:
$6,614
State:
$4,225
(% of AGI for various income ranges: 1.9% for AGIs below $25k, 2.4% for AGIs $25k-50k, 3.3% for AGIs $50k-75k, 3.8% for AGIs $75k-100k, 4.2% for AGIs $100k-200k, 6.0% for AGIs over 200k)
Taxes paid: $7,308 (reported on 42.1% of returns)
49426:
$7,308
State:
$8,327
(% of AGI for various income ranges: 2.2% for AGIs below $25k, 2.9% for AGIs $25k-50k, 4.3% for AGIs $50k-75k, 5.2% for AGIs $75k-100k, 5.9% for AGIs $100k-200k, 5.3% for AGIs over 200k)
Earned income credit: $2,101 (reported on 8.8% of returns)
Here:
$2,101
State:
$2,306
(% of AGI for various income ranges: 3.3% for AGIs below $25k, 1.0% for AGIs $25k-50k)
Percentage of individuals using paid preparers for their 2012 taxes: 54.5%
Here:
54%
State:
57%
(% for various income ranges: 50.2% for AGIs below $25k, 56.7% for AGIs $25k-50k, 56.3% for AGIs $50k-75k, 53.7% for AGIs $75k-100k, 55.1% for AGIs $100k-200k, 81.0% for AGIs over 200k)
Averages for the 2004 tax year for zip code 49426, filed in 2005:
Average Adjusted Gross Income (AGI) in 2004: $54,166 (Individual Income Tax Returns)
Here:
$54,166
State:
$48,204
Salary/wage: $46,471 (reported on 89.1% of returns)
Here:
$46,471
State:
$42,791
(% of AGI for various income ranges: 145.3% for AGIs below $10k, 73.2% for AGIs $10k-25k, 81.0% for AGIs $25k-50k, 84.7% for AGIs $50k-75k, 86.6% for AGIs $75k-100k, 62.6% for AGIs over 100k)
Taxable interest for individuals: $1,669 (reported on 56.0% of returns)
This zip code:
$1,669
Michigan:
$1,725
(% of AGI for various income ranges: 12.8% for AGIs below $10k, 3.2% for AGIs $10k-25k, 1.5% for AGIs $25k-50k, 0.9% for AGIs $50k-75k, 0.9% for AGIs $75k-100k, 2.2% for AGIs over 100k)
Taxable dividends: $2,368 (reported on 30.6% of returns)
Here:
$2,368
State:
$3,420
(% of AGI for various income ranges: 5.4% for AGIs below $10k, 2.4% for AGIs $10k-25k, 1.0% for AGIs $25k-50k, 0.7% for AGIs $50k-75k, 0.5% for AGIs $75k-100k, 2.0% for AGIs over 100k)
Net capital gain/loss: +$9,167 (reported on 23.8% of returns)
Here:
+$9,167
State:
+$8,532
(% of AGI for various income ranges: -1.6% for AGIs below $10k, 0.5% for AGIs $10k-25k, 0.6% for AGIs $25k-50k, 0.7% for AGIs $50k-75k, 1.1% for AGIs $75k-100k, 9.6% for AGIs over 100k)
Profit/loss from business: +$12,479 (reported on 15.9% of returns)
Here:
+$12,479
State:
+$9,547
(% of AGI for various income ranges: 6.0% for AGIs below $10k, 5.3% for AGIs $10k-25k, 4.0% for AGIs $25k-50k, 3.3% for AGIs $50k-75k, 2.7% for AGIs $75k-100k, 4.0% for AGIs over 100k)
IRA payment deduction: $3,314 (reported on 2.8% of returns)
49426:
$3,314
Michigan:
$2,875
(% of AGI for various income ranges: 0.2% for AGIs $10k-25k, 0.3% for AGIs $25k-50k, 0.2% for AGIs $50k-75k, 0.1% for AGIs $75k-100k, 0.1% for AGIs over 100k)
Self-employed pension: $9,519 (reported on 1.0% of returns)
Here:
$9,519
Michigan:
$13,826
(% of AGI for various income ranges: 0.1% for AGIs $25k-50k, 0.1% for AGIs $50k-75k, 0.1% for AGIs $75k-100k, 0.3% for AGIs over 100k)
Total itemized deductions: $18,821 (22% of AGI, reported on 50.0% of returns)
Here:
$18,821
State:
$18,509
Here:
22.3% of AGI
State:
20.7% of AGI
(% of AGI for various income ranges: 18.5% for AGIs below $10k, 15.0% for AGIs $10k-25k, 17.3% for AGIs $25k-50k, 18.9% for AGIs $50k-75k, 18.9% for AGIs $75k-100k, 15.9% for AGIs over 100k)
Charity contributions deductions: $5,945 (7% of AGI, reported on 46.6% of returns)
Here:
$5,945
State:
$3,365
Here:
6.8% of AGI
State:
3.6% of AGI
(% of AGI for various income ranges: 2.1% for AGIs below $10k, 2.9% for AGIs $10k-25k, 3.6% for AGIs $25k-50k, 4.7% for AGIs $50k-75k, 4.9% for AGIs $75k-100k, 6.4% for AGIs over 100k)
Total tax: $7,365 (reported on 79.3% of returns)
49426:
$7,365
State:
$7,691
(% of AGI for various income ranges: 3.5% for AGIs below $10k, 4.7% for AGIs $10k-25k, 6.5% for AGIs $25k-50k, 7.2% for AGIs $50k-75k, 8.8% for AGIs $75k-100k, 16.8% for AGIs over 100k)
Earned income credit: $1,483 (reported on 5.7% of returns)
Here:
$1,483
State:
$1,737
Percentage of individuals using paid preparers for their 2004 taxes: 54.3%
Here:
54%
State:
60%
(% for various income ranges: 43.0% for AGIs below $10k, 51.3% for AGIs $10k-25k, 59.8% for AGIs $25k-50k, 57.4% for AGIs $50k-75k, 53.8% for AGIs $75k-100k, 64.2% for AGIs over 100k)
Likely homosexual households (counted as self-reported same-sex unmarried-partner households)
Lesbian couples: 0.1% of all households
Gay men: 0.0% of all households
Household received Food Stamps/SNAP in the past 12 months: 369 Household did not receive Food Stamps/SNAP in the past 12 months: 13,215
Women who had a birth in the past 12 months: 493 (499 now married, 6 unmarried) Women who did not have a birth in the past 12 months: 8,395 (5,122 now married, 3,231 unmarried)
Housing units in zip code 49426 with a mortgage: 8,143 (1,125 second mortgage, 18 home equity loan, 1,086 both second mortgage and home equity loan) Houses without a mortgage: 190
Median monthly owner costs for units with a mortgage: $1,674 Median monthly owner costs for units without a mortgage: $591
Residents with income below the poverty level in 2022:
This zip code:
3.4%
Whole state:
13.4%
Residents with income below 50% of the poverty level in 2022:
This zip code:
2.1%
Whole state:
6.9%
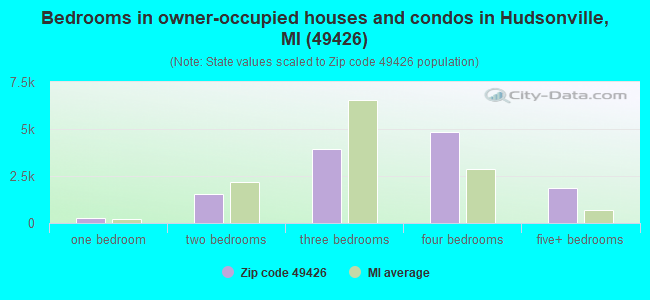
Median number of rooms in houses and condos:
Here:
7.6
State:
6.5
Median number of rooms in apartments:
Here:
4.2
State:
4.3
Notable locations in this zip code not listed on our city pages
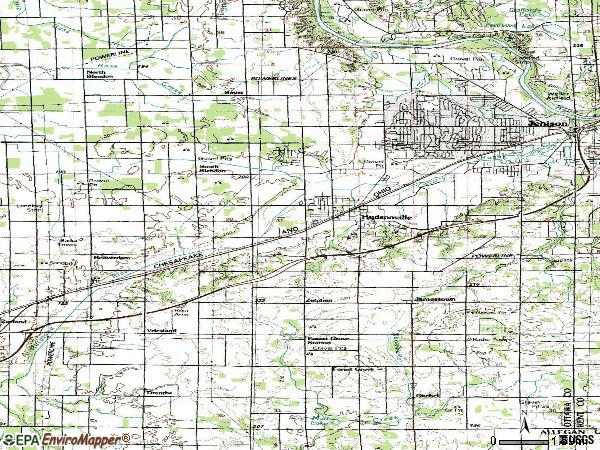
Notable locations in zip code 49426: Hudsonville Station (A), Summergreen Golf Course (B), Hudsonville Fairgrounds (C), Rolling Hills Golf Course (D), Baldwin Oaks Campground (E), Gleneagle Golf Course (F), Blendon Township Fire Department Tyler Street Station (G), Georgetown Township Fire Department Station 3 (H), Jamestown Township Fire Department (I), Patmos Library (J), Hudsonville Library (K), Hudsonville Fire Department (L), Hudsonville Police Department (M), West Living Center (N). Display/hide their locations on the map
Churches in zip code 49426 include: North Blendon Reformed Church (A), Community Church (B), South Blendon Church (C), Church of Christian Liberty (D), Grandville Church of Christ (E), Bauer Seventh-Day Adventist Church (F), Bauer Christian Reformed Church (G), Bauer Community Fellowship Church (H), Beaverdam Christian Church (I). Display/hide their locations on the map
Cemeteries: Jamestown Cemetery (1), Shackhuddle Cemetery (2), Forest Grove Cemetery (3), Zutphen Cemetery (4), Blendon Cemetery (5). Display/hide their locations on the map
Parks in zip code 49426 include: Veterans Park (1), Sunrise Park (2), Hillside Park (3), Hudsonville Nature Center (4), Hughes Park (5), Spring Grove Park (6), Jamestown Reformed Church Historical Marker (7). Display/hide their locations on the map
10,760 married couples with children.
790 single-parent households (245 men, 545 women).
96.0% of residents of 49426 zip code speak English at home.
1.3% of residents speak Spanish at home (100% very well).
1.4% of residents speak other Indo-European language at home (79% very well, 15% well, 6% not well).
0.6% of residents speak Asian or Pacific Island language at home (62% very well, 33% well, 5% not at all).
Foreign born population: 1,467 (3.6%) (80.1% of them are naturalized citizens)
This zip code:
3.6%
Whole state:
6.9%
20%Germany
8%Japan
7%Thailand
6%Afghanistan
5%Guatemala
5%Malaysia
4%Bhutan
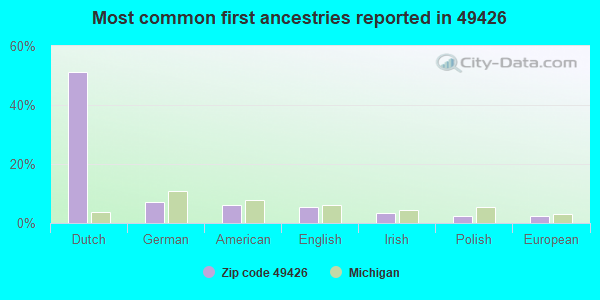
51%Dutch
7%German
6%American
5%English
3%Irish
2%Polish
2%European
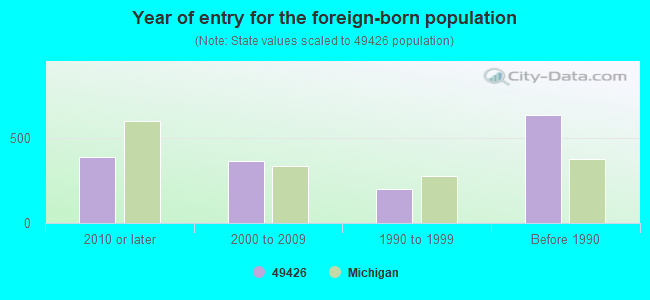
Year of entry for the foreign-born population
3872010 or later
3652000 to 2009
1981990 to 1999
635Before 1990
Major facilities with environmental interests located in this zip code:
ALWARD ELEMENTARY SCHOOL (3811 PORT SHELDON ROAD in HUDSONVILLE, MI)
(National Center for Education Statistics) - STATE ID-00079 Organizations: HUDSONVILLE PUBLIC SCHOOL DISTRICT (SCHOOL DISTRICT)
BALDWIN STREET MIDDLE SCHOOL (3835 BALDWIN STREET in HUDSONVILLE, MI)
(National Center for Education Statistics) - STATE ID-08384 Organizations: HUDSONVILLE PUBLIC SCHOOL DISTRICT (SCHOOL DISTRICT)
BAUER ELEMENTARY SCHOOL (8136 48TH AVENUE in HUDSONVILLE, MI)
(National Center for Education Statistics) - STATE ID-00224 Organizations: HUDSONVILLE PUBLIC SCHOOL DISTRICT (SCHOOL DISTRICT)
MI DEPT/TRANSPORTATION BRIDGE (I-196 OVER 32ND ST in HUDSONVILLE, MI)
(Resource Conservation and Recovery Act (tracking hazardous waste)) Organizations: MICH DEPT OF TRANSPORTATION (CONTACT/OPERATOR)
Alternative names: MIDOT BRIDGE I-196 OVER 32ND ST
FOREST GROVE ELEMENTARY SCHOOL (1645 32ND AVENUE in HUDSONVILLE, MI)
(National Center for Education Statistics) - STATE ID-01263 Organizations: HUDSONVILLE PUBLIC SCHOOL DISTRICT (SCHOOL DISTRICT)
AMERICAN AUTOCOAT INC (3565 HIGHLAND DRIVE in HUDSONVILLE, MI)
AIR SYNTHETIC MINOR (AIRS/AFS) Large Quantity Generators, more that 1000 kg of hazardous waste/month (Resource Conservation and Recovery Act (tracking hazardous waste)) Business SIC classification: MOTOR VEHICLE PARTS AND ACCESSORIES Business NAICS classification: METAL COATING, ENGRAVING (EXCEPT JEWELRY AND SILVERWARE), AND ALLIED SERVICES TO MANUFACTURERS. Organizations: SCOTT S. SKOOG (CONTACT/OWNER)
Housing units lacking complete plumbing facilities: 0.7% Housing units lacking complete kitchen facilities: 1.1%
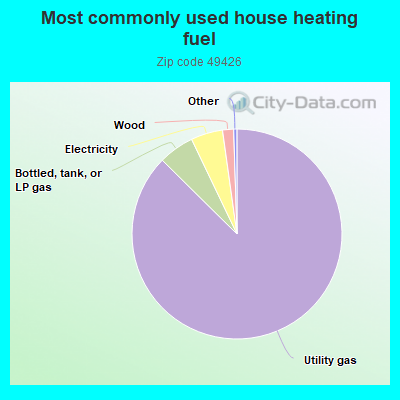
87.4%Utility gas
5.5%Bottled, tank, or LP gas
4.9%Electricity
1.7%Wood
Population in 1990: 20,122. Population change in the 1990s: +6,893 (+34.3%).
Place of birth for U.S.-born residents:
This state: 33,211
Northeast: 1,013
Midwest: 2,563
South: 874
West: 1,041
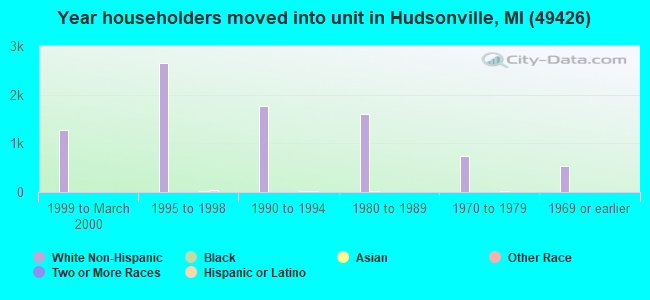
59% of the 49426 zip code residents lived in the same house 5 years ago. Out of people who lived in different houses, 55% lived in this county. Out of people who lived in different counties, 50% lived in Michigan.
93% of the 49426 zip code residents lived in the same house 1 year ago. Out of people who lived in different houses, 34% moved from this county. Out of people who lived in different houses, 51% moved from different county within same state. Out of people who lived in different houses, 12% moved from different state. Out of people who lived in different houses, 5% moved from abroad.
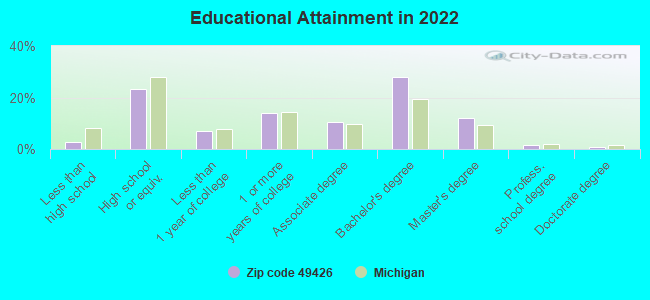
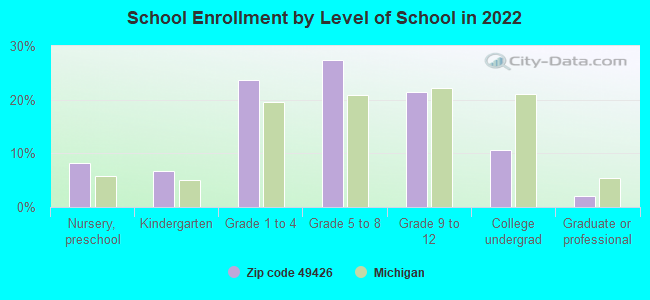
Private vs. public school enrollment:
Students in private schools in grades 1 to 8 (elementary and middle school): 1,358
Here:
23.4%
Michigan:
12.4%
Students in private schools in grades 9 to 12 (high school): 558
Here:
23.0%
Michigan:
9.8%
Students in private undergraduate colleges: 293
Here:
24.7%
Michigan:
14.9%
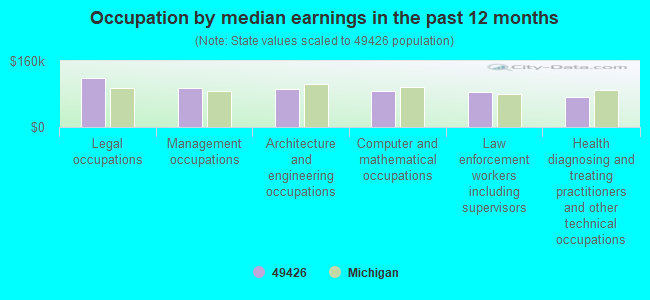
Occupation by median earnings in the past 12 months ($)
119,255Legal occupations
94,059Management occupations
92,352Architecture and engineering occupations
87,099Computer and mathematical occupations
84,214Law enforcement workers including supervisors
73,851Health diagnosing and treating practitioners and other technical occupations
Companies with federal contracts located in this zip code:
ESPEC NORTH AMERICA, INC (4141 CENTRAL PARKWAY in HUDSONVILLE, MI; small business) : $377,393 in 17 contractsfrom 2002 to 2006
Contracts for Other Defense -- Applied Research and Exploratory Development (R&D), Air Conditioning Equipment, Electrical and Electronic Properties Measuring and Testing Instruments, Guns, through 30 mm, and moreby Navy, National Institute of Standards and Technology, National Oceanic and Atmospheric Administration/Under Secretary for Oceans and Atmosphere, Army, and others Signed by year:2000: $0; 2001: $0; 2002: $16,100; 2003: $92,663; 2004: $90,530; 2005: $115,275; 2006: $62,825.
Biggest contracts:
$71,878 with Navy for Other Defense -- Applied Research and Exploratory Development (R&D). Signed on 2003-08-06. Completion date: 2003-09-20.
$63,340 with National Institute of Standards and Technology for Air Conditioning Equipment. Signed on 2004-09-02. Completion date: 2004-12-30.
$30,040 with National Oceanic and Atmospheric Administration/Under Secretary for Oceans and Atmosphere for Electrical and Electronic Properties Measuring and Testing Instruments. Signed on 2005-08-31. Completion date: 2005-09-30.
$27,190 with Army for Guns, through 30 mm. Signed on 2004-09-28. Completion date: 2004-12-30.
Top industries in this zip code by the number of employees in 2005:
Other Services (except Public Administration): Religious Organizations (50-99 employees: 2 establishments, 20-49 employees: 2 establishments, 10-19 employees: 4 establishments, 5-9 employees: 13 establishments, 1-4 employees: 13 establishments)
Administrative and Support and Waste Management and Remediation Services: Temporary Help Services (250-499: 1)
Educational Services: Elementary and Secondary Schools (100-249: 2, 10-19: 1)
Administrative and Support and Waste Management and Remediation Services: Professional Employer Organizations (100-249: 1, 20-49: 2, 10-19: 1)
Construction: Poured Concrete Foundation and Structure Contractors (100-249: 1, 10-19: 1, 5-9: 1, 1-4: 9)
2002 - 2018 National Fire Incident Reporting System (NFIRS) incidents
Based on the data from the years 2002 - 2018 the average number of fire incidents per year is 65. The highest number of reported fires - 85 took place in 2005, and the least - 41 in 2013. The data has a dropping trend.
When looking into fire subcategories, the most incidents belonged to: Structure Fires (48.0%), and Outside Fires (24.9%).
Fire incident types reported to NFIRS in Zip Code 49426


 Nearest zip codes: 49428, 49464, 49418, 49401, 49534, 49315.
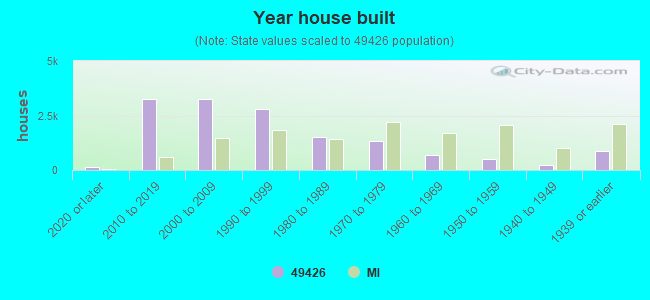


 Based on the data from the years 2002 - 2018 the average number of fire incidents per year is 65. The highest number of reported fires - 85 took place in 2005, and the least - 41 in 2013. The data has a dropping trend.
 When looking into fire subcategories, the most incidents belonged to: Structure Fires (48.0%), and Outside Fires (24.9%).