Estimated zip code population in 2022: 28,290 Zip code population in 2010: 20,735 Zip code population in 2000: 13,110
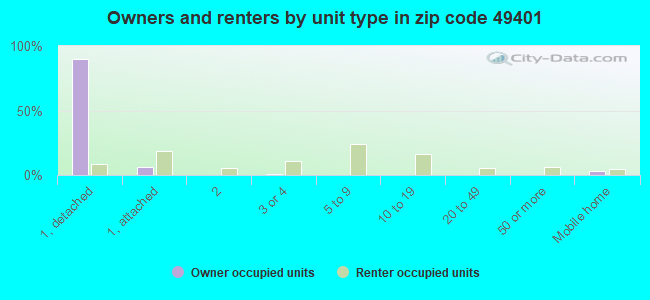
Houses and condos: 8,867 Renter-occupied apartments: 3,739
% of renters here:
45%
State:
27%
March 2022 cost of living index in zip code 49401: 86.1 (less than average, U.S. average is 100)
Land area: 25.7 sq. mi. Water area: 0.5 sq. mi.
Population density: 1,102 people per square mile
(low).
OSM Map
General Map
Google Map
MSN Map
OSM Map
General Map
Google Map
MSN Map
OSM Map
General Map
Google Map
MSN Map
OSM Map
General Map
Google Map
MSN Map
Please wait while loading the map...
Real estate property taxes paid for housing units in 2022:
This zip code:
1.0% ($3,073)
Michigan:
1.2% ($2,746)
Median real estate property taxes paid for housing units with mortgages in 2022: $3,488 (1.1%) Median real estate property taxes paid for housing units with no mortgage in 2022: $2,675 (0.9%)
Business Search- 14 Million verified businesses
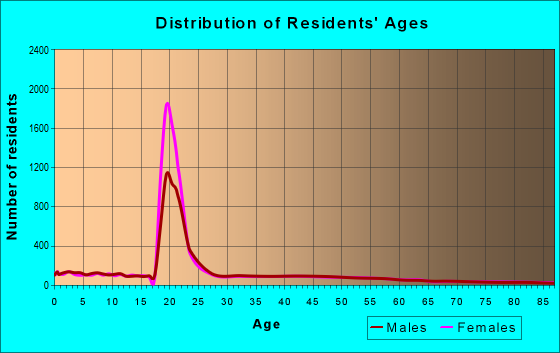
Males: 13,100
(46.3%)
Females: 15,191
(53.7%)
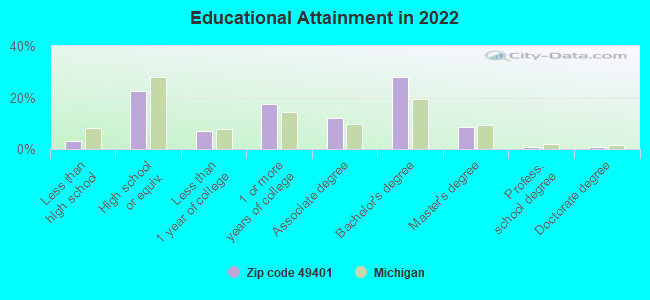
For population 25 years and over in 49401:
High school or higher: 97.0%
Bachelor's degree or higher: 38.2%
Graduate or professional degree: 10.3%
Unemployed: 5.2%
Mean travel time to work (commute): 22.4 minutes
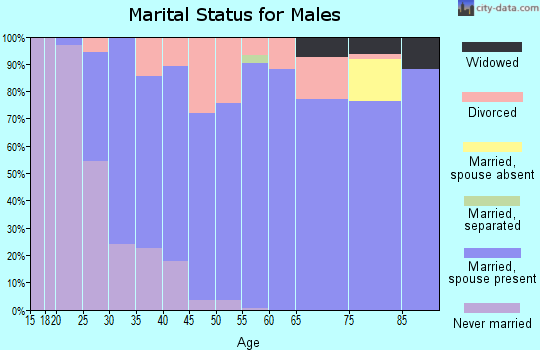
For population 15 years and over in 49401:
Never married: 64.7%
Now married: 28.8%
Separated: 0.4%
Widowed: 0.9%
Divorced: 5.3%
Zip code 49401 compared to state average:
Black race population percentage significantly below state average.
Median age significantly below state average.
Foreign-born population percentage significantly below state average.
Renting percentage above state average.
House age significantly below state average.
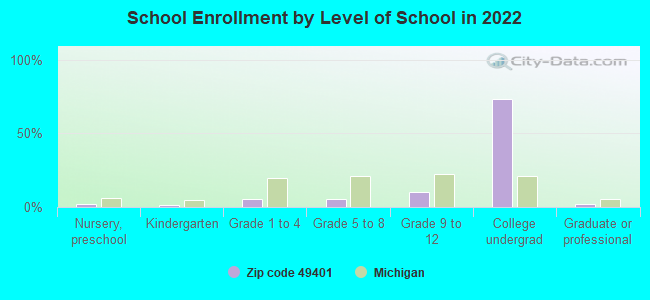
Number of college students significantly above state average.
Percentage of population with a bachelor's degree or higher below state average.
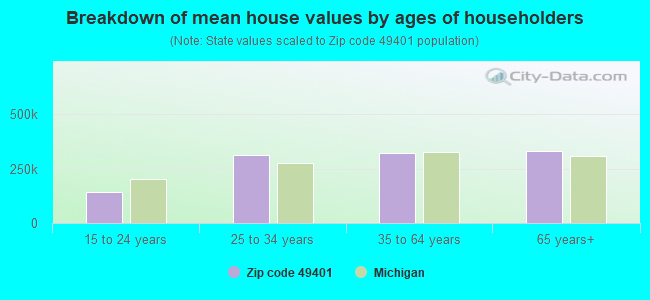
Estimated median house/condo value in 2022: $310,433
49401:
$310,433
Michigan:
$224,400
According to our research of Michigan and other state lists, there were 20 registered sex offenders living in 49401 zip code as of May 25, 2024. The ratio of all residents to sex offenders in zip code 49401 is 1,129 to 1. The ratio of registered sex offenders to all residents in this zip code is much lower than the state average.
Median resident age:
This zip code:
21.7 years
Michigan median age:
40.3 years
Average household size:
This zip code:
2.9 people
Michigan:
2.4 people
Averages for the 2020 tax year for zip code 49401, filed in 2021:
Average Adjusted Gross Income (AGI) in 2020: $64,035 (Individual Income Tax Returns)
Here:
$64,035
State:
$68,945
Salary/wage: $54,098 (reported on 89.0% of returns)
Here:
$54,098
State:
$57,142
(% of AGI for various income ranges: 1096.1% for AGIs below $25k, 3451.7% for AGIs $25k-50k, 6665.7% for AGIs $50k-75k, 9683.7% for AGIs $75k-100k, 17177.4% for AGIs $100k-200k, 67764.3% for AGIs over 200k)
Taxable interest for individuals: $850 (reported on 34.7% of returns)
This zip code:
$850
Michigan:
$1,630
(% of AGI for various income ranges: 8.4% for AGIs below $25k, 14.1% for AGIs $25k-50k, 22.2% for AGIs $50k-75k, 27.6% for AGIs $75k-100k, 64.9% for AGIs $100k-200k, 1578.6% for AGIs over 200k)
Ordinary dividends: $3,014 (reported on 14.8% of returns)
Here:
$3,014
State:
$6,972
(% of AGI for various income ranges: 16.5% for AGIs below $25k, 23.1% for AGIs $25k-50k, 50.9% for AGIs $50k-75k, 58.1% for AGIs $75k-100k, 110.6% for AGIs $100k-200k, 1722.9% for AGIs over 200k)
Net capital gain/loss in AGI: +$13,972 (reported on 14.6% of returns)
Here:
+$13,972
State:
+$20,064
(% of AGI for various income ranges: 6.1% for AGIs below $25k, 18.9% for AGIs $25k-50k, 55.6% for AGIs $50k-75k, 80.6% for AGIs $75k-100k, 349.4% for AGIs $100k-200k, 17827.1% for AGIs over 200k)
Profit/loss from business: +$13,234 (reported on 13.3% of returns)
Here:
+$13,234
State:
+$11,172
(% of AGI for various income ranges: 57.0% for AGIs below $25k, 128.7% for AGIs $25k-50k, 339.5% for AGIs $50k-75k, 325.1% for AGIs $75k-100k, 525.4% for AGIs $100k-200k, 2440.0% for AGIs over 200k)
Taxable individual retirement arrangement distribution: $16,766 (reported on 7.0% of returns)
49401:
$16,766
Michigan:
$19,803
(% of AGI for various income ranges: 48.4% for AGIs below $25k, 83.1% for AGIs $25k-50k, 209.6% for AGIs $50k-75k, 232.2% for AGIs $75k-100k, 352.0% for AGIs $100k-200k, 1398.6% for AGIs over 200k)
Self-employed (Keogh) retirement plans: $16,900 (reported on 0.2% of returns)
49401:
$16,900
Michigan:
$25,132
(% of AGI for various income ranges: 22.5% for AGIs $25k-50k)
Total itemized deductions: $32,927 (reported on 5.2% of returns)
Here:
$32,927
State:
$34,117
(% of AGI for various income ranges: 29.7% for AGIs below $25k, 61.8% for AGIs $25k-50k, 162.9% for AGIs $50k-75k, 203.5% for AGIs $75k-100k, 568.1% for AGIs $100k-200k, 6928.6% for AGIs over 200k)
Charity contributions: $16,446 (reported on 4.2% of returns)
Here:
$16,446
State:
$13,548
(% of AGI for various income ranges: 12.3% for AGIs $25k-50k, 32.7% for AGIs $50k-75k, 41.8% for AGIs $75k-100k, 216.3% for AGIs $100k-200k, 4265.7% for AGIs over 200k)
Taxes paid: $7,861 (reported on 5.2% of returns)
49401:
$7,861
State:
$7,972
(% of AGI for various income ranges: 3.5% for AGIs below $25k, 12.5% for AGIs $25k-50k, 44.9% for AGIs $50k-75k, 66.0% for AGIs $75k-100k, 164.7% for AGIs $100k-200k, 1185.7% for AGIs over 200k)
Earned income credit: $2,183 (reported on 8.6% of returns)
Here:
$2,183
State:
$2,251
(% of AGI for various income ranges: 37.7% for AGIs below $25k, 48.9% for AGIs $25k-50k, 1.6% for AGIs $50k-75k)
Percentage of individuals using paid preparers for their 2020 taxes: 94.7%
Here:
95%
State:
93%
(% for various income ranges: 93.5% for AGIs below $25k, 95.0% for AGIs $25k-50k, 94.6% for AGIs $50k-75k, 95.6% for AGIs $75k-100k, 95.9% for AGIs $100k-200k, 95.7% for AGIs over 200k)
Averages for the 2012 tax year for zip code 49401, filed in 2013:
Average Adjusted Gross Income (AGI) in 2012: $48,521 (Individual Income Tax Returns)
Here:
$48,521
State:
$55,609
Salary/wage: $43,908 (reported on 90.3% of returns)
Here:
$43,908
State:
$46,782
(% of AGI for various income ranges: 82.8% for AGIs below $25k, 83.3% for AGIs $25k-50k, 85.5% for AGIs $50k-75k, 86.8% for AGIs $75k-100k, 84.6% for AGIs $100k-200k, 44.9% for AGIs over 200k)
Taxable interest for individuals: $860 (reported on 35.1% of returns)
This zip code:
$860
Michigan:
$1,491
(% of AGI for various income ranges: 0.6% for AGIs below $25k, 0.7% for AGIs $25k-50k, 0.5% for AGIs $50k-75k, 0.5% for AGIs $75k-100k, 0.5% for AGIs $100k-200k, 1.8% for AGIs over 200k)
Ordinary dividends: $2,274 (reported on 14.5% of returns)
Here:
$2,274
State:
$6,225
(% of AGI for various income ranges: 1.0% for AGIs below $25k, 0.5% for AGIs $25k-50k, 0.5% for AGIs $50k-75k, 0.5% for AGIs $75k-100k, 1.1% for AGIs $100k-200k, 0.3% for AGIs over 200k)
Net capital gain/loss in AGI: +$3,239 (reported on 11.9% of returns)
Here:
+$3,239
State:
+$9,326
(% of AGI for various income ranges: 0.3% for AGIs $75k-100k, 0.9% for AGIs $100k-200k, 7.0% for AGIs over 200k)
Profit/loss from business: +$9,355 (reported on 13.3% of returns)
Here:
+$9,355
State:
+$11,523
(% of AGI for various income ranges: 4.9% for AGIs below $25k, 3.8% for AGIs $25k-50k, 2.4% for AGIs $50k-75k, 2.2% for AGIs $75k-100k, 2.3% for AGIs $100k-200k)
Taxable individual retirement arrangement distribution: $11,168 (reported on 8.7% of returns)
49401:
$11,168
Michigan:
$15,298
(% of AGI for various income ranges: 3.3% for AGIs below $25k, 2.6% for AGIs $25k-50k, 1.4% for AGIs $50k-75k, 1.9% for AGIs $75k-100k, 2.4% for AGIs $100k-200k)
Total itemized deductions: $17,716 (20% of AGI, reported on 32.9% of returns)
Here:
$17,716
State:
$21,628
Here:
20.1% of AGI
State:
18.4% of AGI
(% of AGI for various income ranges: 5.7% for AGIs below $25k, 8.4% for AGIs $25k-50k, 12.5% for AGIs $50k-75k, 14.2% for AGIs $75k-100k, 14.5% for AGIs $100k-200k, 10.5% for AGIs over 200k)
Charity contributions: $4,193 (reported on 28.2% of returns)
Here:
$4,193
State:
$4,225
(% of AGI for various income ranges: 0.8% for AGIs below $25k, 1.1% for AGIs $25k-50k, 2.4% for AGIs $50k-75k, 2.6% for AGIs $75k-100k, 3.4% for AGIs $100k-200k, 3.4% for AGIs over 200k)
Taxes paid: $6,285 (reported on 32.9% of returns)
49401:
$6,285
State:
$8,327
(% of AGI for various income ranges: 1.1% for AGIs below $25k, 2.3% for AGIs $25k-50k, 3.9% for AGIs $50k-75k, 5.0% for AGIs $75k-100k, 5.9% for AGIs $100k-200k, 5.5% for AGIs over 200k)
Earned income credit: $2,264 (reported on 13.0% of returns)
Here:
$2,264
State:
$2,306
(% of AGI for various income ranges: 4.7% for AGIs below $25k, 1.3% for AGIs $25k-50k)
Percentage of individuals using paid preparers for their 2012 taxes: 50.2%
Here:
50%
State:
57%
(% for various income ranges: 42.4% for AGIs below $25k, 55.1% for AGIs $25k-50k, 55.7% for AGIs $50k-75k, 53.6% for AGIs $75k-100k, 54.4% for AGIs $100k-200k, 83.3% for AGIs over 200k)
Averages for the 2004 tax year for zip code 49401, filed in 2005:
Average Adjusted Gross Income (AGI) in 2004: $43,091 (Individual Income Tax Returns)
Here:
$43,091
State:
$48,204
Salary/wage: $39,559 (reported on 91.3% of returns)
Here:
$39,559
State:
$42,791
(% of AGI for various income ranges: 131.9% for AGIs below $10k, 79.7% for AGIs $10k-25k, 87.0% for AGIs $25k-50k, 88.6% for AGIs $50k-75k, 88.5% for AGIs $75k-100k, 67.8% for AGIs over 100k)
Taxable interest for individuals: $1,332 (reported on 43.3% of returns)
This zip code:
$1,332
Michigan:
$1,725
(% of AGI for various income ranges: 5.5% for AGIs below $10k, 2.9% for AGIs $10k-25k, 1.0% for AGIs $25k-50k, 0.7% for AGIs $50k-75k, 0.6% for AGIs $75k-100k, 2.2% for AGIs over 100k)
Taxable dividends: $1,589 (reported on 19.4% of returns)
Here:
$1,589
State:
$3,420
(% of AGI for various income ranges: 2.3% for AGIs below $10k, 0.9% for AGIs $10k-25k, 0.4% for AGIs $25k-50k, 0.4% for AGIs $50k-75k, 0.6% for AGIs $75k-100k, 1.3% for AGIs over 100k)
Net capital gain/loss: +$7,508 (reported on 15.3% of returns)
Here:
+$7,508
State:
+$8,532
(% of AGI for various income ranges: 0.6% for AGIs below $10k, 0.1% for AGIs $10k-25k, 0.5% for AGIs $25k-50k, 0.9% for AGIs $50k-75k, 1.5% for AGIs $75k-100k, 9.1% for AGIs over 100k)
Profit/loss from business: +$10,019 (reported on 14.3% of returns)
Here:
+$10,019
State:
+$9,547
(% of AGI for various income ranges: 2.3% for AGIs below $10k, 5.0% for AGIs $10k-25k, 4.1% for AGIs $25k-50k, 3.3% for AGIs $50k-75k, 1.4% for AGIs $75k-100k, 4.1% for AGIs over 100k)
IRA payment deduction: $2,915 (reported on 2.3% of returns)
49401:
$2,915
Michigan:
$2,875
(% of AGI for various income ranges: 0.2% for AGIs $10k-25k, 0.2% for AGIs $25k-50k, 0.2% for AGIs $50k-75k, 0.1% for AGIs $75k-100k, 0.1% for AGIs over 100k)
Self-employed pension: $7,000 (reported on 0.4% of returns)
Here:
$7,000
Michigan:
$13,826
Total itemized deductions: $16,241 (23% of AGI, reported on 41.4% of returns)
Here:
$16,241
State:
$18,509
Here:
22.7% of AGI
State:
20.7% of AGI
(% of AGI for various income ranges: 11.6% for AGIs below $10k, 10.5% for AGIs $10k-25k, 13.1% for AGIs $25k-50k, 16.4% for AGIs $50k-75k, 17.4% for AGIs $75k-100k, 17.1% for AGIs over 100k)
Charity contributions deductions: $3,838 (5% of AGI, reported on 35.8% of returns)
Here:
$3,838
State:
$3,365
Here:
5.1% of AGI
State:
3.6% of AGI
(% of AGI for various income ranges: 1.3% for AGIs below $10k, 1.9% for AGIs $10k-25k, 2.4% for AGIs $25k-50k, 3.0% for AGIs $50k-75k, 3.6% for AGIs $75k-100k, 4.4% for AGIs over 100k)
Total tax: $5,087 (reported on 75.2% of returns)
49401:
$5,087
State:
$7,691
(% of AGI for various income ranges: 2.8% for AGIs below $10k, 4.5% for AGIs $10k-25k, 6.1% for AGIs $25k-50k, 7.4% for AGIs $50k-75k, 9.1% for AGIs $75k-100k, 15.0% for AGIs over 100k)
Earned income credit: $1,580 (reported on 10.0% of returns)
Here:
$1,580
State:
$1,737
Percentage of individuals using paid preparers for their 2004 taxes: 51.9%
Here:
52%
State:
60%
(% for various income ranges: 38.6% for AGIs below $10k, 50.6% for AGIs $10k-25k, 56.1% for AGIs $25k-50k, 59.7% for AGIs $50k-75k, 52.4% for AGIs $75k-100k, 61.6% for AGIs over 100k)
Likely homosexual households (counted as self-reported same-sex unmarried-partner households)
Lesbian couples: 0.6% of all households
Gay men: 0.4% of all households
Household received Food Stamps/SNAP in the past 12 months: 240 Household did not receive Food Stamps/SNAP in the past 12 months: 8,111
Women who had a birth in the past 12 months: 192 (157 now married, 37 unmarried) Women who did not have a birth in the past 12 months: 10,972 (1,943 now married, 9,083 unmarried)
Housing units in zip code 49401 with a mortgage: 3,216 (361 second mortgage, 19 home equity loan, 239 both second mortgage and home equity loan) Houses without a mortgage: 171
Median monthly owner costs for units with a mortgage: $1,558 Median monthly owner costs for units without a mortgage: $554
Residents with income below the poverty level in 2022:
This zip code:
28.0%
Whole state:
13.4%
Residents with income below 50% of the poverty level in 2022:
This zip code:
12.0%
Whole state:
6.9%
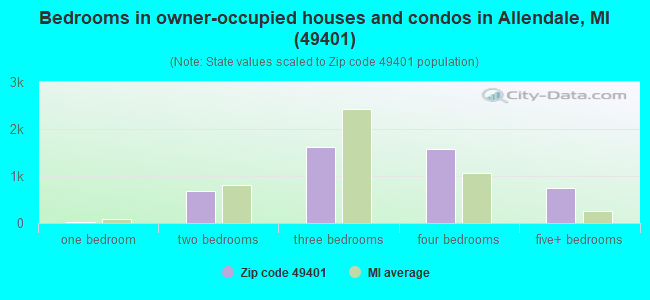
Median number of rooms in houses and condos:
Here:
6.7
State:
6.5
Median number of rooms in apartments:
Here:
5.5
State:
4.3
Notable locations in this zip code not listed on our city pages
Notable locations in zip code 49401: Meadows Golf Club (A), River Pines RV Park and Campground (B), Allendale Township Fire Department (C), Allendale Township Library (D), Grand Valley Apartments (E), South Utilities Building (F), Glenn A Niemeyer East Living Center (G), Glenn A Niemeyer Honors Hall (H), Glenn A Niemeyer West Living Center (I), Mark A Murray Living Center (J), Ronald F VanSteeland Living Center (K), Laker Village Apartments (L), Performing Arts Center (M), Cook Carillon Tower (N), Russel H Kirkhof Center (O), Cook-DeWitt Center (P), Calder Residence (Q), Alexander Calder Fine Arts Center (R), AuSable Hall (S), Lake Huron Hall (T). Display/hide their locations on the map
Churches in zip code 49401 include: Lighthouse Community Church (A), Allendale Wesleyan Church (B), Allendale Baptist Church (C), Christian Reformed Church (D), Allendale United Reformed Church (E), Spring Valley Community Church (F), Saint John Church (G). Display/hide their locations on the map
3,318 married couples with children.
792 single-parent households (490 men, 302 women).
95.6% of residents of 49401 zip code speak English at home.
2.0% of residents speak Spanish at home (67% very well, 11% well, 22% not well).
0.7% of residents speak other Indo-European language at home (90% very well, 10% well).
0.6% of residents speak Asian or Pacific Island language at home (60% very well, 40% well).
0.1% of residents speak other language at home (100% very well).
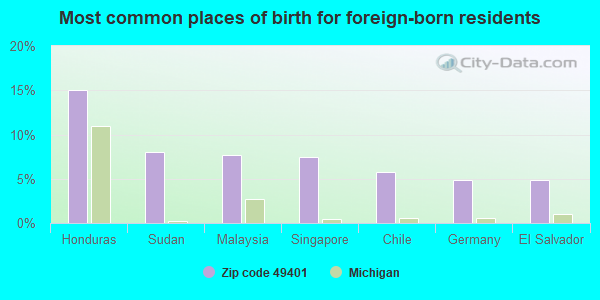
Foreign born population: 575 (2.0%) (59.6% of them are naturalized citizens)
This zip code:
2.0%
Whole state:
6.9%
15%Honduras
8%Sudan
8%Malaysia
7%Singapore
6%Chile
5%Germany
5%El Salvador
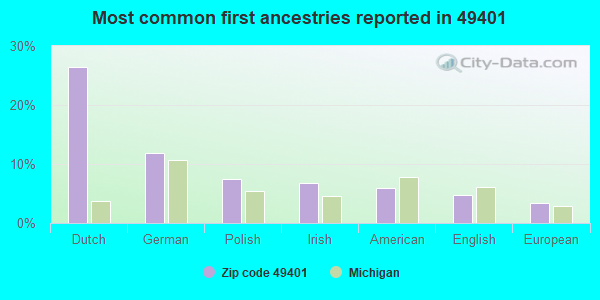
26%Dutch
12%German
7%Polish
7%Irish
6%American
5%English
3%European
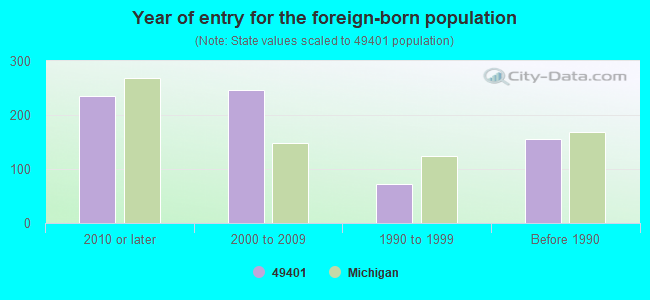
Year of entry for the foreign-born population
2352010 or later
2462000 to 2009
731990 to 1999
155Before 1990
Major facilities with environmental interests located in this zip code:
ALLENDALE ALTERNATIVE ED SCHOOL (6633 LAKE MICHIGAN DRIVE in ALLENDALE, MI)
(National Center for Education Statistics) - STATE ID-07293 Organizations: ALLENDALE PUBLIC SCHOOL DISTRICT (SCHOOL DISTRICT)
ALLENDALE HIGH SCHOOL (10760 68TH AVENUE in ALLENDALE, MI)
(National Center for Education Statistics) - STATE ID-05889 Organizations: ALLENDALE PUBLIC SCHOOL DISTRICT (SCHOOL DISTRICT)
ALLENDALE LOWER ELEMENTARY SCHOOL (6561 LAKE MICHIGAN DRIVE in ALLENDALE, MI)
(National Center for Education Statistics) - STATE ID-08662 Organizations: ALLENDALE PUBLIC SCHOOL DISTRICT (SCHOOL DISTRICT)
ALLENDALE MIDDLE SCHOOL (10760 68TH AVENUE in ALLENDALE, MI)
(National Center for Education Statistics) - STATE ID-08164 Organizations: ALLENDALE PUBLIC SCHOOL DISTRICT (SCHOOL DISTRICT)
ALLENDALE UPPER ELEMENTARY SCHOOL (6561 LAKE MICHIGAN DRIVE in ALLENDALE, MI)
(National Center for Education Statistics) - STATE ID-00069 Organizations: ALLENDALE PUBLIC SCHOOL DISTRICT (SCHOOL DISTRICT)
ALLENDALE BEEF CO (7886 PIERCE in ALLENDALE, MI)
(Integrated Compliance Information System) - ICIS-05-1997-0253, FORMAL ENFORCEMENT ACTION Business SIC classification: MEAT PACKING PLANTS
ALLENDALE TWP WWTP (11624 40TH AVENUE in ALLENDALE, MI)
National Pollutant Discharge Elimination System NON-MAJOR (Tracking pollutant discharge elimination systems) - permit National Pollutant Discharge Elimination System NON-MAJOR (Tracking pollutant discharge elimination systems) - permit Business SIC classification: SEWERAGE SYSTEMS
ADMIRAL PETROLEUM CORP (6781 LAKE MICHIGAN DRIVE in ALLENDALE, MI)
(Resource Conservation and Recovery Act (tracking hazardous waste))
ALLENDALE CHARTER TOWNSHIP (10384 42ND AVE in ALLENDALE, MI)
(Resource Conservation and Recovery Act (tracking hazardous waste)) Alternative names: ALLENDALE PUBLIC WORKS
ALLENDALE PUBLIC SCHOOLS (6561 LAKE MICHIGAN DR in ALLENDALE, MI)
(Resource Conservation and Recovery Act (tracking hazardous waste))
MI DEPT/TRANSPORTATION BRIDGE B02-70041 (M-45 OVER GRAND RIVER in ALLENDALE, MI)
(Resource Conservation and Recovery Act (tracking hazardous waste)) Organizations: MICH DEPT OF TRANSPORTATION (CONTACT/OPERATOR)
Alternative names: MIDOT BRIDGE M-45 OVER THE GRAND RIVER
MEADE FAMILY DENTISTRY PC (11301 COMMERCE DR in ALLENDALE, MI)
Conditionally Exempt Small Quantity Generators, less than 100 kg/month of hazardous waste (Resource Conservation and Recovery Act (tracking hazardous waste)) Organizations: JERE B MEADE (CONTACT/OPERATOR)
, TIM R MEADE (CONTACT/OWNER)
GRAND VALLEY STATE UNIVERSITY (1 CAMPUS DRIVE in ALLENDALE, MI)
Conditionally Exempt Small Quantity Generators, less than 100 kg/month of hazardous waste (Resource Conservation and Recovery Act (tracking hazardous waste)) Organizations: GRAND VALLEY ST UNIVERSITY (CONTACT/OWNER)
Housing units lacking complete plumbing facilities: 0.1% Housing units lacking complete kitchen facilities: 0.1%
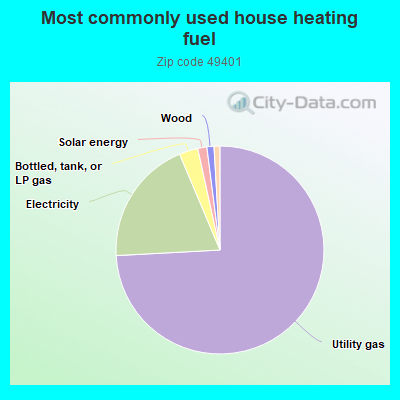
73.7%Utility gas
19.4%Electricity
2.9%Bottled, tank, or LP gas
1.4%Solar energy
1.1%Wood
0.9%Fuel oil, kerosene, etc.
Population in 1990: 7,311. Population change in the 1990s: +5,799 (+79.3%).
Place of birth for U.S.-born residents:
This state: 23,060
Northeast: 328
Midwest: 2,464
South: 964
West: 766
37% of the 49401 zip code residents lived in the same house 5 years ago. Out of people who lived in different houses, 25% lived in this county. Out of people who lived in different counties, 50% lived in Michigan.
90% of the 49401 zip code residents lived in the same house 1 year ago. Out of people who lived in different houses, 40% moved from this county. Out of people who lived in different houses, 46% moved from different county within same state. Out of people who lived in different houses, 12% moved from different state. Out of people who lived in different houses, 1% moved from abroad.
Private vs. public school enrollment:
Students in private schools in grades 1 to 8 (elementary and middle school): 465
Here:
27.2%
Michigan:
12.4%
Students in private schools in grades 9 to 12 (high school): 147
Here:
9.8%
Michigan:
9.8%
Students in private undergraduate colleges: 1,144
Here:
10.4%
Michigan:
14.9%
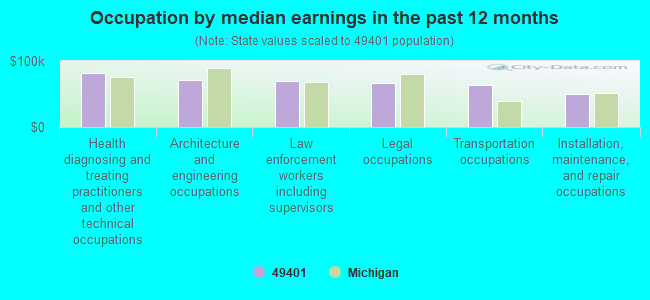
Occupation by median earnings in the past 12 months ($)
81,887Health diagnosing and treating practitioners and other technical occupations
70,547Architecture and engineering occupations
70,307Law enforcement workers including supervisors
67,312Legal occupations
64,016Transportation occupations
49,868Installation, maintenance, and repair occupations
Companies with federal contracts located in this zip code:
EXPO DISPLAYS & GRAPHICS (6841 LAKE MICHIGAN DR in ALLENDALE, MI; small business)
$40,400 with Navy for Signs, Advertising Displays, and Identification Plates. Taking place in MD. Signed on 2004-01-08. Completion date: 2004-01-19.
LEIGH ENTERPRISE L L C (11425 PRAIRIE AVE in ALLENDALE, MI; small business) : $22,219 in 2 contractsfrom 2004 to 2005
$18,877 with Army for Bars and Rods. Signed on 2004-11-10. Completion date: 2004-11-30.
$3,342, same as above.Signed on 2005-01-20. Completion date: 2005-02-17.
Top industries in this zip code by the number of employees in 2005:
Accommodation and Food Services: Food Service Contractors (100-249 employees: 1 establishment, 1-4 employees: 2 establishments)
Administrative and Support and Waste Management and Remediation Services: Professional Employer Organizations (100-249: 1)
Health Care and Social Assistance: Nursing Care Facilities (50-99: 1)
Health Care and Social Assistance: Residential Mental Retardation Facilities (20-49: 1, 10-19: 1)
Other Services (except Public Administration): Commercial and Industrial Machinery and Equipment (except Automotive and Electronic) Repair and Maintenance (20-49: 1, 5-9: 1)
People in group quarters in 2010:
3,735 people in college/university student housing
53 people in nursing facilities/skilled-nursing facilities
5 people in group homes intended for adults
People in group quarters in 2000:
2,969 people in college dormitories (includes college quarters off campus)
57 people in nursing homes
6 people in other group homes
5 people in homes for the mentally ill
Fatal accident statistics in 2012:
Fatal accident count: 1
Vehicles involved in fatal accidents: 1
Fatal accidents caused by drunken drivers: 1
Fatalities: 1
Persons involved in fatal accidents: 1
Pedestrians involved in fatal accidents: 0
Home Mortgage Disclosure Act Aggregated Statistics For Year 2009 (Based on 6 partial tracts)
A) FHA, FSA/RHS & VA Home Purchase Loans
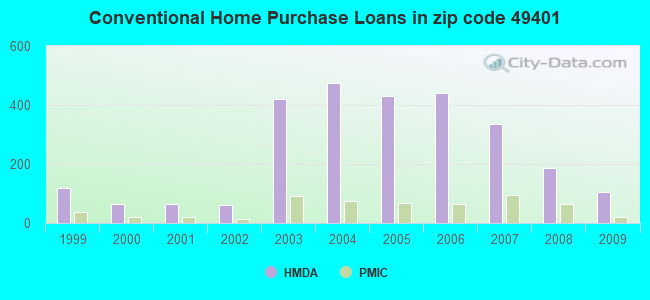
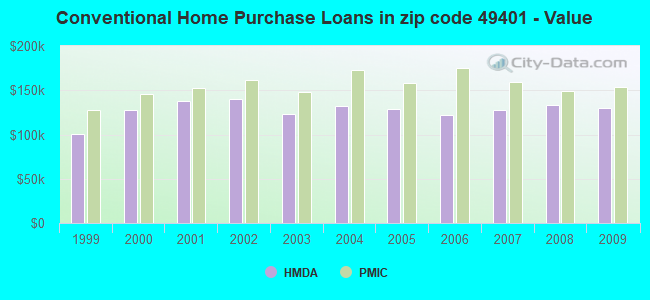
B) Conventional Home Purchase Loans
C) Refinancings
D) Home Improvement Loans
F) Non-occupant Loans on < 5 Family Dwellings (A B C & D)
G) Loans On Manufactured Home Dwelling (A B C & D)
Number
Average Value
Number
Average Value
Number
Average Value
Number
Average Value
Number
Average Value
Number
Average Value
LOANS ORIGINATED
95
$139,330
104
$129,973
728
$141,416
17
$27,014
12
$145,004
13
$36,968
APPLICATIONS APPROVED, NOT ACCEPTED
2
$135,775
14
$74,426
53
$152,189
4
$41,775
1
$97,230
9
$29,186
APPLICATIONS DENIED
16
$124,918
19
$102,981
154
$164,178
8
$86,630
3
$97,160
7
$58,274
APPLICATIONS WITHDRAWN
13
$117,470
9
$126,081
107
$147,332
5
$25,210
0
$0
3
$78,693
FILES CLOSED FOR INCOMPLETENESS
1
$171,640
5
$150,514
28
$172,062
1
$13,060
0
$0
0
$0
Aggregated Statistics For Year 2008 (Based on 6 partial tracts)
A) FHA, FSA/RHS & VA Home Purchase Loans
B) Conventional Home Purchase Loans
C) Refinancings
D) Home Improvement Loans
E) Loans on Dwellings For 5+ Families
F) Non-occupant Loans on < 5 Family Dwellings (A B C & D)
G) Loans On Manufactured Home Dwelling (A B C & D)
Number
Average Value
Number
Average Value
Number
Average Value
Number
Average Value
Number
Average Value
Number
Average Value
Number
Average Value
LOANS ORIGINATED
58
$149,074
186
$133,241
326
$133,275
44
$42,649
0
$0
15
$122,159
20
$52,552
APPLICATIONS APPROVED, NOT ACCEPTED
0
$0
8
$156,295
75
$152,055
2
$33,710
0
$0
0
$0
3
$65,337
APPLICATIONS DENIED
13
$132,860
28
$101,479
145
$152,371
22
$87,277
0
$0
9
$125,367
12
$41,798
APPLICATIONS WITHDRAWN
6
$137,525
15
$145,829
51
$169,451
3
$34,587
3
$1,054,540
4
$139,710
2
$87,700
FILES CLOSED FOR INCOMPLETENESS
0
$0
4
$124,748
16
$150,559
0
$0
0
$0
0
$0
0
$0
Aggregated Statistics For Year 2007 (Based on 6 partial tracts)
A) FHA, FSA/RHS & VA Home Purchase Loans
B) Conventional Home Purchase Loans
C) Refinancings
D) Home Improvement Loans
E) Loans on Dwellings For 5+ Families
F) Non-occupant Loans on < 5 Family Dwellings (A B C & D)
G) Loans On Manufactured Home Dwelling (A B C & D)
Number
Average Value
Number
Average Value
Number
Average Value
Number
Average Value
Number
Average Value
Number
Average Value
Number
Average Value
LOANS ORIGINATED
22
$143,865
335
$127,405
340
$125,410
60
$41,801
1
$143,860
24
$115,276
21
$45,946
APPLICATIONS APPROVED, NOT ACCEPTED
1
$94,330
41
$95,523
95
$136,887
3
$22,683
0
$0
0
$0
13
$85,548
APPLICATIONS DENIED
3
$145,583
36
$106,616
161
$136,193
39
$49,016
1
$44,987,200
5
$84,344
18
$54,607
APPLICATIONS WITHDRAWN
3
$214,127
37
$107,581
86
$125,610
4
$48,070
1
$1,039,060
3
$110,417
9
$84,771
FILES CLOSED FOR INCOMPLETENESS
0
$0
5
$112,302
24
$155,117
2
$146,860
0
$0
0
$0
0
$0
Aggregated Statistics For Year 2006 (Based on 6 partial tracts)
A) FHA, FSA/RHS & VA Home Purchase Loans
B) Conventional Home Purchase Loans
C) Refinancings
D) Home Improvement Loans
E) Loans on Dwellings For 5+ Families
F) Non-occupant Loans on < 5 Family Dwellings (A B C & D)
G) Loans On Manufactured Home Dwelling (A B C & D)
Number
Average Value
Number
Average Value
Number
Average Value
Number
Average Value
Number
Average Value
Number
Average Value
Number
Average Value
LOANS ORIGINATED
16
$163,907
440
$121,501
451
$109,164
72
$25,467
2
$3,353,550
28
$124,143
14
$63,104
APPLICATIONS APPROVED, NOT ACCEPTED
0
$0
38
$116,869
105
$106,434
6
$29,245
0
$0
7
$155,799
7
$42,686
APPLICATIONS DENIED
6
$128,655
61
$107,829
214
$136,395
26
$39,503
0
$0
11
$107,815
11
$73,880
APPLICATIONS WITHDRAWN
0
$0
36
$133,301
90
$146,105
4
$53,245
1
$1,255,290
2
$114,095
0
$0
FILES CLOSED FOR INCOMPLETENESS
1
$296,040
8
$115,482
36
$156,367
0
$0
0
$0
0
$0
0
$0
Aggregated Statistics For Year 2005 (Based on 6 partial tracts)
A) FHA, FSA/RHS & VA Home Purchase Loans
B) Conventional Home Purchase Loans
C) Refinancings
D) Home Improvement Loans
E) Loans on Dwellings For 5+ Families
F) Non-occupant Loans on < 5 Family Dwellings (A B C & D)
G) Loans On Manufactured Home Dwelling (A B C & D)
Number
Average Value
Number
Average Value
Number
Average Value
Number
Average Value
Number
Average Value
Number
Average Value
Number
Average Value
LOANS ORIGINATED
19
$145,790
430
$128,697
503
$140,453
76
$38,049
1
$783,650
58
$178,962
16
$27,588
APPLICATIONS APPROVED, NOT ACCEPTED
1
$146,740
42
$108,021
72
$137,760
5
$24,006
0
$0
5
$112,374
10
$29,509
APPLICATIONS DENIED
2
$141,215
61
$95,861
215
$133,551
22
$60,974
1
$1,582,460
16
$104,661
22
$47,494
APPLICATIONS WITHDRAWN
0
$0
28
$135,624
195
$145,276
8
$38,205
0
$0
11
$80,231
3
$92,550
FILES CLOSED FOR INCOMPLETENESS
0
$0
11
$97,806
39
$163,840
1
$16,120
0
$0
0
$0
1
$64,740
Aggregated Statistics For Year 2004 (Based on 6 partial tracts)
A) FHA, FSA/RHS & VA Home Purchase Loans
B) Conventional Home Purchase Loans
C) Refinancings
D) Home Improvement Loans
E) Loans on Dwellings For 5+ Families
F) Non-occupant Loans on < 5 Family Dwellings (A B C & D)
G) Loans On Manufactured Home Dwelling (A B C & D)
Number
Average Value
Number
Average Value
Number
Average Value
Number
Average Value
Number
Average Value
Number
Average Value
Number
Average Value
LOANS ORIGINATED
10
$142,001
476
$132,163
569
$131,749
59
$31,470
6
$2,619,085
39
$151,125
30
$51,870
APPLICATIONS APPROVED, NOT ACCEPTED
6
$126,782
37
$116,253
95
$139,862
7
$30,010
0
$0
9
$71,067
17
$57,024
APPLICATIONS DENIED
3
$140,563
71
$89,325
183
$127,695
30
$54,214
0
$0
8
$114,636
46
$37,508
APPLICATIONS WITHDRAWN
2
$96,075
23
$132,823
91
$143,990
8
$37,581
0
$0
5
$174,830
7
$94,120
FILES CLOSED FOR INCOMPLETENESS
0
$0
17
$112,812
70
$143,848
1
$30,890
0
$0
0
$0
6
$58,263
Aggregated Statistics For Year 2003 (Based on 6 partial tracts)
A) FHA, FSA/RHS & VA Home Purchase Loans
B) Conventional Home Purchase Loans
C) Refinancings
D) Home Improvement Loans
F) Non-occupant Loans on < 5 Family Dwellings (A B C & D)
Number
Average Value
Number
Average Value
Number
Average Value
Number
Average Value
Number
Average Value
LOANS ORIGINATED
35
$137,766
419
$123,487
1,565
$120,980
51
$36,895
39
$97,937
APPLICATIONS APPROVED, NOT ACCEPTED
1
$174,140
51
$90,783
163
$124,948
6
$12,875
6
$118,163
APPLICATIONS DENIED
5
$125,544
77
$53,097
229
$111,322
16
$15,268
5
$82,108
APPLICATIONS WITHDRAWN
0
$0
24
$138,130
146
$137,685
8
$24,602
0
$0
FILES CLOSED FOR INCOMPLETENESS
0
$0
4
$147,060
44
$136,400
1
$29,010
2
$143,120
Aggregated Statistics For Year 2002 (Based on 2 partial tracts)
A) FHA, FSA/RHS & VA Home Purchase Loans
B) Conventional Home Purchase Loans
C) Refinancings
D) Home Improvement Loans
F) Non-occupant Loans on < 5 Family Dwellings (A B C & D)
Number
Average Value
Number
Average Value
Number
Average Value
Number
Average Value
Number
Average Value
LOANS ORIGINATED
3
$138,060
62
$140,226
277
$130,605
9
$33,396
3
$89,623
APPLICATIONS APPROVED, NOT ACCEPTED
0
$0
4
$119,930
23
$131,007
1
$14,240
0
$0
APPLICATIONS DENIED
0
$0
4
$151,020
23
$133,751
2
$24,710
1
$49,960
APPLICATIONS WITHDRAWN
0
$0
2
$96,830
15
$120,333
2
$25,250
0
$0
FILES CLOSED FOR INCOMPLETENESS
0
$0
1
$123,020
6
$150,998
0
$0
0
$0
Aggregated Statistics For Year 2001 (Based on 2 partial tracts)
A) FHA, FSA/RHS & VA Home Purchase Loans
B) Conventional Home Purchase Loans
C) Refinancings
D) Home Improvement Loans
F) Non-occupant Loans on < 5 Family Dwellings (A B C & D)
Number
Average Value
Number
Average Value
Number
Average Value
Number
Average Value
Number
Average Value
LOANS ORIGINATED
3
$169,307
65
$138,172
197
$132,232
16
$26,256
2
$90,115
APPLICATIONS APPROVED, NOT ACCEPTED
0
$0
5
$125,060
16
$113,836
0
$0
1
$35,720
APPLICATIONS DENIED
0
$0
3
$114,157
24
$115,554
2
$9,805
0
$0
APPLICATIONS WITHDRAWN
0
$0
1
$76,550
15
$117,145
1
$95,350
0
$0
FILES CLOSED FOR INCOMPLETENESS
0
$0
2
$79,105
4
$155,050
0
$0
0
$0
Aggregated Statistics For Year 2000 (Based on 2 partial tracts)
A) FHA, FSA/RHS & VA Home Purchase Loans
B) Conventional Home Purchase Loans
C) Refinancings
D) Home Improvement Loans
F) Non-occupant Loans on < 5 Family Dwellings (A B C & D)
Number
Average Value
Number
Average Value
Number
Average Value
Number
Average Value
Number
Average Value
LOANS ORIGINATED
3
$119,437
63
$127,875
36
$108,134
13
$23,802
1
$33,310
APPLICATIONS APPROVED, NOT ACCEPTED
0
$0
5
$92,022
6
$103,232
2
$24,845
1
$19,610
APPLICATIONS DENIED
0
$0
3
$93,830
9
$89,772
2
$17,860
1
$8,860
APPLICATIONS WITHDRAWN
0
$0
2
$145,045
3
$120,600
1
$53,180
0
$0
FILES CLOSED FOR INCOMPLETENESS
0
$0
1
$65,540
2
$121,675
0
$0
0
$0
Aggregated Statistics For Year 1999 (Based on 2 partial tracts)
A) FHA, FSA/RHS & VA Home Purchase Loans
B) Conventional Home Purchase Loans
C) Refinancings
D) Home Improvement Loans
E) Loans on Dwellings For 5+ Families
F) Non-occupant Loans on < 5 Family Dwellings (A B C & D)
2002 - 2018 National Fire Incident Reporting System (NFIRS) incidents
According to the data from the years 2002 - 2018 the average number of fires per year is 38. The highest number of fire incidents - 63 took place in 2012, and the least - 16 in 2004. The data has a rising trend.
When looking into fire subcategories, the most incidents belonged to: Structure Fires (58.3%), and Outside Fires (25.2%).
Fire incident types reported to NFIRS in Zip Code 49401


 Nearest zip codes: 49404, 49428, 49435, 49426, 49464, 49534.
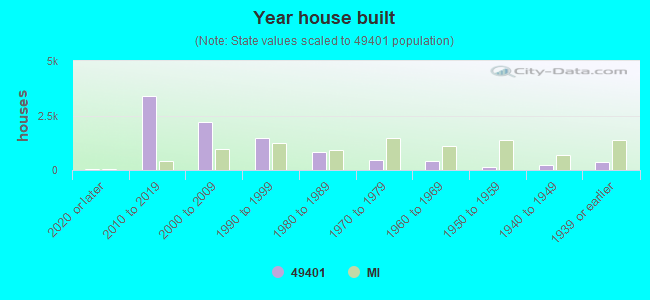


 According to the data from the years 2002 - 2018 the average number of fires per year is 38. The highest number of fire incidents - 63 took place in 2012, and the least - 16 in 2004. The data has a rising trend.
 When looking into fire subcategories, the most incidents belonged to: Structure Fires (58.3%), and Outside Fires (25.2%).