Estimated zip code population in 2022: 3,952 Zip code population in 2010: 3,885 Zip code population in 2000: 3,789
Houses and condos: 1,671 Renter-occupied apartments: 124
% of renters here:
8%
State:
27%
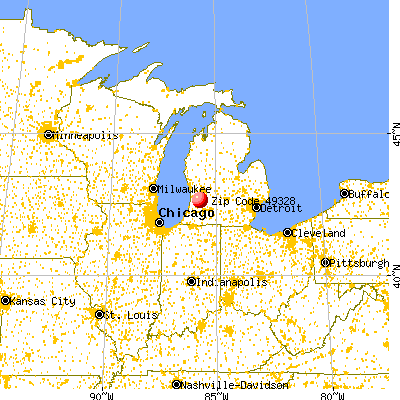
March 2022 cost of living index in zip code 49328: 80.9 (low, U.S. average is 100)
Land area: 56.6 sq. mi. Water area: 0.7 sq. mi.
Population density: 70 people per square mile
(very low).
OSM Map
General Map
Google Map
MSN Map
OSM Map
General Map
Google Map
MSN Map
OSM Map
General Map
Google Map
MSN Map
OSM Map
General Map
Google Map
MSN Map
Please wait while loading the map...
Real estate property taxes paid for housing units in 2022:
This zip code:
1.1% ($2,345)
Michigan:
1.2% ($2,746)
Median real estate property taxes paid for housing units with mortgages in 2022: $2,468 (1.1%) Median real estate property taxes paid for housing units with no mortgage in 2022: $2,133 (1.0%)
Business Search- 14 Million verified businesses
Males: 2,018
(51.1%)
Females: 1,934
(48.9%)
For population 25 years and over in 49328:
High school or higher: 83.4%
Bachelor's degree or higher: 19.4%
Graduate or professional degree: 4.4%
Unemployed: 6.9%
Mean travel time to work (commute): 26.4 minutes
For population 15 years and over in 49328:
Never married: 25.2%
Now married: 53.5%
Separated: 1.0%
Widowed: 5.2%
Divorced: 15.2%
Zip code 49328 compared to state average:
Black race population percentage significantly below state average.
Hispanic race population percentage significantly below state average.
Foreign-born population percentage significantly below state average.
Renting percentage significantly below state average.
Length of stay since moving in significantly above state average.
Number of college students significantly below state average.
Percentage of population with a bachelor's degree or higher below state average.
Estimated median house/condo value in 2022: $219,937
49328:
$219,937
Michigan:
$224,400
According to our research of Michigan and other state lists, there were 7 registered sex offenders living in 49328 zip code as of May 23, 2024. The ratio of all residents to sex offenders in zip code 49328 is 575 to 1. The ratio of registered sex offenders to all residents in this zip code is lower than the state average.
Median resident age:
This zip code:
41.6 years
Michigan median age:
40.3 years
Average household size:
This zip code:
2.6 people
Michigan:
2.4 people
Averages for the 2020 tax year for zip code 49328, filed in 2021:
Average Adjusted Gross Income (AGI) in 2020: $61,715 (Individual Income Tax Returns)
Here:
$61,715
State:
$68,945
Salary/wage: $54,748 (reported on 83.8% of returns)
Here:
$54,748
State:
$57,142
(% of AGI for various income ranges: 1054.1% for AGIs below $25k, 3552.8% for AGIs $25k-50k, 6476.8% for AGIs $50k-75k, 9252.8% for AGIs $75k-100k, 14932.8% for AGIs $100k-200k)
Taxable interest for individuals: $781 (reported on 37.3% of returns)
This zip code:
$781
Michigan:
$1,630
(% of AGI for various income ranges: 17.4% for AGIs below $25k, 25.6% for AGIs $25k-50k, 28.8% for AGIs $50k-75k, 44.4% for AGIs $75k-100k, 77.8% for AGIs $100k-200k)
Ordinary dividends: $1,624 (reported on 13.5% of returns)
Here:
$1,624
State:
$6,972
(% of AGI for various income ranges: 17.9% for AGIs below $25k, 22.8% for AGIs $25k-50k, 48.0% for AGIs $50k-75k, 20.6% for AGIs $75k-100k, 46.1% for AGIs $100k-200k)
Net capital gain/loss in AGI: +$4,652 (reported on 14.6% of returns)
Here:
+$4,652
State:
+$20,064
(% of AGI for various income ranges: 19.4% for AGIs below $25k, 41.7% for AGIs $25k-50k, 115.2% for AGIs $50k-75k, 81.7% for AGIs $75k-100k, 313.3% for AGIs $100k-200k)
Profit/loss from business: +$10,655 (reported on 11.9% of returns)
Here:
+$10,655
State:
+$11,172
(% of AGI for various income ranges: 94.1% for AGIs below $25k, 101.7% for AGIs $25k-50k, 262.8% for AGIs $50k-75k, 146.1% for AGIs $75k-100k, 410.0% for AGIs $100k-200k)
Taxable individual retirement arrangement distribution: $11,722 (reported on 9.7% of returns)
49328:
$11,722
Michigan:
$19,803
(% of AGI for various income ranges: 97.6% for AGIs below $25k, 112.2% for AGIs $25k-50k, 113.6% for AGIs $50k-75k, 208.3% for AGIs $75k-100k, 397.2% for AGIs $100k-200k)
Total itemized deductions: $29,100 (reported on 3.2% of returns)
Here:
$29,100
State:
$34,117
(% of AGI for various income ranges: 140.6% for AGIs $25k-50k, 688.9% for AGIs $100k-200k)
Charity contributions: $17,375 (reported on 2.2% of returns)
Here:
$17,375
State:
$13,548
(% of AGI for various income ranges: 386.1% for AGIs $100k-200k)
Taxes paid: $7,583 (reported on 3.2% of returns)
49328:
$7,583
State:
$7,972
(% of AGI for various income ranges: 41.9% for AGIs $25k-50k, 168.9% for AGIs $100k-200k)
Earned income credit: $2,100 (reported on 10.3% of returns)
Here:
$2,100
State:
$2,251
(% of AGI for various income ranges: 69.4% for AGIs below $25k, 45.3% for AGIs $25k-50k)
Percentage of individuals using paid preparers for their 2020 taxes: 95.7%
Here:
96%
State:
93%
(% for various income ranges: 94.3% for AGIs below $25k, 95.6% for AGIs $25k-50k, 97.0% for AGIs $50k-75k, 95.8% for AGIs $75k-100k, 96.2% for AGIs $100k-200k, 100.0% for AGIs over 200k)
Averages for the 2012 tax year for zip code 49328, filed in 2013:
Average Adjusted Gross Income (AGI) in 2012: $47,276 (Individual Income Tax Returns)
Here:
$47,276
State:
$55,609
Salary/wage: $41,424 (reported on 86.4% of returns)
Here:
$41,424
State:
$46,782
(% of AGI for various income ranges: 71.3% for AGIs below $25k, 80.6% for AGIs $25k-50k, 80.8% for AGIs $50k-75k, 79.9% for AGIs $75k-100k, 101.0% for AGIs $100k-200k)
Taxable interest for individuals: $800 (reported on 34.7% of returns)
This zip code:
$800
Michigan:
$1,491
(% of AGI for various income ranges: 1.4% for AGIs below $25k, 0.7% for AGIs $25k-50k, 0.7% for AGIs $50k-75k, 0.3% for AGIs $75k-100k, 0.2% for AGIs $100k-200k, 0.6% for AGIs over 200k)
Ordinary dividends: $1,500 (reported on 14.2% of returns)
Here:
$1,500
State:
$6,225
(% of AGI for various income ranges: 1.0% for AGIs below $25k, 0.6% for AGIs $25k-50k, 0.6% for AGIs $50k-75k, 0.2% for AGIs $75k-100k, 0.3% for AGIs $100k-200k)
Net capital gain/loss in AGI: +$9,361 (reported on 10.2% of returns)
Here:
+$9,361
State:
+$9,326
(% of AGI for various income ranges: 0.1% for AGIs below $25k, 0.6% for AGIs $25k-50k, 1.4% for AGIs $50k-75k, 0.5% for AGIs $75k-100k, 7.5% for AGIs $100k-200k)
Profit/loss from business: +$7,257 (reported on 13.1% of returns)
Here:
+$7,257
State:
+$11,523
(% of AGI for various income ranges: 3.9% for AGIs below $25k, 2.8% for AGIs $25k-50k, 2.6% for AGIs $50k-75k, 1.0% for AGIs $75k-100k, 1.6% for AGIs $100k-200k)
Taxable individual retirement arrangement distribution: $11,461 (reported on 10.2% of returns)
49328:
$11,461
Michigan:
$15,298
(% of AGI for various income ranges: 3.8% for AGIs below $25k, 2.2% for AGIs $25k-50k, 2.4% for AGIs $50k-75k, 6.3% for AGIs $75k-100k)
Total itemized deductions: $16,859 (20% of AGI, reported on 26.1% of returns)
Here:
$16,859
State:
$21,628
Here:
20.2% of AGI
State:
18.4% of AGI
(% of AGI for various income ranges: 6.4% for AGIs below $25k, 7.6% for AGIs $25k-50k, 9.7% for AGIs $50k-75k, 9.7% for AGIs $75k-100k, 16.3% for AGIs $100k-200k)
Charity contributions: $3,529 (reported on 19.9% of returns)
Here:
$3,529
State:
$4,225
(% of AGI for various income ranges: 0.4% for AGIs below $25k, 1.0% for AGIs $25k-50k, 1.3% for AGIs $50k-75k, 1.5% for AGIs $75k-100k, 3.4% for AGIs $100k-200k)
Taxes paid: $5,750 (reported on 26.1% of returns)
49328:
$5,750
State:
$8,327
(% of AGI for various income ranges: 1.0% for AGIs below $25k, 1.9% for AGIs $25k-50k, 2.9% for AGIs $50k-75k, 3.5% for AGIs $75k-100k, 7.0% for AGIs $100k-200k)
Earned income credit: $1,950 (reported on 14.8% of returns)
Here:
$1,950
State:
$2,306
(% of AGI for various income ranges: 4.8% for AGIs below $25k, 0.9% for AGIs $25k-50k)
Percentage of individuals using paid preparers for their 2012 taxes: 62.5%
Here:
62%
State:
57%
(% for various income ranges: 58.2% for AGIs below $25k, 61.4% for AGIs $25k-50k, 71.9% for AGIs $50k-75k, 61.1% for AGIs $75k-100k, 61.5% for AGIs $100k-200k, 100.0% for AGIs over 200k)
Averages for the 2004 tax year for zip code 49328, filed in 2005:
Average Adjusted Gross Income (AGI) in 2004: $38,567 (Individual Income Tax Returns)
Here:
$38,567
State:
$48,204
Salary/wage: $36,430 (reported on 86.0% of returns)
Here:
$36,430
State:
$42,791
(% of AGI for various income ranges: 108.1% for AGIs below $10k, 65.3% for AGIs $10k-25k, 81.6% for AGIs $25k-50k, 85.6% for AGIs $50k-75k, 83.5% for AGIs $75k-100k, 74.8% for AGIs over 100k)
Taxable interest for individuals: $1,026 (reported on 43.1% of returns)
This zip code:
$1,026
Michigan:
$1,725
(% of AGI for various income ranges: 6.7% for AGIs below $10k, 3.2% for AGIs $10k-25k, 0.9% for AGIs $25k-50k, 0.5% for AGIs $50k-75k, 0.7% for AGIs $75k-100k, 1.3% for AGIs over 100k)
Taxable dividends: $1,183 (reported on 19.1% of returns)
Here:
$1,183
State:
$3,420
(% of AGI for various income ranges: 1.1% for AGIs below $10k, 1.9% for AGIs $10k-25k, 0.7% for AGIs $25k-50k, 0.2% for AGIs $50k-75k, 0.5% for AGIs $75k-100k, 0.4% for AGIs over 100k)
Net capital gain/loss: +$3,927 (reported on 14.7% of returns)
Here:
+$3,927
State:
+$8,532
(% of AGI for various income ranges: -0.7% for AGIs below $10k, 0.4% for AGIs $10k-25k, 1.1% for AGIs $25k-50k, 1.4% for AGIs $50k-75k, 1.8% for AGIs $75k-100k, 3.2% for AGIs over 100k)
Profit/loss from business: +$6,286 (reported on 15.0% of returns)
Here:
+$6,286
State:
+$9,547
(% of AGI for various income ranges: 0.7% for AGIs below $10k, 6.0% for AGIs $10k-25k, 3.4% for AGIs $25k-50k, 3.1% for AGIs $50k-75k, 0.5% for AGIs $75k-100k)
IRA payment deduction: $2,750 (reported on 2.1% of returns)
49328:
$2,750
Michigan:
$2,875
Total itemized deductions: $14,678 (23% of AGI, reported on 33.9% of returns)
Here:
$14,678
State:
$18,509
Here:
23.2% of AGI
State:
20.7% of AGI
(% of AGI for various income ranges: 11.3% for AGIs $10k-25k, 12.0% for AGIs $25k-50k, 14.4% for AGIs $50k-75k, 13.2% for AGIs $75k-100k, 13.8% for AGIs over 100k)
Charity contributions deductions: $2,644 (4% of AGI, reported on 26.8% of returns)
Here:
$2,644
State:
$3,365
Here:
4.0% of AGI
State:
3.6% of AGI
(% of AGI for various income ranges: 1.1% for AGIs $10k-25k, 1.7% for AGIs $25k-50k, 1.6% for AGIs $50k-75k, 2.0% for AGIs $75k-100k, 3.0% for AGIs over 100k)
Total tax: $4,325 (reported on 75.8% of returns)
49328:
$4,325
State:
$7,691
(% of AGI for various income ranges: 2.7% for AGIs below $10k, 4.7% for AGIs $10k-25k, 6.5% for AGIs $25k-50k, 7.8% for AGIs $50k-75k, 10.0% for AGIs $75k-100k, 15.0% for AGIs over 100k)
Earned income credit: $1,480 (reported on 10.6% of returns)
Here:
$1,480
State:
$1,737
Percentage of individuals using paid preparers for their 2004 taxes: 62.6%
Here:
63%
State:
60%
(% for various income ranges: 54.2% for AGIs below $10k, 64.2% for AGIs $10k-25k, 65.1% for AGIs $25k-50k, 63.8% for AGIs $50k-75k, 67.9% for AGIs $75k-100k, 63.9% for AGIs over 100k)
Household received Food Stamps/SNAP in the past 12 months: 74 Household did not receive Food Stamps/SNAP in the past 12 months: 1,415
Women who had a birth in the past 12 months: 11 (11 now married, 0 unmarried) Women who did not have a birth in the past 12 months: 873 (396 now married, 475 unmarried)
Housing units in zip code 49328 with a mortgage: 917 (82 second mortgage, 85 both second mortgage and home equity loan) Houses without a mortgage: 5
Median monthly owner costs for units with a mortgage: $1,203 Median monthly owner costs for units without a mortgage: $460
Residents with income below the poverty level in 2022:
This zip code:
12.9%
Whole state:
13.4%
Residents with income below 50% of the poverty level in 2022:
This zip code:
7.6%
Whole state:
6.9%
Median number of rooms in houses and condos:
Here:
6.0
State:
6.5
Median number of rooms in apartments:
Here:
5.0
State:
4.3
Notable locations in this zip code not listed on our city pages
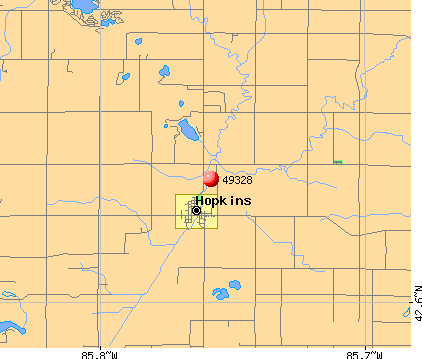
Notable locations in zip code 49328: Hidden Ridge RV Resort (A), Sandy Pines RV Resort (B), Miller Lake Campground (C), East Lake Camping (D), Hopkins Public Library (E), Hopkins Fire Department Station 1 Headquarters (F). Display/hide their locations on the map
Churches in zip code 49328 include: Monterey Church (A), Indian Mission (B), Saint Paul Church (C), Saint Paul's Lutheran Church (D), Monterey Center United Methodist Church (E), Hopkins United Methodist Church (F), Friendship Bible Church (G), Hopkins Community Reformed Church (H). Display/hide their locations on the map
Cemeteries: Ingerson Cemetery (1), Lakeview Cemetery (2), Saint Paul's Evangelical Lutheran Cemetery (3), Maplewood Cemetery (4). Display/hide their locations on the map
Lakes: Pickerel Lake (A), Leggett Lake (B), Ingerson Lake (C), Monterey Lake (D), Herlan Lake (E), Miller Lake (F), McDermott Lake (G), East Lake (H). Display/hide their locations on the map
Size of family households: 413 2-persons, 200 3-persons, 124 4-persons, 103 5-persons, 77 6-persons, 19 7-or-more-persons
Size of nonfamily households: 331 1-person, 233 2-persons
725 married couples with children.
110 single-parent households (22 men, 88 women).
97.3% of residents of 49328 zip code speak English at home.
1.3% of residents speak Spanish at home (62% very well, 38% well).
0.6% of residents speak other Indo-European language at home (87% very well, 13% well).
0.2% of residents speak other language at home (100% very well).
Foreign born population: 29 (0.7%) (56.4% of them are naturalized citizens)
This zip code:
0.7%
Whole state:
6.9%
31%France
24%Bosnia and Herzegovina
7%Germany
21%Dutch
20%German
15%Irish
9%American
7%English
6%Polish
5%European
Year of entry for the foreign-born population
102010 or later
32000 to 2009
01990 to 1999
22Before 1990
Facilities with environmental interests located in this zip code:
AMERITECH CORP (113 N CLARK in HOPKINS, MI)
(Resource Conservation and Recovery Act (tracking hazardous waste))
MI DEPT/STATE POLICE (12TH & 124TH AVE in HOPKINS, MI)
(Resource Conservation and Recovery Act (tracking hazardous waste)) Alternative names: MI DEPT/STATE POLICE (E)
Housing units lacking complete plumbing facilities: 0.3% Housing units lacking complete kitchen facilities: 3.4%
36.3%Bottled, tank, or LP gas
27.3%Utility gas
21.7%Other fuel
5.9%Electricity
5.3%Wood
3.5%Fuel oil, kerosene, etc.
Population in 1990: 2,350. Population change in the 1990s: +1,439 (+61.2%).
Place of birth for U.S.-born residents:
This state: 3,583
Northeast: 34
Midwest: 238
South: 33
West: 18
69% of the 49328 zip code residents lived in the same house 5 years ago. Out of people who lived in different houses, 56% lived in this county. Out of people who lived in different counties, 50% lived in Michigan.
95% of the 49328 zip code residents lived in the same house 1 year ago. Out of people who lived in different houses, 40% moved from this county. Out of people who lived in different houses, 60% moved from different county within same state. Out of people who lived in different houses, 2% moved from different state.
Private vs. public school enrollment:
Students in private schools in grades 1 to 8 (elementary and middle school): 34
Here:
7.8%
Michigan:
12.4%
Students in private schools in grades 9 to 12 (high school): 22
Here:
8.5%
Michigan:
9.8%
Students in private undergraduate colleges: 5
Here:
11.1%
Michigan:
14.9%
Occupation by median earnings in the past 12 months ($)
105,129Computer and mathematical occupations
89,445Management occupations
88,193Community and social service occupations
76,650Architecture and engineering occupations
73,627Business and financial operations occupations
63,974Law enforcement workers including supervisors
Companies with federal contracts located in this zip code:
ALLEGAN COUNTY SAND & GRAVEL (2328 23RD ST in HOPKINS, MI; small business) : $16,540 in 2 contractsfrom 2004 to 2005
$10,530 with Army for Engineering and Technical Services. Signed on 2005-02-15. Completion date: 2005-03-18.
$6,010 with Army for Miscellaneous Vehicular Components. Signed on 2004-09-25. Completion date: 2004-12-15.
Top industries in this zip code by the number of employees in 2005:
Accommodation and Food Services: RV (Recreational Vehicle) Parks and Campgrounds (20-49 employees: 1 establishment, 1-4 employees: 1 establishment)
Construction: Highway, Street, and Bridge Construction (5-9: 2, 1-4: 1)
Information: Motion Picture and Video Production (10-19: 1)
Professional, Scientific, and Technical Services: Veterinary Services (10-19: 1)
Finance and Insurance: Commercial Banking (5-9: 1)
People in group quarters in 2000:
34 people in agriculture workers' dormitories on farms
Fatal accident statistics in 2013:
Fatal accident count: 1
Vehicles involved in fatal accidents: 1
Fatal accidents caused by drunken drivers: 0
Fatalities: 1
Persons involved in fatal accidents: 1
Pedestrians involved in fatal accidents: 1
Home Mortgage Disclosure Act Aggregated Statistics For Year 2003 (Based on 4 partial tracts)
A) FHA, FSA/RHS & VA Home Purchase Loans
B) Conventional Home Purchase Loans
C) Refinancings
D) Home Improvement Loans
F) Non-occupant Loans on < 5 Family Dwellings (A B C & D)
Number
Average Value
Number
Average Value
Number
Average Value
Number
Average Value
Number
Average Value
LOANS ORIGINATED
13
$114,032
79
$109,967
559
$102,927
32
$35,942
21
$97,945
APPLICATIONS APPROVED, NOT ACCEPTED
2
$90,355
12
$815,788
55
$102,187
5
$37,914
4
$57,020
APPLICATIONS DENIED
3
$107,460
36
$71,711
195
$100,688
8
$19,136
12
$46,598
APPLICATIONS WITHDRAWN
0
$0
7
$118,287
89
$114,483
6
$39,660
0
$0
FILES CLOSED FOR INCOMPLETENESS
1
$176,540
5
$129,596
27
$96,820
3
$22,807
3
$127,460
Aggregated Statistics For Year 2002 (Based on 4 partial tracts)
A) FHA, FSA/RHS & VA Home Purchase Loans
B) Conventional Home Purchase Loans
C) Refinancings
D) Home Improvement Loans
F) Non-occupant Loans on < 5 Family Dwellings (A B C & D)
Number
Average Value
Number
Average Value
Number
Average Value
Number
Average Value
Number
Average Value
LOANS ORIGINATED
11
$103,035
85
$101,712
364
$101,446
27
$27,904
16
$85,696
APPLICATIONS APPROVED, NOT ACCEPTED
0
$0
27
$67,679
57
$102,628
4
$42,432
1
$50,590
APPLICATIONS DENIED
2
$69,700
41
$65,352
126
$93,640
13
$6,668
8
$63,986
APPLICATIONS WITHDRAWN
1
$137,880
8
$98,574
76
$100,308
3
$17,180
0
$0
FILES CLOSED FOR INCOMPLETENESS
0
$0
2
$93,615
23
$115,649
1
$12,890
0
$0
Aggregated Statistics For Year 2001 (Based on 4 partial tracts)
A) FHA, FSA/RHS & VA Home Purchase Loans
B) Conventional Home Purchase Loans
C) Refinancings
D) Home Improvement Loans
F) Non-occupant Loans on < 5 Family Dwellings (A B C & D)
Number
Average Value
Number
Average Value
Number
Average Value
Number
Average Value
Number
Average Value
LOANS ORIGINATED
15
$103,072
74
$103,284
376
$90,824
61
$25,641
12
$54,020
APPLICATIONS APPROVED, NOT ACCEPTED
3
$98,793
13
$78,354
55
$86,813
12
$36,442
5
$112,294
APPLICATIONS DENIED
1
$75,210
52
$52,663
158
$79,732
24
$22,608
5
$32,896
APPLICATIONS WITHDRAWN
0
$0
11
$102,898
69
$97,889
1
$12,890
2
$50,205
FILES CLOSED FOR INCOMPLETENESS
0
$0
0
$0
15
$103,610
0
$0
2
$105,660
Aggregated Statistics For Year 2000 (Based on 4 partial tracts)
A) FHA, FSA/RHS & VA Home Purchase Loans
B) Conventional Home Purchase Loans
C) Refinancings
D) Home Improvement Loans
F) Non-occupant Loans on < 5 Family Dwellings (A B C & D)
Number
Average Value
Number
Average Value
Number
Average Value
Number
Average Value
Number
Average Value
LOANS ORIGINATED
10
$84,280
79
$85,282
143
$80,551
71
$24,456
11
$45,274
APPLICATIONS APPROVED, NOT ACCEPTED
0
$0
23
$72,174
33
$80,022
16
$32,384
2
$25,910
APPLICATIONS DENIED
2
$84,365
66
$58,171
90
$82,503
18
$33,698
1
$15,460
APPLICATIONS WITHDRAWN
3
$98,130
8
$89,449
35
$74,766
6
$19,367
0
$0
FILES CLOSED FOR INCOMPLETENESS
0
$0
3
$104,043
15
$75,134
0
$0
0
$0
Aggregated Statistics For Year 1999 (Based on 2 partial tracts)
A) FHA, FSA/RHS & VA Home Purchase Loans
B) Conventional Home Purchase Loans
C) Refinancings
D) Home Improvement Loans
F) Non-occupant Loans on < 5 Family Dwellings (A B C & D)
Detailed PMIC statistics for the following Tracts:0306.00
, 0313.00
2002 - 2018 National Fire Incident Reporting System (NFIRS) incidents
According to the data from the years 2002 - 2018 the average number of fires per year is 19. The highest number of fire incidents - 31 took place in 2009, and the least - 12 in 2008. The data has a rising trend.
When looking into fire subcategories, the most incidents belonged to: Structure Fires (59.7%), and Outside Fires (23.0%).
Fire incident types reported to NFIRS in Zip Code 49328


 Nearest zip codes: 49323, 49335, 49010, 49348, 49070, 49078.


 According to the data from the years 2002 - 2018 the average number of fires per year is 19. The highest number of fire incidents - 31 took place in 2009, and the least - 12 in 2008. The data has a rising trend.
 When looking into fire subcategories, the most incidents belonged to: Structure Fires (59.7%), and Outside Fires (23.0%).