Estimated zip code population in 2022: 2,054 Zip code population in 2010: 2,117 Zip code population in 2000: 1,984
Houses and condos: 905 Renter-occupied apartments: 94
% of renters here:
12%
State:
27%
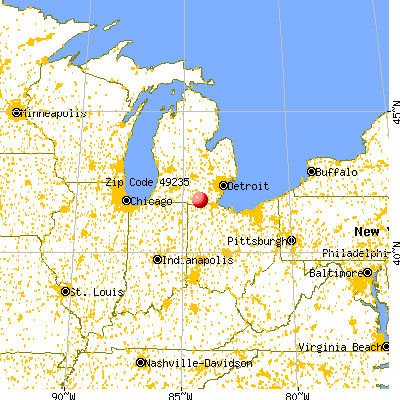
March 2022 cost of living index in zip code 49235: 90.8 (less than average, U.S. average is 100)
Land area: 49.9 sq. mi. Water area: 0.2 sq. mi.
Population density: 41 people per square mile
(very low).
OSM Map
General Map
Google Map
MSN Map
OSM Map
General Map
Google Map
MSN Map
OSM Map
General Map
Google Map
MSN Map
OSM Map
General Map
Google Map
MSN Map
Please wait while loading the map...
Real estate property taxes paid for housing units in 2022:
This zip code:
1.0% ($1,711)
Michigan:
1.2% ($2,746)
Median real estate property taxes paid for housing units with mortgages in 2022: $1,847 (1.0%) Median real estate property taxes paid for housing units with no mortgage in 2022: $1,473 (1.2%)
Business Search- 14 Million verified businesses
Males: 949
(46.2%)
Females: 1,104
(53.8%)
For population 25 years and over in 49235:
High school or higher: 86.6%
Bachelor's degree or higher: 14.9%
Graduate or professional degree: 5.4%
Unemployed: 3.8%
Mean travel time to work (commute): 30.3 minutes
For population 15 years and over in 49235:
Never married: 22.8%
Now married: 58.4%
Separated: 0.5%
Widowed: 8.9%
Divorced: 9.4%
Zip code 49235 compared to state average:
Black race population percentage significantly below state average.
Hispanic race population percentage below state average.
Median age above state average.
Foreign-born population percentage significantly below state average.
Renting percentage significantly below state average.
Length of stay since moving in significantly above state average.
Number of college students below state average.
Percentage of population with a bachelor's degree or higher below state average.
Estimated median house/condo value in 2022: $173,293
49235:
$173,293
Michigan:
$224,400
According to our research of Michigan and other state lists, there were 7 registered sex offenders living in 49235 zip code as of May 25, 2024. The ratio of all residents to sex offenders in zip code 49235 is 323 to 1. The ratio of registered sex offenders to all residents in this zip code is near the state average.
Median resident age:
This zip code:
44.5 years
Michigan median age:
40.3 years
Average household size:
This zip code:
2.5 people
Michigan:
2.4 people
Averages for the 2020 tax year for zip code 49235, filed in 2021:
Average Adjusted Gross Income (AGI) in 2020: $49,464 (Individual Income Tax Returns)
Here:
$49,464
State:
$68,945
Salary/wage: $44,742 (reported on 77.9% of returns)
Here:
$44,742
State:
$57,142
(% of AGI for various income ranges: 1038.8% for AGIs below $25k, 3365.6% for AGIs $25k-50k, 6908.0% for AGIs $50k-75k, 10051.7% for AGIs $75k-100k, 16598.6% for AGIs $100k-200k)
Taxable interest for individuals: $1,584 (reported on 26.3% of returns)
This zip code:
$1,584
Michigan:
$1,630
(% of AGI for various income ranges: 18.3% for AGIs below $25k, 14.4% for AGIs $25k-50k, 20.0% for AGIs $50k-75k, 25.0% for AGIs $75k-100k, 415.7% for AGIs $100k-200k)
Ordinary dividends: $2,164 (reported on 14.7% of returns)
Here:
$2,164
State:
$6,972
(% of AGI for various income ranges: 7.9% for AGIs below $25k, 31.1% for AGIs $25k-50k, 46.0% for AGIs $50k-75k, 260.0% for AGIs $100k-200k)
Net capital gain/loss in AGI: +$13,431 (reported on 13.7% of returns)
Here:
+$13,431
State:
+$20,064
(% of AGI for various income ranges: 12.9% for AGIs below $25k, 19.4% for AGIs $25k-50k, 152.0% for AGIs $50k-75k, 2182.9% for AGIs $100k-200k)
Profit/loss from business: +$7,087 (reported on 15.8% of returns)
Here:
+$7,087
State:
+$11,172
(% of AGI for various income ranges: 109.2% for AGIs below $25k, 236.7% for AGIs $25k-50k, 286.0% for AGIs $50k-75k, 127.1% for AGIs $100k-200k)
Taxable individual retirement arrangement distribution: $12,456 (reported on 9.5% of returns)
49235:
$12,456
Michigan:
$19,803
(% of AGI for various income ranges: 89.2% for AGIs below $25k, 174.4% for AGIs $25k-50k, 847.1% for AGIs $100k-200k)
Total itemized deductions: $21,500 (reported on 2.1% of returns)
Here:
$21,500
State:
$34,117
(% of AGI for various income ranges: 238.9% for AGIs $25k-50k)
Taxes paid: $6,050 (reported on 2.1% of returns)
49235:
$6,050
State:
$7,972
(% of AGI for various income ranges: 67.2% for AGIs $25k-50k)
Earned income credit: $2,046 (reported on 13.7% of returns)
Here:
$2,046
State:
$2,251
(% of AGI for various income ranges: 60.4% for AGIs below $25k, 67.2% for AGIs $25k-50k)
Percentage of individuals using paid preparers for their 2020 taxes: 96.8%
Here:
97%
State:
93%
(% for various income ranges: 91.9% for AGIs below $25k, 100.0% for AGIs $25k-50k, 100.0% for AGIs $50k-75k, 100.0% for AGIs $75k-100k, 100.0% for AGIs $100k-200k)
Averages for the 2012 tax year for zip code 49235, filed in 2013:
Average Adjusted Gross Income (AGI) in 2012: $41,182 (Individual Income Tax Returns)
Here:
$41,182
State:
$55,609
Salary/wage: $36,118 (reported on 84.2% of returns)
Here:
$36,118
State:
$46,782
(% of AGI for various income ranges: 65.9% for AGIs below $25k, 78.5% for AGIs $25k-50k, 76.8% for AGIs $50k-75k, 80.4% for AGIs $75k-100k, 66.7% for AGIs $100k-200k)
Taxable interest for individuals: $782 (reported on 29.5% of returns)
This zip code:
$782
Michigan:
$1,491
(% of AGI for various income ranges: 1.3% for AGIs below $25k, 0.6% for AGIs $25k-50k, 0.4% for AGIs $50k-75k, 0.2% for AGIs $75k-100k, 0.6% for AGIs $100k-200k)
Ordinary dividends: $2,450 (reported on 12.6% of returns)
Here:
$2,450
State:
$6,225
(% of AGI for various income ranges: 0.8% for AGIs below $25k, 0.5% for AGIs $25k-50k, 0.9% for AGIs $50k-75k, 1.3% for AGIs $100k-200k)
Net capital gain/loss in AGI: +$2,545 (reported on 11.6% of returns)
Here:
+$2,545
State:
+$9,326
(% of AGI for various income ranges: 0.4% for AGIs $50k-75k, 2.7% for AGIs $100k-200k)
Profit/loss from business: +$4,267 (reported on 12.6% of returns)
Here:
+$4,267
State:
+$11,523
(% of AGI for various income ranges: 5.5% for AGIs below $25k, 1.9% for AGIs $25k-50k, 0.7% for AGIs $50k-75k, 0.2% for AGIs $75k-100k)
Taxable individual retirement arrangement distribution: $11,330 (reported on 10.5% of returns)
49235:
$11,330
Michigan:
$15,298
(% of AGI for various income ranges: 3.3% for AGIs below $25k, 4.9% for AGIs $25k-50k, 9.1% for AGIs $75k-100k)
Total itemized deductions: $16,205 (23% of AGI, reported on 20.0% of returns)
Here:
$16,205
State:
$21,628
Here:
23.3% of AGI
State:
18.4% of AGI
(% of AGI for various income ranges: 9.0% for AGIs $25k-50k, 8.2% for AGIs $50k-75k, 11.8% for AGIs $75k-100k, 7.9% for AGIs $100k-200k)
Charity contributions: $2,443 (reported on 14.7% of returns)
Here:
$2,443
State:
$4,225
(% of AGI for various income ranges: 0.4% for AGIs $25k-50k, 1.0% for AGIs $50k-75k, 1.3% for AGIs $75k-100k, 1.4% for AGIs $100k-200k)
Taxes paid: $5,163 (reported on 20.0% of returns)
49235:
$5,163
State:
$8,327
(% of AGI for various income ranges: 1.9% for AGIs $25k-50k, 2.5% for AGIs $50k-75k, 3.8% for AGIs $75k-100k, 3.5% for AGIs $100k-200k)
Earned income credit: $2,400 (reported on 17.9% of returns)
Here:
$2,400
State:
$2,306
(% of AGI for various income ranges: 6.1% for AGIs below $25k, 1.3% for AGIs $25k-50k)
Percentage of individuals using paid preparers for their 2012 taxes: 64.2%
Here:
64%
State:
57%
(% for various income ranges: 59.0% for AGIs below $25k, 61.5% for AGIs $25k-50k, 80.0% for AGIs $50k-75k, 57.1% for AGIs $75k-100k, 75.0% for AGIs $100k-200k)
Averages for the 2004 tax year for zip code 49235, filed in 2005:
Average Adjusted Gross Income (AGI) in 2004: $39,113 (Individual Income Tax Returns)
Here:
$39,113
State:
$48,204
Salary/wage: $37,688 (reported on 87.4% of returns)
Here:
$37,688
State:
$42,791
(% of AGI for various income ranges: 99.4% for AGIs below $10k, 77.0% for AGIs $10k-25k, 85.2% for AGIs $25k-50k, 86.2% for AGIs $50k-75k, 83.9% for AGIs $75k-100k, 81.9% for AGIs over 100k)
Taxable interest for individuals: $1,197 (reported on 43.4% of returns)
This zip code:
$1,197
Michigan:
$1,725
(% of AGI for various income ranges: 6.5% for AGIs below $10k, 2.3% for AGIs $10k-25k, 1.1% for AGIs $25k-50k, 1.3% for AGIs $50k-75k, 0.8% for AGIs $75k-100k, 1.2% for AGIs over 100k)
Taxable dividends: $1,481 (reported on 16.2% of returns)
Here:
$1,481
State:
$3,420
(% of AGI for various income ranges: 3.2% for AGIs below $10k, 0.2% for AGIs $10k-25k, 0.3% for AGIs $25k-50k, 0.3% for AGIs $50k-75k, 0.6% for AGIs $75k-100k, 1.6% for AGIs over 100k)
Net capital gain/loss: +$3,510 (reported on 14.7% of returns)
Here:
+$3,510
State:
+$8,532
(% of AGI for various income ranges: -3.6% for AGIs below $10k, -0.2% for AGIs $10k-25k, 0.9% for AGIs $25k-50k, 1.2% for AGIs $50k-75k, 3.8% for AGIs $75k-100k, 0.8% for AGIs over 100k)
Profit/loss from business: +$2,864 (reported on 12.0% of returns)
Here:
+$2,864
State:
+$9,547
(% of AGI for various income ranges: 2.8% for AGIs $10k-25k, 2.2% for AGIs $25k-50k, -0.3% for AGIs $50k-75k, 0.6% for AGIs $75k-100k)
IRA payment deduction: $3,625 (reported on 1.6% of returns)
49235:
$3,625
Michigan:
$2,875
Total itemized deductions: $14,365 (22% of AGI, reported on 27.5% of returns)
Here:
$14,365
State:
$18,509
Here:
21.7% of AGI
State:
20.7% of AGI
(% of AGI for various income ranges: 6.3% for AGIs $10k-25k, 8.5% for AGIs $25k-50k, 11.4% for AGIs $50k-75k, 11.9% for AGIs $75k-100k, 11.7% for AGIs over 100k)
Charity contributions deductions: $2,347 (3% of AGI, reported on 21.6% of returns)
Here:
$2,347
State:
$3,365
Here:
3.4% of AGI
State:
3.6% of AGI
(% of AGI for various income ranges: 1.1% for AGIs below $10k, 1.3% for AGIs $25k-50k, 1.5% for AGIs $50k-75k, 1.0% for AGIs $75k-100k, 2.1% for AGIs over 100k)
Total tax: $4,556 (reported on 74.9% of returns)
49235:
$4,556
State:
$7,691
(% of AGI for various income ranges: 2.7% for AGIs below $10k, 3.7% for AGIs $10k-25k, 6.4% for AGIs $25k-50k, 8.2% for AGIs $50k-75k, 10.3% for AGIs $75k-100k, 15.2% for AGIs over 100k)
Earned income credit: $1,720 (reported on 13.4% of returns)
Here:
$1,720
State:
$1,737
Percentage of individuals using paid preparers for their 2004 taxes: 65.5%
Here:
65%
State:
60%
(% for various income ranges: 60.4% for AGIs below $10k, 66.5% for AGIs $10k-25k, 64.6% for AGIs $25k-50k, 68.0% for AGIs $50k-75k, 70.0% for AGIs $75k-100k, 70.8% for AGIs over 100k)
Household received Food Stamps/SNAP in the past 12 months: 75 Household did not receive Food Stamps/SNAP in the past 12 months: 734
Women who had a birth in the past 12 months: 5 (4 now married, 0 unmarried) Women who did not have a birth in the past 12 months: 433 (235 now married, 196 unmarried)
Housing units in zip code 49235 with a mortgage: 370 (60 second mortgage, 61 both second mortgage and home equity loan) Median monthly owner costs for units with a mortgage: $1,252 Median monthly owner costs for units without a mortgage: $398
Residents with income below the poverty level in 2022:
This zip code:
6.9%
Whole state:
13.4%
Residents with income below 50% of the poverty level in 2022:
This zip code:
3.4%
Whole state:
6.9%
Median number of rooms in houses and condos:
Here:
6.9
State:
6.5
Median number of rooms in apartments:
Here:
5.1
State:
4.3
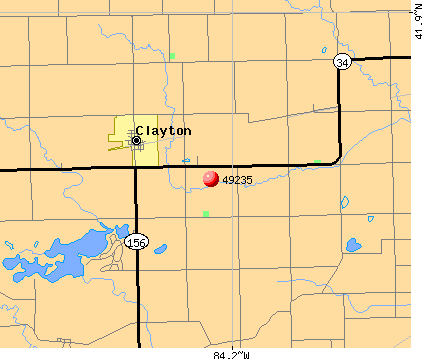
Notable locations in this zip code not listed on our city pages
Notable locations in zip code 49235: Four Towns Grange Hall (A), Clayton Library (B), Dover Township Hall (C), Clayton Fire Department (D). Display/hide their locations on the map
Churches in zip code 49235 include: Demings Lake Church (A), Clayton Bible Church (B), United Methodist Church (C), Rollin Center United Methodist Church (D). Display/hide their locations on the map
Lakes and reservoirs: Rice Lake (A), Haley Lake (B), Vales Lake (C), Little Posey Lake (D), Demings Lake (E), Lake Hudson (F). Display/hide their locations on the map
Streams, rivers, and creeks: Warren Drain (A), Furman Drain (B), Benner Drain (C), Harrison Drain (D), Big Swamp Drain (E), Henning Drain (F), Bird Drain (G), Ketcham Drain (H), Bovee Drain (I). Display/hide their locations on the map
In group quarters: 4 (-1 institutionalized population)
Size of family households: 300 2-persons, 96 3-persons, 93 4-persons, 44 5-persons, 26 6-persons, 4 7-or-more-persons
Size of nonfamily households: 211 1-person, 36 2-persons
296 married couples with children.
71 single-parent households (24 men, 47 women).
96.6% of residents of 49235 zip code speak English at home.
1.5% of residents speak Spanish at home (80% very well, 17% well, 3% not well).
1.7% of residents speak other Indo-European language at home (59% very well, 15% well, 26% not well).
Foreign born population: 24 (1.2%) (33.1% of them are naturalized citizens)
This zip code:
1.2%
Whole state:
6.9%
48%Honduras
24%France
16%Malaysia
33%American
28%German
21%English
5%Polish
3%Irish
1%European
1%Hungarian
Year of entry for the foreign-born population
122010 or later
12000 to 2009
31990 to 1999
7Before 1990
Facilities with environmental interests located in this zip code:
BAKERLADS FARMS (10960 CADMUS RD. in CLAYTON, MI)
ENFORCEMENT/COMPLIANCE ACTIVITY (Integrated Compliance Information System) National Pollutant Discharge Elimination System NON-MAJOR (Tracking pollutant discharge elimination systems) - permit Business SIC classification: DAIRY FARMS
BATES AUTOBODY INC (9091 W CARLETON in CLAYTON, MI)
Conditionally Exempt Small Quantity Generators, less than 100 kg/month of hazardous waste (Resource Conservation and Recovery Act (tracking hazardous waste)) Business NAICS classification: AUTOMOTIVE BODY, PAINT, AND INTERIOR REPAIR AND MAINTENANCE. Organizations: RICKY GENE BATES (CONTACT/OPERATOR)
Housing units lacking complete plumbing facilities: 4.8% Housing units lacking complete kitchen facilities: 3.7%
58.0%Bottled, tank, or LP gas
28.8%Utility gas
6.9%Wood
3.3%Electricity
2.5%Fuel oil, kerosene, etc.
0.5%Other fuel
Population in 1990: 2,000.
Place of birth for U.S.-born residents:
This state: 1,717
Northeast: 14
Midwest: 137
South: 132
West: 23
67% of the 49235 zip code residents lived in the same house 5 years ago. Out of people who lived in different houses, 80% lived in this county. Out of people who lived in different counties, 50% lived in Michigan.
99% of the 49235 zip code residents lived in the same house 1 year ago. Out of people who lived in different houses, 21% moved from this county. Out of people who lived in different houses, 32% moved from different county within same state. Out of people who lived in different houses, 79% moved from different state.
Private vs. public school enrollment:
Students in private schools in grades 1 to 8 (elementary and middle school): 61
Here:
23.9%
Michigan:
12.4%
Students in private schools in grades 9 to 12 (high school): 2
Here:
3.4%
Michigan:
9.8%
Students in private undergraduate colleges: 6
Here:
15.0%
Michigan:
14.9%
Occupation by median earnings in the past 12 months ($)
100,492Community and social service occupations
94,828Architecture and engineering occupations
72,810Management occupations
66,897Installation, maintenance, and repair occupations
66,023Computer and mathematical occupations
53,618Sales and related occupations
Top industries in this zip code by the number of employees in 2005:
Arts, Entertainment, and Recreation: All Other Amusement and Recreation Industries (10-19 employees: 1 establishment)
Detailed PMIC statistics for the following Tracts:0605.00
, 0618.00
2002 - 2018 National Fire Incident Reporting System (NFIRS) incidents
According to the data from the years 2002 - 2018 the average number of fires per year is 17. The highest number of fire incidents - 29 took place in 2018, and the least - 3 in 2014. The data has a growing trend.
When looking into fire subcategories, the most incidents belonged to: Structure Fires (54.1%), and Outside Fires (31.3%).
Fire incident types reported to NFIRS in Zip Code 49235


 Nearest zip codes: 49256, 49253, 49279, 49289, 49247, 49221.


 According to the data from the years 2002 - 2018 the average number of fires per year is 17. The highest number of fire incidents - 29 took place in 2018, and the least - 3 in 2014. The data has a growing trend.
 When looking into fire subcategories, the most incidents belonged to: Structure Fires (54.1%), and Outside Fires (31.3%).