Estimated zip code population in 2022: 2,669 Zip code population in 2010: 3,166 Zip code population in 2000: 2,977
Houses and condos: 2,159 Renter-occupied apartments: 86
% of renters here:
7%
State:
27%
March 2022 cost of living index in zip code 49253: 90.4 (less than average, U.S. average is 100)
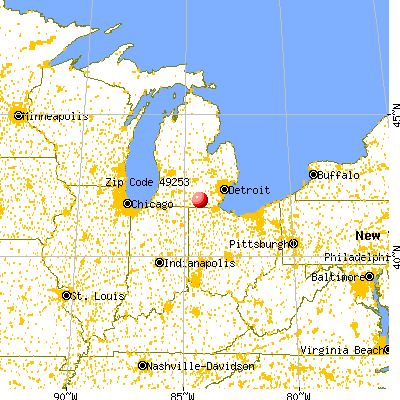
Land area: 24.5 sq. mi. Water area: 2.9 sq. mi.
Population density: 109 people per square mile
(very low).
OSM Map
General Map
Google Map
MSN Map
OSM Map
General Map
Google Map
MSN Map
OSM Map
General Map
Google Map
MSN Map
OSM Map
General Map
Google Map
MSN Map
Please wait while loading the map...
Real estate property taxes paid for housing units in 2022:
This zip code:
1.2% ($2,879)
Michigan:
1.2% ($2,746)
Median real estate property taxes paid for housing units with mortgages in 2022: $3,076 (1.2%) Median real estate property taxes paid for housing units with no mortgage in 2022: $2,544 (1.2%)
Business Search- 14 Million verified businesses
Males: 1,359
(50.9%)
Females: 1,310
(49.1%)
For population 25 years and over in 49253:
High school or higher: 95.8%
Bachelor's degree or higher: 37.8%
Graduate or professional degree: 11.3%
Unemployed: 2.3%
Mean travel time to work (commute): 36.9 minutes
For population 15 years and over in 49253:
Never married: 19.5%
Now married: 61.3%
Separated: 1.5%
Widowed: 4.6%
Divorced: 13.2%
Zip code 49253 compared to state average:
Unemployed percentage below state average.
Black race population percentage significantly below state average.
Hispanic race population percentage below state average.
Median age significantly above state average.
Foreign-born population percentage significantly below state average.
Renting percentage significantly below state average.
Length of stay since moving in significantly above state average.
Estimated median house/condo value in 2022: $236,674
49253:
$236,674
Michigan:
$224,400
According to our research of Michigan and other state lists, there were 7 registered sex offenders living in 49253 zip code as of May 23, 2024. The ratio of all residents to sex offenders in zip code 49253 is 429 to 1. The ratio of registered sex offenders to all residents in this zip code is lower than the state average.
Median resident age:
This zip code:
56.0 years
Michigan median age:
40.3 years
Average household size:
This zip code:
2.2 people
Michigan:
2.4 people
Averages for the 2020 tax year for zip code 49253, filed in 2021:
Average Adjusted Gross Income (AGI) in 2020: $81,638 (Individual Income Tax Returns)
Here:
$81,638
State:
$68,945
Salary/wage: $67,930 (reported on 71.2% of returns)
Here:
$67,930
State:
$57,142
(% of AGI for various income ranges: 953.7% for AGIs below $25k, 2841.2% for AGIs $25k-50k, 5864.1% for AGIs $50k-75k, 9164.0% for AGIs $75k-100k, 11805.0% for AGIs $100k-200k)
Taxable interest for individuals: $1,406 (reported on 34.6% of returns)
This zip code:
$1,406
Michigan:
$1,630
(% of AGI for various income ranges: 19.3% for AGIs below $25k, 18.1% for AGIs $25k-50k, 47.1% for AGIs $50k-75k, 67.0% for AGIs $75k-100k, 94.4% for AGIs $100k-200k)
Ordinary dividends: $5,951 (reported on 23.7% of returns)
Here:
$5,951
State:
$6,972
(% of AGI for various income ranges: 31.0% for AGIs below $25k, 36.2% for AGIs $25k-50k, 134.7% for AGIs $50k-75k, 247.0% for AGIs $75k-100k, 269.4% for AGIs $100k-200k)
Net capital gain/loss in AGI: +$14,157 (reported on 22.4% of returns)
Here:
+$14,157
State:
+$20,064
(% of AGI for various income ranges: 6.3% for AGIs below $25k, 35.4% for AGIs $25k-50k, 109.4% for AGIs $50k-75k, 221.0% for AGIs $75k-100k, 670.6% for AGIs $100k-200k)
Profit/loss from business: +$16,365 (reported on 16.7% of returns)
Here:
+$16,365
State:
+$11,172
(% of AGI for various income ranges: 142.7% for AGIs below $25k, 145.4% for AGIs $25k-50k, 208.8% for AGIs $50k-75k, 227.0% for AGIs $75k-100k, 384.4% for AGIs $100k-200k)
Taxable individual retirement arrangement distribution: $26,366 (reported on 18.6% of returns)
49253:
$26,366
Michigan:
$19,803
(% of AGI for various income ranges: 109.3% for AGIs below $25k, 284.6% for AGIs $25k-50k, 414.7% for AGIs $50k-75k, 1106.0% for AGIs $75k-100k, 1184.4% for AGIs $100k-200k)
Total itemized deductions: $34,667 (reported on 7.7% of returns)
Here:
$34,667
State:
$34,117
(% of AGI for various income ranges: 644.1% for AGIs $50k-75k, 742.5% for AGIs $100k-200k)
Charity contributions: $11,833 (reported on 5.8% of returns)
Here:
$11,833
State:
$13,548
(% of AGI for various income ranges: 87.1% for AGIs $50k-75k, 185.0% for AGIs $100k-200k)
Taxes paid: $7,300 (reported on 8.3% of returns)
49253:
$7,300
State:
$7,972
(% of AGI for various income ranges: 155.3% for AGIs $50k-75k, 209.4% for AGIs $100k-200k)
Earned income credit: $2,112 (reported on 10.3% of returns)
Here:
$2,112
State:
$2,251
(% of AGI for various income ranges: 66.3% for AGIs below $25k, 53.5% for AGIs $25k-50k)
Percentage of individuals using paid preparers for their 2020 taxes: 95.5%
Here:
96%
State:
93%
(% for various income ranges: 93.6% for AGIs below $25k, 97.0% for AGIs $25k-50k, 96.0% for AGIs $50k-75k, 89.5% for AGIs $75k-100k, 100.0% for AGIs $100k-200k, 100.0% for AGIs over 200k)
Averages for the 2012 tax year for zip code 49253, filed in 2013:
Average Adjusted Gross Income (AGI) in 2012: $52,948 (Individual Income Tax Returns)
Here:
$52,948
State:
$55,609
Salary/wage: $44,233 (reported on 79.0% of returns)
Here:
$44,233
State:
$46,782
(% of AGI for various income ranges: 61.2% for AGIs below $25k, 67.1% for AGIs $25k-50k, 70.7% for AGIs $50k-75k, 62.9% for AGIs $75k-100k, 69.6% for AGIs $100k-200k, 60.4% for AGIs over 200k)
Taxable interest for individuals: $1,055 (reported on 35.7% of returns)
This zip code:
$1,055
Michigan:
$1,491
(% of AGI for various income ranges: 1.5% for AGIs below $25k, 0.7% for AGIs $25k-50k, 0.6% for AGIs $50k-75k, 0.7% for AGIs $75k-100k, 0.3% for AGIs $100k-200k, 1.0% for AGIs over 200k)
Ordinary dividends: $3,017 (reported on 21.0% of returns)
Here:
$3,017
State:
$6,225
(% of AGI for various income ranges: 1.2% for AGIs below $25k, 0.6% for AGIs $25k-50k, 1.3% for AGIs $50k-75k, 1.9% for AGIs $75k-100k, 0.6% for AGIs $100k-200k, 1.8% for AGIs over 200k)
Net capital gain/loss in AGI: +$2,768 (reported on 15.4% of returns)
Here:
+$2,768
State:
+$9,326
(% of AGI for various income ranges: 0.3% for AGIs $25k-50k, 0.4% for AGIs $50k-75k, 0.2% for AGIs $75k-100k, 0.5% for AGIs $100k-200k, 3.2% for AGIs over 200k)
Profit/loss from business: +$8,236 (reported on 15.4% of returns)
Here:
+$8,236
State:
+$11,523
(% of AGI for various income ranges: 7.5% for AGIs below $25k, 3.9% for AGIs $25k-50k, 2.1% for AGIs $50k-75k, 3.5% for AGIs $75k-100k, 0.9% for AGIs $100k-200k)
Taxable individual retirement arrangement distribution: $17,485 (reported on 14.0% of returns)
49253:
$17,485
Michigan:
$15,298
(% of AGI for various income ranges: 4.0% for AGIs below $25k, 4.1% for AGIs $25k-50k, 3.7% for AGIs $50k-75k, 3.9% for AGIs $75k-100k, 9.9% for AGIs $100k-200k)
Total itemized deductions: $20,213 (21% of AGI, reported on 32.9% of returns)
Here:
$20,213
State:
$21,628
Here:
21.0% of AGI
State:
18.4% of AGI
(% of AGI for various income ranges: 8.8% for AGIs below $25k, 11.2% for AGIs $25k-50k, 11.5% for AGIs $50k-75k, 14.4% for AGIs $75k-100k, 13.9% for AGIs $100k-200k, 13.1% for AGIs over 200k)
Charity contributions: $3,317 (reported on 25.2% of returns)
Here:
$3,317
State:
$4,225
(% of AGI for various income ranges: 0.6% for AGIs below $25k, 0.6% for AGIs $25k-50k, 1.3% for AGIs $50k-75k, 1.9% for AGIs $75k-100k, 2.2% for AGIs $100k-200k, 2.0% for AGIs over 200k)
Taxes paid: $7,528 (reported on 32.9% of returns)
49253:
$7,528
State:
$8,327
(% of AGI for various income ranges: 1.9% for AGIs below $25k, 3.2% for AGIs $25k-50k, 3.7% for AGIs $50k-75k, 5.1% for AGIs $75k-100k, 5.6% for AGIs $100k-200k, 6.8% for AGIs over 200k)
Earned income credit: $2,135 (reported on 14.0% of returns)
Here:
$2,135
State:
$2,306
(% of AGI for various income ranges: 5.4% for AGIs below $25k, 0.7% for AGIs $25k-50k)
Percentage of individuals using paid preparers for their 2012 taxes: 65.7%
Here:
66%
State:
57%
(% for various income ranges: 58.2% for AGIs below $25k, 71.0% for AGIs $25k-50k, 75.0% for AGIs $50k-75k, 66.7% for AGIs $75k-100k, 64.3% for AGIs $100k-200k, 75.0% for AGIs over 200k)
Averages for the 2004 tax year for zip code 49253, filed in 2005:
Average Adjusted Gross Income (AGI) in 2004: $50,641 (Individual Income Tax Returns)
Here:
$50,641
State:
$48,204
Salary/wage: $40,902 (reported on 83.8% of returns)
Here:
$40,902
State:
$42,791
(% of AGI for various income ranges: 86.2% for AGIs below $10k, 62.1% for AGIs $10k-25k, 75.7% for AGIs $25k-50k, 78.7% for AGIs $50k-75k, 80.2% for AGIs $75k-100k, 52.3% for AGIs over 100k)
Taxable interest for individuals: $2,025 (reported on 52.0% of returns)
This zip code:
$2,025
Michigan:
$1,725
(% of AGI for various income ranges: 4.8% for AGIs below $10k, 3.4% for AGIs $10k-25k, 0.9% for AGIs $25k-50k, 0.8% for AGIs $50k-75k, 1.4% for AGIs $75k-100k, 3.3% for AGIs over 100k)
Taxable dividends: $2,858 (reported on 24.9% of returns)
Here:
$2,858
State:
$3,420
(% of AGI for various income ranges: 2.1% for AGIs below $10k, 1.2% for AGIs $10k-25k, 0.6% for AGIs $25k-50k, 0.7% for AGIs $50k-75k, 0.6% for AGIs $75k-100k, 2.5% for AGIs over 100k)
Net capital gain/loss: +$12,430 (reported on 18.3% of returns)
Here:
+$12,430
State:
+$8,532
(% of AGI for various income ranges: -1.7% for AGIs below $10k, 0.3% for AGIs $10k-25k, 0.1% for AGIs $25k-50k, 0.2% for AGIs $50k-75k, 1.4% for AGIs $75k-100k, 11.5% for AGIs over 100k)
Profit/loss from business: +$8,934 (reported on 17.9% of returns)
Here:
+$8,934
State:
+$9,547
(% of AGI for various income ranges: 8.2% for AGIs below $10k, 7.3% for AGIs $10k-25k, 3.7% for AGIs $25k-50k, 3.3% for AGIs $50k-75k, 1.8% for AGIs $75k-100k, 2.5% for AGIs over 100k)
IRA payment deduction: $3,471 (reported on 2.4% of returns)
49253:
$3,471
Michigan:
$2,875
Total itemized deductions: $17,981 (21% of AGI, reported on 39.8% of returns)
Here:
$17,981
State:
$18,509
Here:
21.0% of AGI
State:
20.7% of AGI
(% of AGI for various income ranges: 8.5% for AGIs below $10k, 16.3% for AGIs $10k-25k, 13.1% for AGIs $25k-50k, 15.1% for AGIs $50k-75k, 15.0% for AGIs $75k-100k, 13.5% for AGIs over 100k)
Charity contributions deductions: $2,776 (3% of AGI, reported on 35.6% of returns)
Here:
$2,776
State:
$3,365
Here:
3.1% of AGI
State:
3.6% of AGI
(% of AGI for various income ranges: 1.7% for AGIs $10k-25k, 1.0% for AGIs $25k-50k, 2.1% for AGIs $50k-75k, 1.8% for AGIs $75k-100k, 2.5% for AGIs over 100k)
Total tax: $7,779 (reported on 78.7% of returns)
49253:
$7,779
State:
$7,691
(% of AGI for various income ranges: 3.7% for AGIs below $10k, 4.6% for AGIs $10k-25k, 6.8% for AGIs $25k-50k, 9.4% for AGIs $50k-75k, 10.6% for AGIs $75k-100k, 18.6% for AGIs over 100k)
Earned income credit: $1,555 (reported on 9.5% of returns)
Here:
$1,555
State:
$1,737
Percentage of individuals using paid preparers for their 2004 taxes: 65.6%
Here:
66%
State:
60%
(% for various income ranges: 52.9% for AGIs below $10k, 59.9% for AGIs $10k-25k, 69.6% for AGIs $25k-50k, 70.0% for AGIs $50k-75k, 67.2% for AGIs $75k-100k, 82.9% for AGIs over 100k)
Churches in zip code 49253 include: Devils Lake Drive-in Church (A), West Rome Church (B), Rollin Center Church (C), Rollin Church (D), North Rome Church (E), Manitou Road Baptist Church (F), Saint Mary on the Lake Catholic Church (G). Display/hide their locations on the map
Cemeteries: Greens Cemetery (1), Hand Hillside Cemetery (2), Rollin Center Cemetery (3), Quaker Cemetery (4), North Rome Cemetery (5). Display/hide their locations on the map
Size of family households: 538 2-persons, 149 3-persons, 107 4-persons, 31 5-persons, 8 7-or-more-persons
Size of nonfamily households: 358 1-person, 46 2-persons
245 married couples with children.
95 single-parent households (25 men, 70 women).
99.1% of residents of 49253 zip code speak English at home.
1.6% of residents speak Spanish at home (39% very well, 12% well, 49% not well).
Foreign born population: 45 (1.7%) (0.0% of them are naturalized citizens)
:
1.7%
Whole state:
6.9%
51%Honduras
38%France
43%German
20%English
11%American
5%Polish
4%Irish
3%European
3%Hungarian
Year of entry for the foreign-born population
02010 or later
02000 to 2009
171990 to 1999
25Before 1990
Facilities with environmental interests located in this zip code:
FRED SEMELKA (2770 ROUND LAKE HIGHWAY in MANITOU BEACH, MI)
Conditionally Exempt Small Quantity Generators, less than 100 kg/month of hazardous waste (Resource Conservation and Recovery Act (tracking hazardous waste))
GLAMOUR AUTO SHOP (891 MANITOU RD in MANITOU BEACH, MI)
Conditionally Exempt Small Quantity Generators, less than 100 kg/month of hazardous waste (Resource Conservation and Recovery Act (tracking hazardous waste)) Business NAICS classification: AUTOMOTIVE BODY, PAINT, AND INTERIOR REPAIR AND MAINTENANCE. Organizations: AL HEDRICK (CONTACT/OPERATOR)
Housing units lacking complete plumbing facilities: 0.9% Housing units lacking complete kitchen facilities: 1.4%
75.7%Utility gas
13.8%Bottled, tank, or LP gas
4.4%Electricity
2.9%Fuel oil, kerosene, etc.
2.6%Wood
0.7%No fuel used
Population in 1990: 2,714. Population change in the 1990s: +263 (+9.7%).
Place of birth for U.S.-born residents:
This state: 1,980
Northeast: 125
Midwest: 360
South: 130
West: 31
57% of the 49253 zip code residents lived in the same house 5 years ago. Out of people who lived in different houses, 60% lived in this county. Out of people who lived in different counties, 50% lived in Michigan.
96% of the 49253 zip code residents lived in the same house 1 year ago. Out of people who lived in different houses, 61% moved from this county. Out of people who lived in different houses, 6% moved from different county within same state. Out of people who lived in different houses, 40% moved from different state.
Private vs. public school enrollment:
Students in private schools in grades 1 to 8 (elementary and middle school): 12
Here:
6.6%
Michigan:
12.4%
Students in private schools in grades 9 to 12 (high school): 4
Here:
4.6%
Michigan:
9.8%
Students in private undergraduate colleges: 34
Here:
44.3%
Michigan:
14.9%
Occupation by median earnings in the past 12 months ($)
66,836Construction and extraction occupations
64,735Installation, maintenance, and repair occupations
57,699Management occupations
53,290Office and administrative support occupations
52,291Health technologists and technicians
45,369Business and financial operations occupations
Top industries in this zip code by the number of employees in 2005:
Health Care and Social Assistance: Services for the Elderly and Persons with Disabilities (100-249 employees: 1 establishment)
Accommodation and Food Services: Full-Service Restaurants (10-19: 1, 1-4: 1)
Other Services (except Public Administration): Religious Organizations (5-9: 1, 1-4: 1)
Construction: Residential Remodelers (5-9: 1)
Construction: Electrical Contractors (5-9: 1)
People in group quarters in 2000:
6 people in homes for the mentally retarded
Fatal accident statistics in 2014:
Fatal accident count: 1
Vehicles involved in fatal accidents: 1
Fatal accidents caused by drunken drivers: 0
Fatalities: 1
Persons involved in fatal accidents: 1
Pedestrians involved in fatal accidents: 0
Fatal accident statistics in 2013:
Fatal accident count: 1
Vehicles involved in fatal accidents: 1
Fatal accidents caused by drunken drivers: 1
Fatalities: 1
Persons involved in fatal accidents: 2
Pedestrians involved in fatal accidents: 0
Home Mortgage Disclosure Act Aggregated Statistics For Year 2003 (Based on 4 partial tracts)
A) FHA, FSA/RHS & VA Home Purchase Loans
B) Conventional Home Purchase Loans
C) Refinancings
D) Home Improvement Loans
F) Non-occupant Loans on < 5 Family Dwellings (A B C & D)
Number
Average Value
Number
Average Value
Number
Average Value
Number
Average Value
Number
Average Value
LOANS ORIGINATED
2
$139,690
60
$126,098
298
$133,332
15
$30,441
71
$152,127
APPLICATIONS APPROVED, NOT ACCEPTED
0
$0
5
$128,280
28
$136,289
2
$35,815
5
$153,120
APPLICATIONS DENIED
3
$97,760
11
$87,575
98
$116,366
13
$29,045
3
$97,690
APPLICATIONS WITHDRAWN
0
$0
8
$114,000
46
$122,101
2
$35,560
6
$126,747
FILES CLOSED FOR INCOMPLETENESS
1
$129,870
2
$80,345
8
$119,800
0
$0
1
$116,460
Aggregated Statistics For Year 2002 (Based on 4 partial tracts)
A) FHA, FSA/RHS & VA Home Purchase Loans
B) Conventional Home Purchase Loans
C) Refinancings
D) Home Improvement Loans
F) Non-occupant Loans on < 5 Family Dwellings (A B C & D)
Number
Average Value
Number
Average Value
Number
Average Value
Number
Average Value
Number
Average Value
LOANS ORIGINATED
4
$104,720
55
$139,337
232
$121,662
12
$25,481
59
$148,506
APPLICATIONS APPROVED, NOT ACCEPTED
0
$0
5
$94,016
25
$112,269
3
$36,620
2
$189,265
APPLICATIONS DENIED
1
$115,800
10
$67,924
55
$108,501
9
$18,431
5
$115,660
APPLICATIONS WITHDRAWN
0
$0
5
$82,852
24
$107,211
1
$24,160
4
$114,352
FILES CLOSED FOR INCOMPLETENESS
0
$0
1
$153,570
22
$112,954
0
$0
0
$0
Aggregated Statistics For Year 2001 (Based on 4 partial tracts)
A) FHA, FSA/RHS & VA Home Purchase Loans
B) Conventional Home Purchase Loans
C) Refinancings
D) Home Improvement Loans
F) Non-occupant Loans on < 5 Family Dwellings (A B C & D)
Number
Average Value
Number
Average Value
Number
Average Value
Number
Average Value
Number
Average Value
LOANS ORIGINATED
6
$86,017
54
$129,669
195
$114,622
26
$23,893
47
$153,107
APPLICATIONS APPROVED, NOT ACCEPTED
0
$0
7
$89,186
14
$110,626
4
$21,400
0
$0
APPLICATIONS DENIED
1
$89,030
15
$63,078
66
$100,939
11
$21,811
3
$114,093
APPLICATIONS WITHDRAWN
0
$0
4
$117,378
27
$106,271
2
$21,975
3
$96,827
FILES CLOSED FOR INCOMPLETENESS
1
$80,710
0
$0
8
$113,049
0
$0
0
$0
Aggregated Statistics For Year 2000 (Based on 4 partial tracts)
A) FHA, FSA/RHS & VA Home Purchase Loans
B) Conventional Home Purchase Loans
C) Refinancings
D) Home Improvement Loans
F) Non-occupant Loans on < 5 Family Dwellings (A B C & D)
Number
Average Value
Number
Average Value
Number
Average Value
Number
Average Value
Number
Average Value
LOANS ORIGINATED
5
$79,844
49
$102,388
58
$106,622
27
$17,550
21
$121,424
APPLICATIONS APPROVED, NOT ACCEPTED
0
$0
5
$43,250
13
$85,673
9
$15,530
0
$0
APPLICATIONS DENIED
0
$0
21
$57,749
34
$74,606
12
$20,422
2
$59,880
APPLICATIONS WITHDRAWN
0
$0
2
$106,010
17
$84,504
1
$37,350
1
$74,540
FILES CLOSED FOR INCOMPLETENESS
0
$0
0
$0
8
$121,748
0
$0
0
$0
Aggregated Statistics For Year 1999 (Based on 2 partial tracts)
A) FHA, FSA/RHS & VA Home Purchase Loans
B) Conventional Home Purchase Loans
C) Refinancings
D) Home Improvement Loans
F) Non-occupant Loans on < 5 Family Dwellings (A B C & D)
Detailed PMIC statistics for the following Tracts:0604.00
, 0605.00
2002 - 2018 National Fire Incident Reporting System (NFIRS) incidents
According to the data from the years 2002 - 2018 the average number of fires per year is 8. The highest number of fire incidents - 17 took place in 2003, and the least - 0 in 2005. The data has a dropping trend.
When looking into fire subcategories, the most incidents belonged to: Outside Fires (50.7%), and Structure Fires (34.7%).
Fire incident types reported to NFIRS in Zip Code 49253


 Nearest zip codes: 49220, 49265, 49235, 49233, 49230, 49282.


 According to the data from the years 2002 - 2018 the average number of fires per year is 8. The highest number of fire incidents - 17 took place in 2003, and the least - 0 in 2005. The data has a dropping trend.
 When looking into fire subcategories, the most incidents belonged to: Outside Fires (50.7%), and Structure Fires (34.7%).