Estimated zip code population in 2022: 3,685 Zip code population in 2010: 3,888 Zip code population in 2000: 4,272
Houses and condos: 1,662 Renter-occupied apartments: 292
% of renters here:
20%
State:
27%
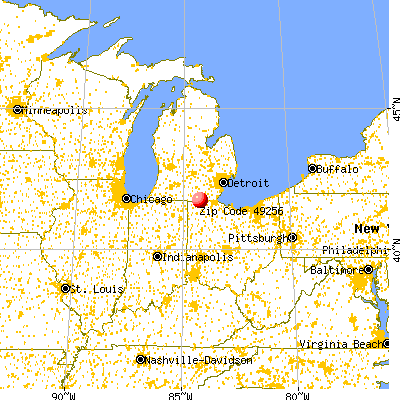
March 2022 cost of living index in zip code 49256: 89.1 (less than average, U.S. average is 100)
Land area: 58.9 sq. mi. Water area: 0.1 sq. mi.
Population density: 63 people per square mile
(very low).
OSM Map
General Map
Google Map
MSN Map
OSM Map
General Map
Google Map
MSN Map
OSM Map
General Map
Google Map
MSN Map
OSM Map
General Map
Google Map
MSN Map
Please wait while loading the map...
Real estate property taxes paid for housing units in 2022:
This zip code:
1.5% ($1,772)
Michigan:
1.2% ($2,746)
Median real estate property taxes paid for housing units with mortgages in 2022: $1,964 (1.5%) Median real estate property taxes paid for housing units with no mortgage in 2022: $1,582 (1.5%)
Business Search- 14 Million verified businesses
Males: 1,918
(52.1%)
Females: 1,766
(47.9%)
For population 25 years and over in 49256:
High school or higher: 86.2%
Bachelor's degree or higher: 11.7%
Graduate or professional degree: 3.7%
Unemployed: 4.3%
Mean travel time to work (commute): 28.8 minutes
For population 15 years and over in 49256:
Never married: 26.6%
Now married: 51.4%
Separated: 0.6%
Widowed: 9.2%
Divorced: 12.2%
Zip code 49256 compared to state average:
Median house value below state average.
Black race population percentage significantly below state average.
Foreign-born population percentage significantly below state average.
Length of stay since moving in significantly above state average.
House age above state average.
Number of college students below state average.
Percentage of population with a bachelor's degree or higher significantly below state average.
Averages for the 2020 tax year for zip code 49256, filed in 2021:
Average Adjusted Gross Income (AGI) in 2020: $47,191 (Individual Income Tax Returns)
Here:
$47,191
State:
$68,945
Salary/wage: $41,523 (reported on 80.0% of returns)
Here:
$41,523
State:
$57,142
(% of AGI for various income ranges: 1001.3% for AGIs below $25k, 3181.5% for AGIs $25k-50k, 6481.6% for AGIs $50k-75k, 9701.0% for AGIs $75k-100k, 17223.0% for AGIs $100k-200k)
Taxable interest for individuals: $694 (reported on 18.8% of returns)
This zip code:
$694
Michigan:
$1,630
(% of AGI for various income ranges: 10.2% for AGIs below $25k, 5.2% for AGIs $25k-50k, 32.1% for AGIs $50k-75k, 17.0% for AGIs $75k-100k, 77.0% for AGIs $100k-200k)
Ordinary dividends: $2,763 (reported on 11.2% of returns)
Here:
$2,763
State:
$6,972
(% of AGI for various income ranges: 19.6% for AGIs below $25k, 12.0% for AGIs $25k-50k, 32.6% for AGIs $50k-75k, 53.0% for AGIs $75k-100k, 274.0% for AGIs $100k-200k)
Net capital gain/loss in AGI: +$10,222 (reported on 10.6% of returns)
Here:
+$10,222
State:
+$20,064
(% of AGI for various income ranges: 16.2% for AGIs below $25k, 19.8% for AGIs $25k-50k, 81.6% for AGIs $50k-75k, 214.0% for AGIs $75k-100k, 1319.0% for AGIs $100k-200k)
Profit/loss from business: +$6,374 (reported on 11.2% of returns)
Here:
+$6,374
State:
+$11,172
(% of AGI for various income ranges: 45.3% for AGIs below $25k, 72.0% for AGIs $25k-50k, 105.8% for AGIs $50k-75k, 518.0% for AGIs $100k-200k)
Taxable individual retirement arrangement distribution: $10,439 (reported on 10.6% of returns)
49256:
$10,439
Michigan:
$19,803
(% of AGI for various income ranges: 71.3% for AGIs below $25k, 123.8% for AGIs $25k-50k, 158.9% for AGIs $50k-75k, 275.0% for AGIs $75k-100k, 486.0% for AGIs $100k-200k)
Taxes paid: $5,150 (reported on 1.2% of returns)
49256:
$5,150
State:
$7,972
(% of AGI for various income ranges: 22.9% for AGIs below $25k)
Earned income credit: $2,161 (reported on 19.4% of returns)
Here:
$2,161
State:
$2,251
(% of AGI for various income ranges: 84.7% for AGIs below $25k, 83.0% for AGIs $25k-50k)
Percentage of individuals using paid preparers for their 2020 taxes: 97.1%
Here:
97%
State:
93%
(% for various income ranges: 95.3% for AGIs below $25k, 97.9% for AGIs $25k-50k, 96.2% for AGIs $50k-75k, 100.0% for AGIs $75k-100k, 100.0% for AGIs $100k-200k, 100.0% for AGIs over 200k)
Averages for the 2012 tax year for zip code 49256, filed in 2013:
Average Adjusted Gross Income (AGI) in 2012: $40,377 (Individual Income Tax Returns)
Here:
$40,377
State:
$55,609
Salary/wage: $35,376 (reported on 81.4% of returns)
Here:
$35,376
State:
$46,782
(% of AGI for various income ranges: 65.6% for AGIs below $25k, 81.3% for AGIs $25k-50k, 78.6% for AGIs $50k-75k, 80.5% for AGIs $75k-100k, 50.8% for AGIs $100k-200k)
Taxable interest for individuals: $693 (reported on 24.6% of returns)
This zip code:
$693
Michigan:
$1,491
(% of AGI for various income ranges: 1.2% for AGIs below $25k, 0.4% for AGIs $25k-50k, 0.4% for AGIs $50k-75k, 0.2% for AGIs $75k-100k, 0.3% for AGIs $100k-200k)
Ordinary dividends: $1,895 (reported on 13.2% of returns)
Here:
$1,895
State:
$6,225
(% of AGI for various income ranges: 1.2% for AGIs below $25k, 0.4% for AGIs $25k-50k, 0.6% for AGIs $50k-75k, 0.3% for AGIs $75k-100k, 0.8% for AGIs $100k-200k)
Net capital gain/loss in AGI: +$17,067 (reported on 10.8% of returns)
Here:
+$17,067
State:
+$9,326
(% of AGI for various income ranges: 0.1% for AGIs $25k-50k, 0.2% for AGIs $50k-75k, 19.0% for AGIs $100k-200k)
Profit/loss from business: +$4,621 (reported on 14.4% of returns)
Here:
+$4,621
State:
+$11,523
(% of AGI for various income ranges: 3.4% for AGIs below $25k, 0.6% for AGIs $25k-50k, 1.6% for AGIs $50k-75k, 4.1% for AGIs $75k-100k)
Taxable individual retirement arrangement distribution: $10,040 (reported on 12.0% of returns)
49256:
$10,040
Michigan:
$15,298
(% of AGI for various income ranges: 4.2% for AGIs below $25k, 2.0% for AGIs $25k-50k, 4.1% for AGIs $50k-75k, 4.3% for AGIs $100k-200k)
Total itemized deductions: $17,010 (24% of AGI, reported on 17.4% of returns)
Here:
$17,010
State:
$21,628
Here:
23.6% of AGI
State:
18.4% of AGI
(% of AGI for various income ranges: 6.7% for AGIs below $25k, 6.8% for AGIs $25k-50k, 6.7% for AGIs $50k-75k, 7.0% for AGIs $75k-100k, 9.1% for AGIs $100k-200k)
Charity contributions: $2,932 (reported on 11.4% of returns)
Here:
$2,932
State:
$4,225
(% of AGI for various income ranges: 0.6% for AGIs $25k-50k, 0.7% for AGIs $50k-75k, 1.1% for AGIs $75k-100k, 1.4% for AGIs $100k-200k)
Taxes paid: $5,438 (reported on 17.4% of returns)
49256:
$5,438
State:
$8,327
(% of AGI for various income ranges: 0.8% for AGIs below $25k, 1.7% for AGIs $25k-50k, 2.2% for AGIs $50k-75k, 2.6% for AGIs $75k-100k, 3.7% for AGIs $100k-200k)
Earned income credit: $2,229 (reported on 21.0% of returns)
Here:
$2,229
State:
$2,306
(% of AGI for various income ranges: 6.3% for AGIs below $25k, 1.6% for AGIs $25k-50k)
Percentage of individuals using paid preparers for their 2012 taxes: 68.9%
Here:
69%
State:
57%
(% for various income ranges: 62.2% for AGIs below $25k, 69.8% for AGIs $25k-50k, 76.9% for AGIs $50k-75k, 76.9% for AGIs $75k-100k, 81.8% for AGIs $100k-200k)
Averages for the 2004 tax year for zip code 49256, filed in 2005:
Average Adjusted Gross Income (AGI) in 2004: $35,497 (Individual Income Tax Returns)
Here:
$35,497
State:
$48,204
Salary/wage: $33,570 (reported on 87.2% of returns)
Here:
$33,570
State:
$42,791
(% of AGI for various income ranges: 88.5% for AGIs below $10k, 75.3% for AGIs $10k-25k, 84.1% for AGIs $25k-50k, 87.8% for AGIs $50k-75k, 86.8% for AGIs $75k-100k, 64.8% for AGIs over 100k)
Taxable interest for individuals: $1,643 (reported on 35.7% of returns)
This zip code:
$1,643
Michigan:
$1,725
(% of AGI for various income ranges: 4.2% for AGIs below $10k, 2.4% for AGIs $10k-25k, 0.7% for AGIs $25k-50k, 0.2% for AGIs $50k-75k, 0.4% for AGIs $75k-100k, 8.0% for AGIs over 100k)
Taxable dividends: $1,617 (reported on 16.2% of returns)
Here:
$1,617
State:
$3,420
(% of AGI for various income ranges: 3.1% for AGIs below $10k, 1.6% for AGIs $10k-25k, 0.7% for AGIs $25k-50k, 0.6% for AGIs $50k-75k, 0.3% for AGIs $75k-100k, 0.5% for AGIs over 100k)
Net capital gain/loss: +$3,573 (reported on 12.5% of returns)
Here:
+$3,573
State:
+$8,532
(% of AGI for various income ranges: 1.6% for AGIs below $10k, -0.5% for AGIs $10k-25k, 0.7% for AGIs $25k-50k, 0.0% for AGIs $50k-75k, 1.5% for AGIs $75k-100k, 7.1% for AGIs over 100k)
Profit/loss from business: +$4,939 (reported on 13.2% of returns)
Here:
+$4,939
State:
+$9,547
(% of AGI for various income ranges: 1.9% for AGIs below $10k, 1.7% for AGIs $10k-25k, 2.8% for AGIs $25k-50k, 0.7% for AGIs $50k-75k, 0.5% for AGIs $75k-100k, 4.3% for AGIs over 100k)
IRA payment deduction: $2,533 (reported on 1.7% of returns)
49256:
$2,533
Michigan:
$2,875
Total itemized deductions: $14,241 (23% of AGI, reported on 22.7% of returns)
Here:
$14,241
State:
$18,509
Here:
23.0% of AGI
State:
20.7% of AGI
(% of AGI for various income ranges: 8.6% for AGIs below $10k, 6.6% for AGIs $10k-25k, 7.1% for AGIs $25k-50k, 9.4% for AGIs $50k-75k, 9.8% for AGIs $75k-100k, 14.6% for AGIs over 100k)
Charity contributions deductions: $3,199 (5% of AGI, reported on 17.3% of returns)
Here:
$3,199
State:
$3,365
Here:
4.8% of AGI
State:
3.6% of AGI
(% of AGI for various income ranges: 0.9% for AGIs $10k-25k, 0.9% for AGIs $25k-50k, 1.2% for AGIs $50k-75k, 1.1% for AGIs $75k-100k, 5.6% for AGIs over 100k)
Total tax: $3,962 (reported on 71.4% of returns)
49256:
$3,962
State:
$7,691
(% of AGI for various income ranges: 1.8% for AGIs below $10k, 3.6% for AGIs $10k-25k, 6.0% for AGIs $25k-50k, 8.0% for AGIs $50k-75k, 10.2% for AGIs $75k-100k, 15.1% for AGIs over 100k)
Earned income credit: $1,640 (reported on 16.0% of returns)
Here:
$1,640
State:
$1,737
Percentage of individuals using paid preparers for their 2004 taxes: 67.4%
Here:
67%
State:
60%
(% for various income ranges: 58.2% for AGIs below $10k, 66.7% for AGIs $10k-25k, 68.4% for AGIs $25k-50k, 72.6% for AGIs $50k-75k, 73.5% for AGIs $75k-100k, 84.9% for AGIs over 100k)
Household received Food Stamps/SNAP in the past 12 months: 139 Household did not receive Food Stamps/SNAP in the past 12 months: 1,338
Women who had a birth in the past 12 months: 56 (33 now married, 22 unmarried) Women who did not have a birth in the past 12 months: 651 (322 now married, 327 unmarried)
Housing units in zip code 49256 with a mortgage: 607 (36 second mortgage, 25 both second mortgage and home equity loan) Houses without a mortgage: 18
Median monthly owner costs for units with a mortgage: $1,090 Median monthly owner costs for units without a mortgage: $514
Residents with income below the poverty level in 2022:
This zip code:
12.4%
Whole state:
13.4%
Residents with income below 50% of the poverty level in 2022:
This zip code:
8.6%
Whole state:
6.9%
Median number of rooms in houses and condos:
Here:
6.9
State:
6.5
Median number of rooms in apartments:
Here:
5.1
State:
4.3
Notable locations in this zip code not listed on our city pages
Notable locations in zip code 49256: Green Valley Campground (A), De-Mor Hills Golf Course (B), Seneca Station (C), Ontario Station (D), North Morenci Station (E), Munson Station (F), Morenci Area Emergency Medical Services (G), Morenci City Police (H), Morenci City Hall (I), Stair Public Library (J), Morenci Fire Department (K). Display/hide their locations on the map
Churches in zip code 49256 include: Canandaigua Community Church (A), Munson United Brethren Church (B), Morenci United Methodist Church (C), First Congregational United Church (D), Church of the Nazarene (E), Trinity Lutheran Church (F), First Baptist Church (G), Seneca Community Church (H), Morenci Bible Fellowship (I). Display/hide their locations on the map
Cemeteries: Porter Cemetery (1), Jehovah's Witnesses (2), Woodworth Cemetery (3), Goss Cemetery (4), Whitney Cemetery (5), Oak Grove Cemetery (6). Display/hide their locations on the map
Streams, rivers, and creeks: Bear Creek (A), Toad Creek (B), Silver Creek (C), Lime Creek (D), Seneca Drain (E), Carter Drain (F), Sampson Drain (G), Mansfield Creek (H), Covell Drain (I). Display/hide their locations on the map
Parks in zip code 49256 include: Wakefield Park (1), Stephenson Park (2), Fractional District Number Three School Historical Marker (3), Taft Memorial Highway Historical Marker (4), Murray D Van Wagoner Memorial Bridge Historical Marker (5), Riverside Park (6). Display/hide their locations on the map
In group quarters: 24 (-1 institutionalized population)
Size of family households: 492 2-persons, 224 3-persons, 164 4-persons, 78 5-persons, 33 6-persons, 20 7-or-more-persons
Size of nonfamily households: 412 1-person, 48 2-persons, 5 4-persons
551 married couples with children.
133 single-parent households (42 men, 91 women).
98.5% of residents of 49256 zip code speak English at home.
1.1% of residents speak Spanish at home (100% very well).
0.1% of residents speak other Indo-European language at home (100% very well).
0.1% of residents speak other language at home (100% very well).
Foreign born population: 18 (0.5%) (38.0% of them are naturalized citizens)
This zip code:
0.5%
Whole state:
6.9%
26%Sudan
21%Romania
21%Honduras
11%Sweden
11%United Kingdom, excluding England and Scotland
42%German
22%English
15%American
4%Irish
3%Italian
2%European
2%Dutch
Year of entry for the foreign-born population
52010 or later
172000 to 2009
01990 to 1999
9Before 1990
Facilities with environmental interests located in this zip code:
BORDEN CHEMICAL SMITH-DOUGLASS DIVISION (209 EAST COOMER STREET in MORENCI, MI)
(Resource Conservation and Recovery Act (tracking hazardous waste))
MI DEPT/ENVIRONMENTAL QUALITY (202 NORTH ST in MORENCI, MI)
(Resource Conservation and Recovery Act (tracking hazardous waste)) Organizations: MDEQ CMI SITE (CONTACT/OWNER)
Alternative names: MI DEPT/ENVIRONMENTAL QUALITY RRD
MI DEPT/TRANSPORTATION BRIDGE B02-46032 (M-156 OVER SILVER CR in MORENCI, MI)
(Resource Conservation and Recovery Act (tracking hazardous waste)) Organizations: MICH DEPT OF TRANSPORTATION (CONTACT/OPERATOR)
Alternative names: MIDOT BRIDGE M-156 OVER SILVER CREEK
MI DEPT/TRANSPORTATION BRIDGE P01-46032 (M-156 PED WALK OVER SILVER CRE in MORENCI, MI)
Conditionally Exempt Small Quantity Generators, less than 100 kg/month of hazardous waste (Resource Conservation and Recovery Act (tracking hazardous waste)) Organizations: MICH DEPT OF TRANSPORTATION (CONTACT/OPERATOR)
Alternative names: MI DEPT/TRANS BRIDGE P01-46032 M-156 PED
Housing units lacking complete plumbing facilities: 2.3% Housing units lacking complete kitchen facilities: 2.0%
53.6%Utility gas
25.1%Bottled, tank, or LP gas
6.1%Electricity
5.3%Other fuel
5.1%Wood
4.5%Fuel oil, kerosene, etc.
0.6%No fuel used
Population in 1990: 4,699.
Place of birth for U.S.-born residents:
This state: 2,576
Northeast: 55
Midwest: 785
South: 221
West: 17
64% of the 49256 zip code residents lived in the same house 5 years ago. Out of people who lived in different houses, 62% lived in this county. Out of people who lived in different counties, 50% lived in Michigan.
94% of the 49256 zip code residents lived in the same house 1 year ago. Out of people who lived in different houses, 73% moved from this county. Out of people who lived in different houses, 11% moved from different county within same state. Out of people who lived in different houses, 16% moved from different state.
Private vs. public school enrollment:
Students in private schools in grades 1 to 8 (elementary and middle school): 13
Here:
4.1%
Michigan:
12.4%
Students in private schools in grades 9 to 12 (high school): 28
Here:
16.0%
Michigan:
9.8%
Students in private undergraduate colleges: 13
Here:
20.8%
Michigan:
14.9%
Occupation by median earnings in the past 12 months ($)
70,280Community and social service occupations
69,202Health diagnosing and treating practitioners and other technical occupations
61,339Business and financial operations occupations
56,756Life, physical, and social science occupations
55,463Installation, maintenance, and repair occupations
48,939Education, training, and library occupations
Companies with federal contracts located in this zip code:
ROTH FABRICATING, INC (9600 SKYLINE DR in MORENCI, MI; small business) 500 employees, $0 revenue. : $11,786,307 in 124 contractsfrom 2001 to 2006
Contracts for Miscellaneous Weapons, Vehicular Cab, Body, and Frame Structural Components, Vehicular Furniture and Accessories, Miscellaneous Materials Handling Equipment, and moreby Defense Logistics Agency, Army Signed by year:2000: $0; 2001: $220,638; 2002: $214,194; 2003: $1,258,095; 2004: $2,795,012; 2005: $6,055,234; 2006: $1,243,134.
Biggest contracts:
$947,527 with Defense Logistics Agency for Miscellaneous Weapons. Signed on 2005-11-23. Completion date: 2006-07-01.
$838,150 with Army for Vehicular Cab, Body, and Frame Structural Components. Signed on 2003-10-04. Completion date: 2004-12-31.
$711,210, same as above.Signed on 2005-10-06. Completion date: 2006-01-31.
$658,228 with Defense Logistics Agency for Vehicular Furniture and Accessories. Signed on 2004-01-15. Completion date: 2004-05-15.
GENERAL BROACH COMPANY (307 SALISBURY ST in MORENCI, MI)
$6,700 with Army for Machine Tool Accessories. Signed on 2005-01-27. Completion date: 2005-05-20.
Top industries in this zip code by the number of employees in 2005:
Detailed PMIC statistics for the following Tracts:0619.00
2002 - 2018 National Fire Incident Reporting System (NFIRS) incidents
According to the data from the years 2002 - 2018 the average number of fires per year is 19. The highest number of fire incidents - 35 took place in 2002, and the least - 7 in 2017. The data has a dropping trend.
When looking into fire subcategories, the most incidents belonged to: Outside Fires (46.2%), and Structure Fires (37.7%).
Fire incident types reported to NFIRS in Zip Code 49256


 Nearest zip codes: 49289, 49279, 49235, 43521, 43533, 49247.


 According to the data from the years 2002 - 2018 the average number of fires per year is 19. The highest number of fire incidents - 35 took place in 2002, and the least - 7 in 2017. The data has a dropping trend.
 When looking into fire subcategories, the most incidents belonged to: Outside Fires (46.2%), and Structure Fires (37.7%).